| Param | Original file | Final file |
|---|---|---|
| Filename | modeM0/AS1T03_259T01_9000003972_27577cztM0_level2.evt | modeM0/AS1T03_259T01_9000003972_27577cztM0_level2_quad_clean.evt |
| Size (bytes) | 696,116,160 | 76,798,080 |
| Size | 663.9 MB | 73.2 MB |
| Events in quadrant A | 3,276,352 | 489,696 |
| Events in quadrant B | 3,895,551 | 496,271 |
| Events in quadrant C | 3,392,507 | 477,369 |
| Events in quadrant D | 10,055,463 | 386,097 |
| Mode M9 | |||
|---|---|---|---|
| Quadrant | BADHDUFLAG | Total packets | Discarded packets |
| A | 0 | 10 | 0 |
| B | 0 | 10 | 0 |
| C | 0 | 10 | 0 |
| D | 0 | 10 | 0 |
| Mode M0 | |||
|---|---|---|---|
| Quadrant | BADHDUFLAG | Total packets | Discarded packets |
| A | 0 | 13924 | 0 |
| B | 0 | 15780 | 0 |
| C | 0 | 14193 | 0 |
| D | 0 | 34384 | 0 |
| Quadrant | Total seconds | Saturated seconds | Saturation percentage |
|---|---|---|---|
| A | 6827 | 40 | 0.585909% |
| B | 6827 | 144 | 2.109272% |
| C | 6827 | 91 | 1.332943% |
| D | 6828 | 2482 | 36.350322% |
Noise dominated data is calculated using 1-second bins in cleaned event files. If a bin has >2000 counts, and if more than 50% of those come from <1% of pixels, then it is considered to be noise-dominated and hence unusable.
| Quadrant | # 1 sec bins | Bins with >0 counts | Bins with >2000 counts | High rate bins dominated by noise | Noise dominated (total time) | Noise dominated (detector-on time) | Marked lightcurve |
|---|---|---|---|---|---|---|---|
| A | 7777 | 6828 | 0 | 0 | 0.00% | 0.00% | 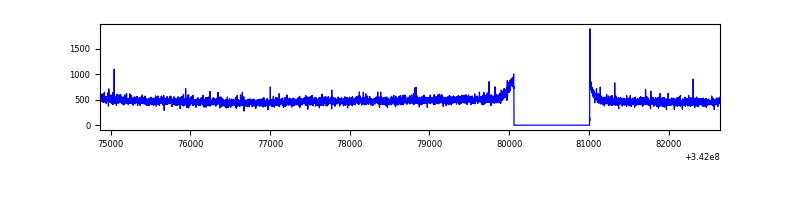 |
| B | 7777 | 6828 | 62 | 62 | 0.80% | 0.91% | 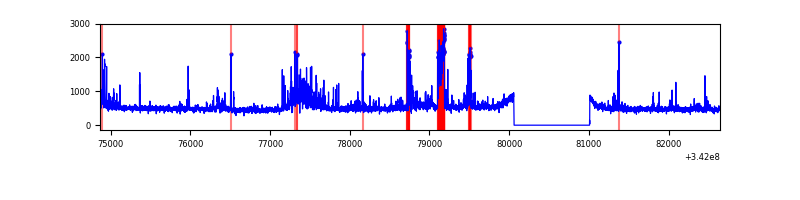 |
| C | 7777 | 6828 | 11 | 11 | 0.14% | 0.16% | 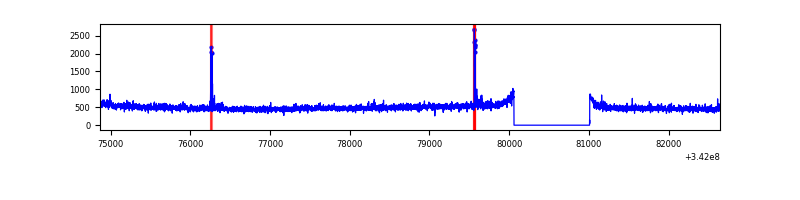 |
| D | 7778 | 6829 | 2519 | 2519 | 32.39% | 36.89% | 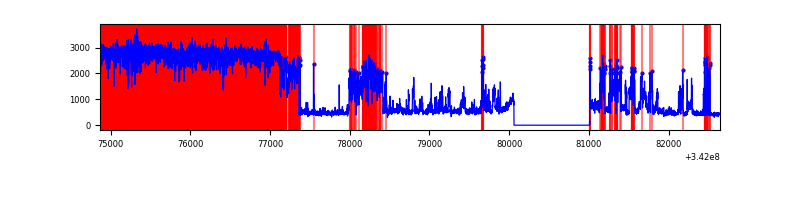 |
Top three noisy pixels from each quadrant. If the there are fewer than three noisy pixels in the level2.evt file, extra rows are filled as -1
| Pixel properties | Quadrant properties | ||||||
|---|---|---|---|---|---|---|---|
| Quadrant | DetID | PixID | Counts | Sigma | Mean | Median | Sigma |
| A | 13 | 254 | 11546 | 62.62 | 848 | 830 | 171.1 |
| A | 3 | 137 | 7807 | 40.77 | 848 | 830 | 171.1 |
| A | 8 | 192 | 7431 | 38.57 | 848 | 830 | 171.1 |
| B | 10 | 245 | 361354 | 2287.39 | 841 | 821 | 157.6 |
| B | 3 | 64 | 168181 | 1061.81 | 841 | 821 | 157.6 |
| B | 4 | 200 | 26729 | 164.37 | 841 | 821 | 157.6 |
| C | 14 | 238 | 132048 | 691.63 | 817 | 825 | 189.7 |
| C | 2 | 16 | 41868 | 216.32 | 817 | 825 | 189.7 |
| C | 4 | 175 | 16062 | 80.31 | 817 | 825 | 189.7 |
| D | 7 | 80 | 6024974 | 40573.76 | 628 | 611 | 148.5 |
| D | 1 | 52 | 1410261 | 9493.92 | 628 | 611 | 148.5 |
| D | 6 | 112 | 126080 | 845.03 | 628 | 611 | 148.5 |
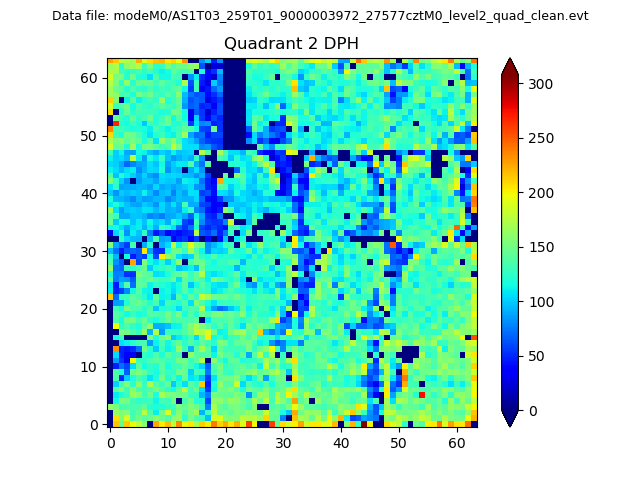
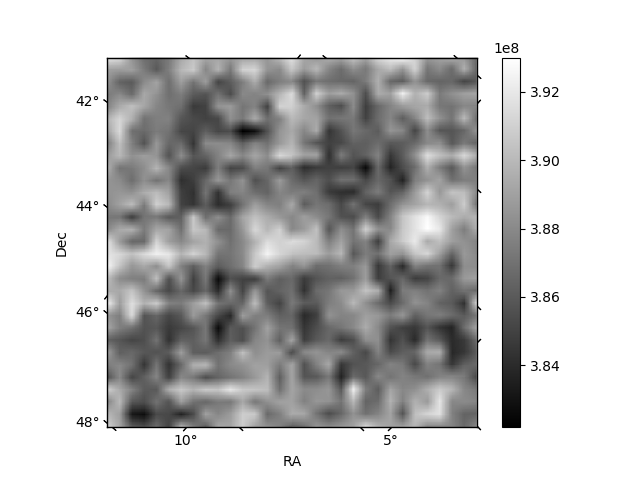
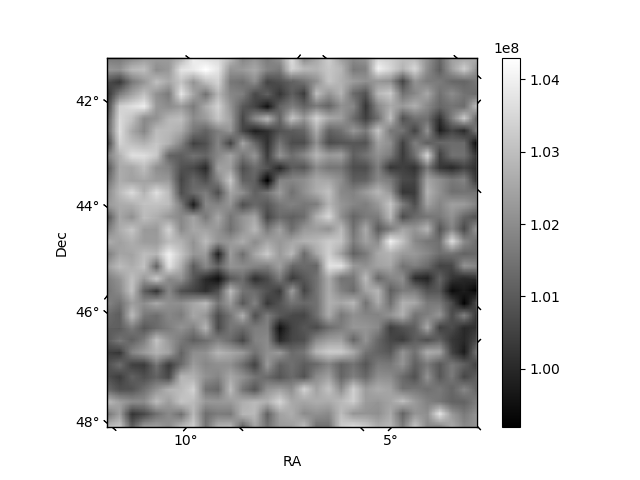
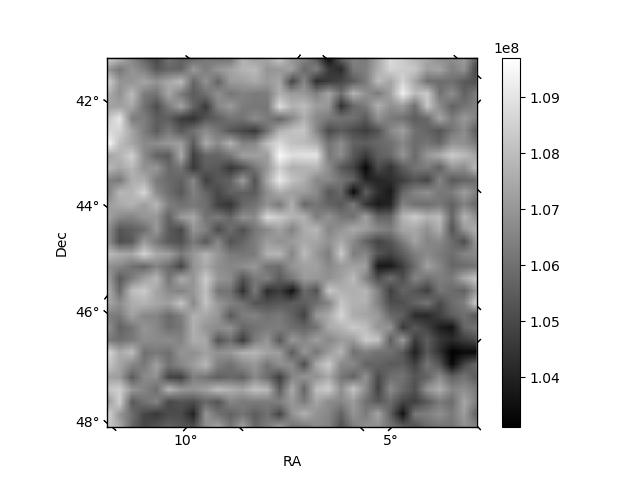
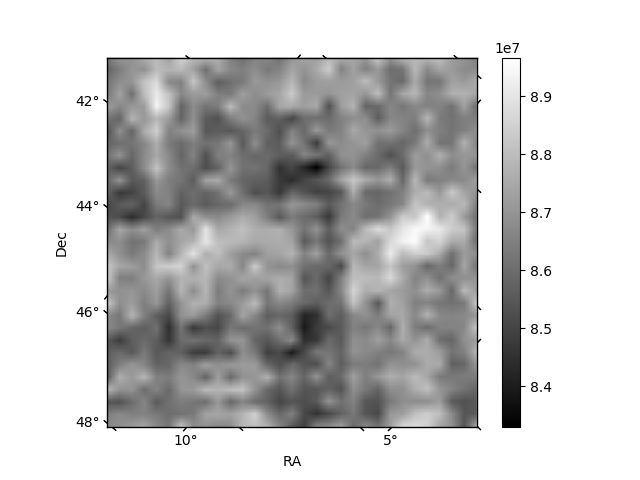
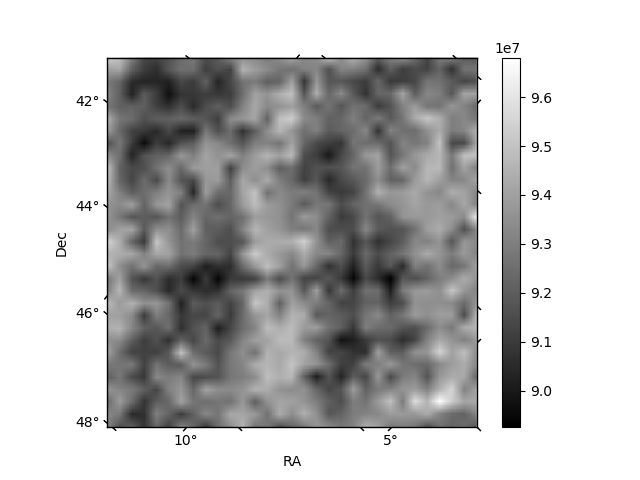
Histogram calculated using DETX and DETY for each event in the final _common_clean file
| Quadrant A | 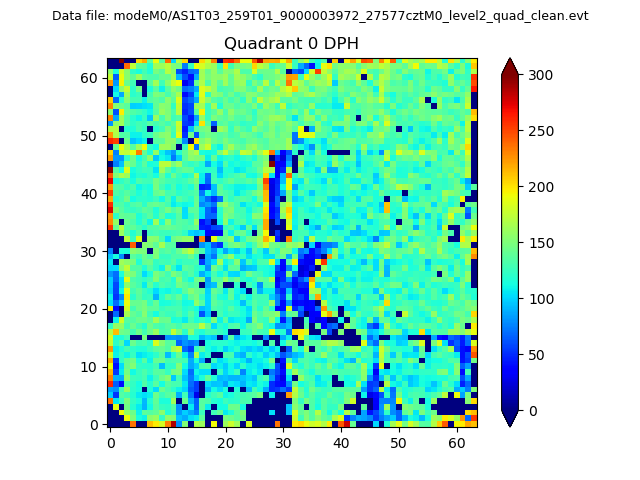 |
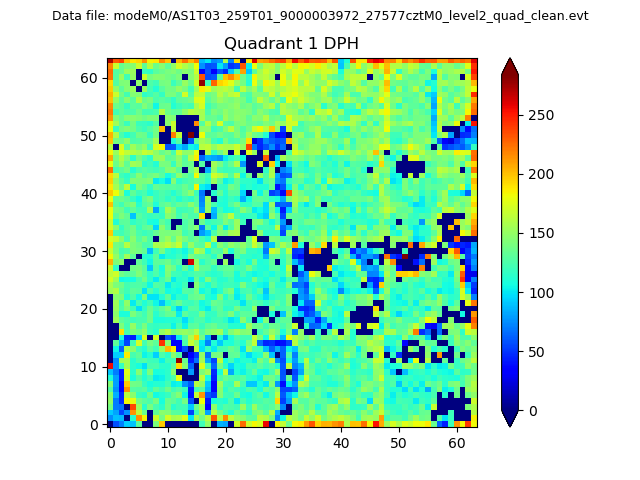 |
Quadrant B |
|---|---|---|---|
| Quadrant D | 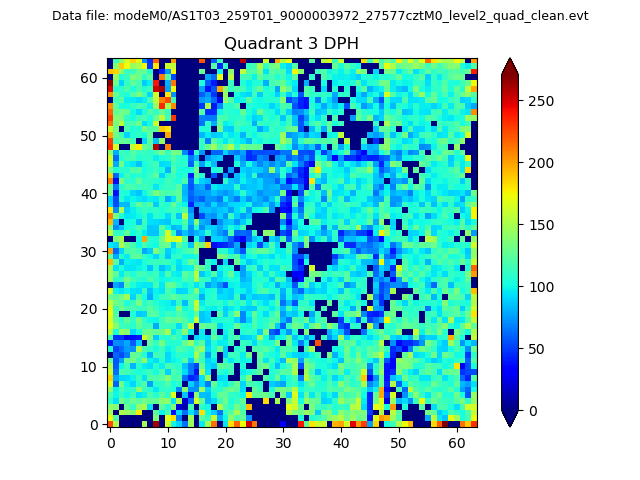 |
 |
Quadrant C |
| Plot type | Count rate plots | Images |
|---|---|---|
| Comparison with Poisson distribution Blue bars denote a histogram of data divided into 1 sec bins. Red curve is a Poisson curve with rate = median count rate of data. |
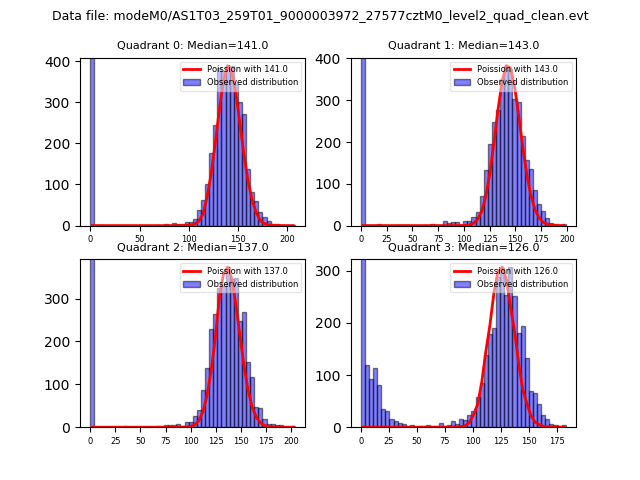 |
 |
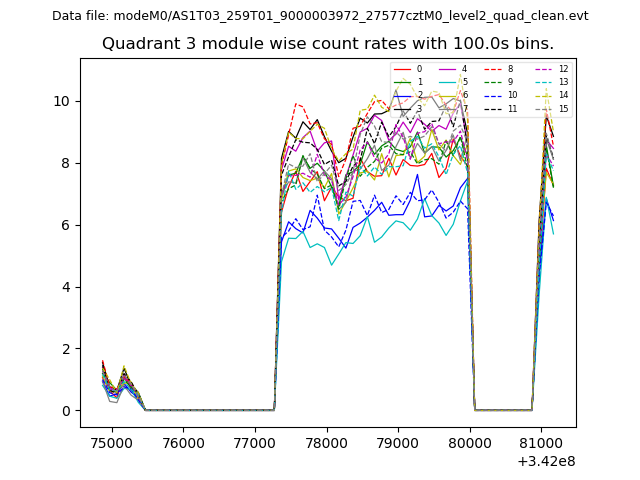
| Quadrant-wise count rates Data is divided into 100 sec bins |
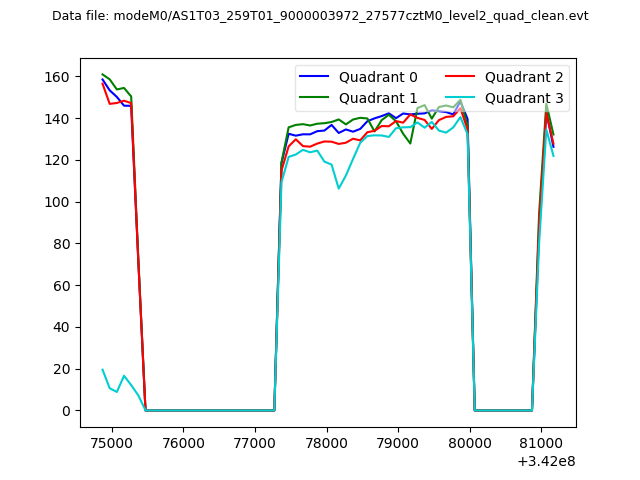 |
|
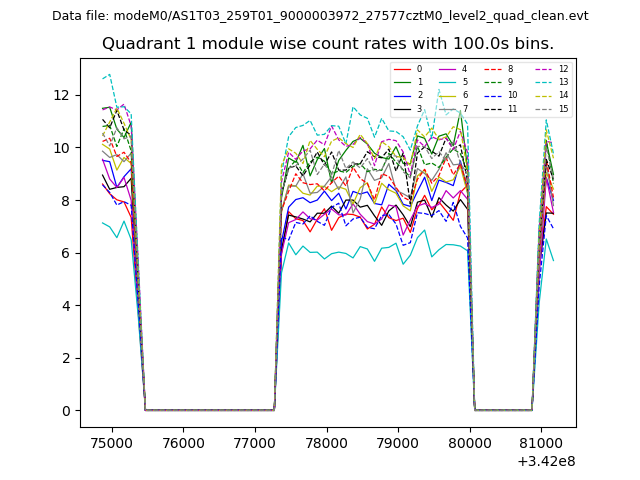
| Module-wise count rates for Quadrant A Data is divided into 100 sec bins |
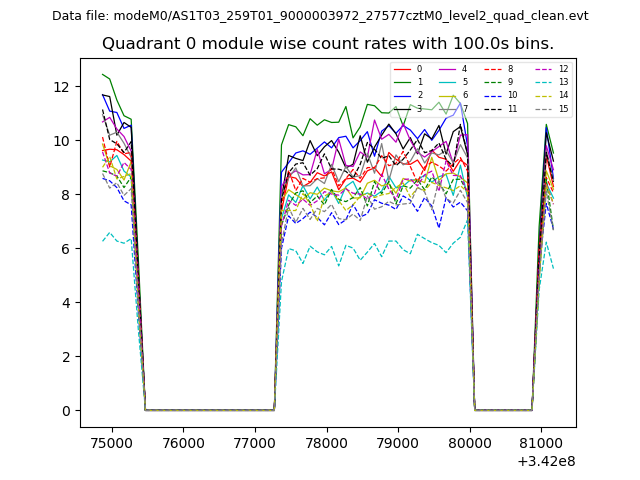 |
 |
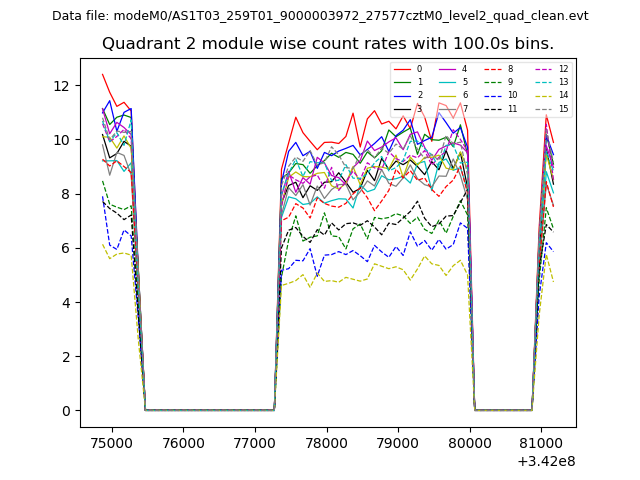
| Module-wise count rates for Quadrant B Data is divided into 100 sec bins |
 |
 |
| Module-wise count rates for Quadrant C Data is divided into 100 sec bins |
 |
 |
| Module-wise count rates for Quadrant D Data is divided into 100 sec bins |
 |
 |
| Parameter | Plot |
|---|---|
| CZT HV Monitor | 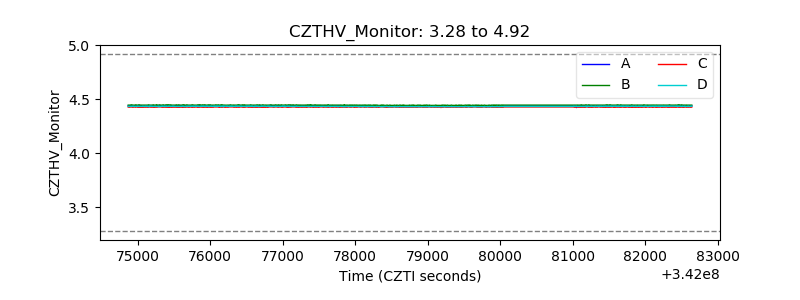 |
| D_VDD | 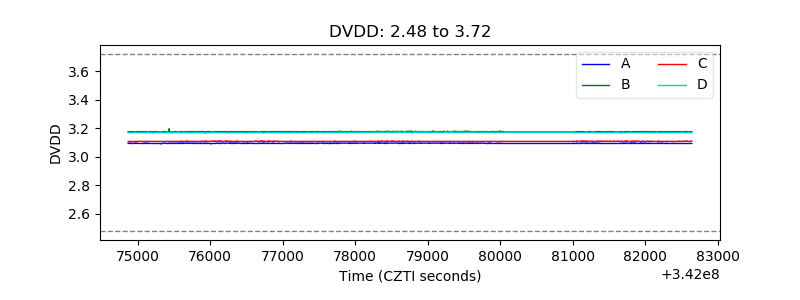 |
| Temperature 1 | 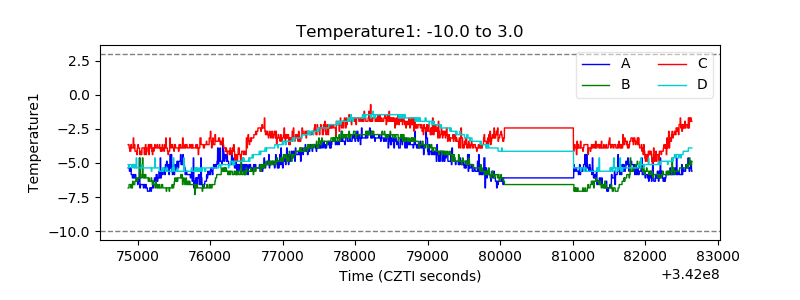 |
| Veto HV Monitor | 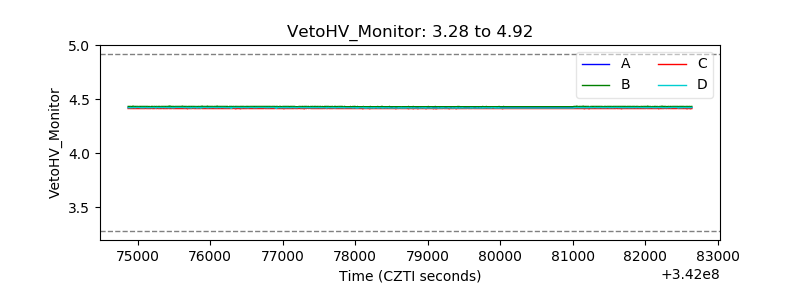 |
| Veto LLD | 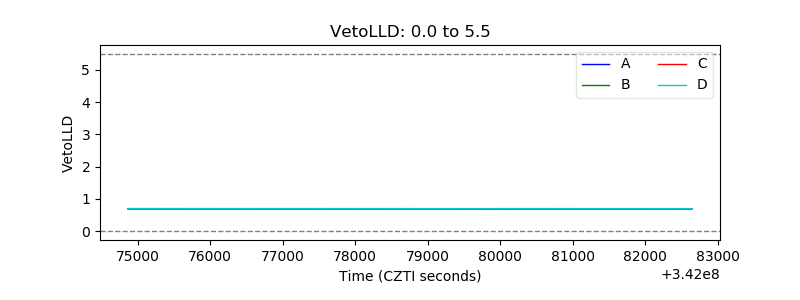 |
| Alpha Counter | 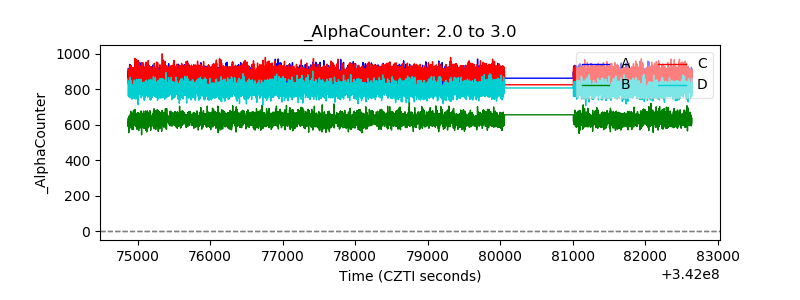 |
| _CPM_Rate | 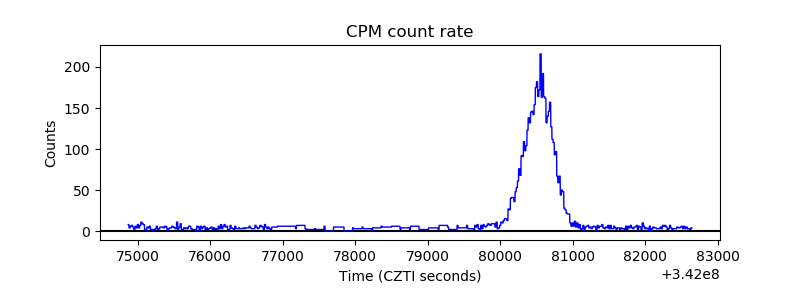 |
| CZT Counter | 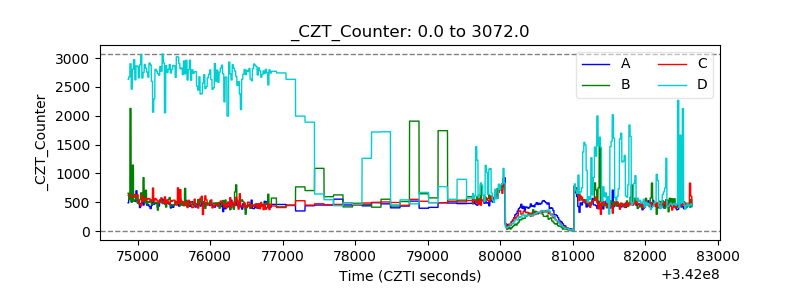 |
| +2.5 Volts monitor | 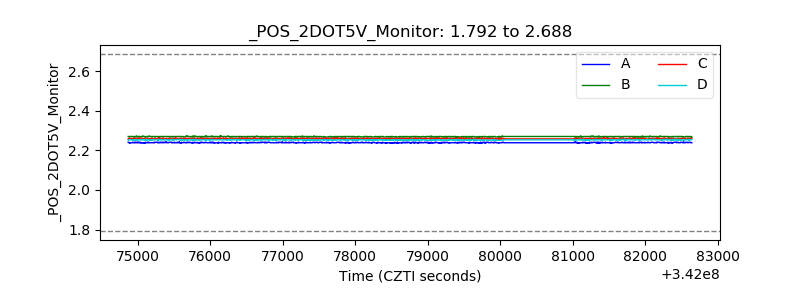 |
| +5 Volts monitor | 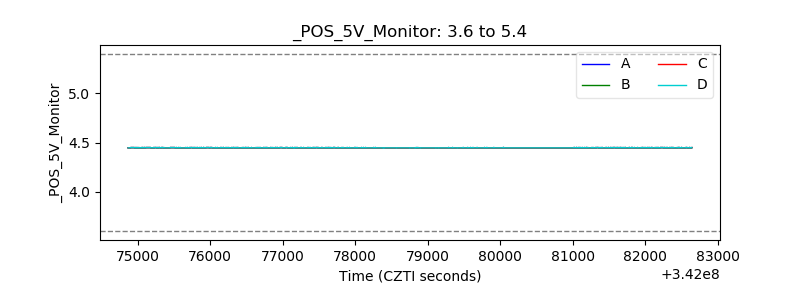 |
| _ROLL_ROT | 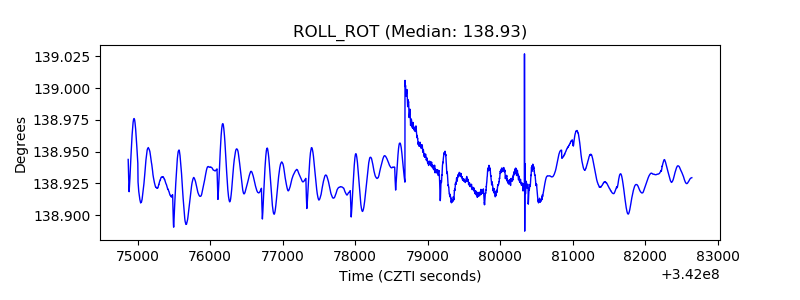 |
| _Roll_DEC | 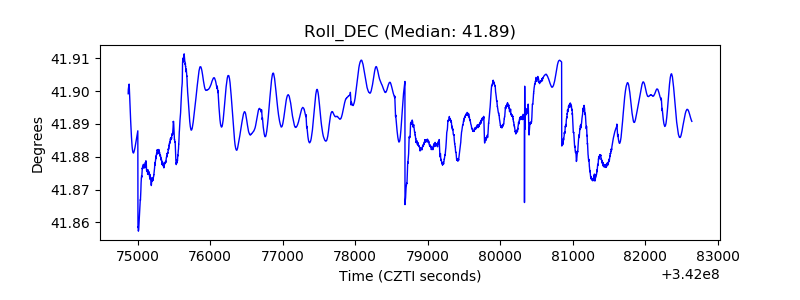 |
| _Roll_RA | 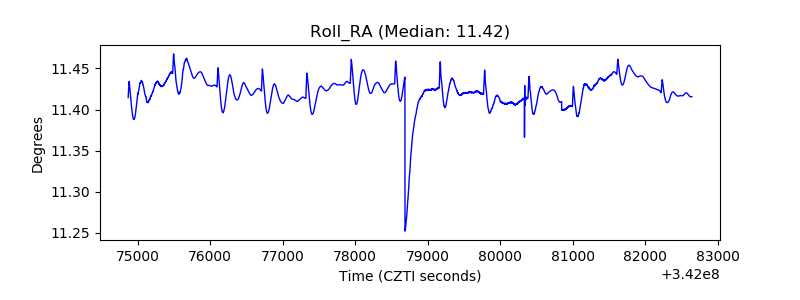 |
| Veto Counter | 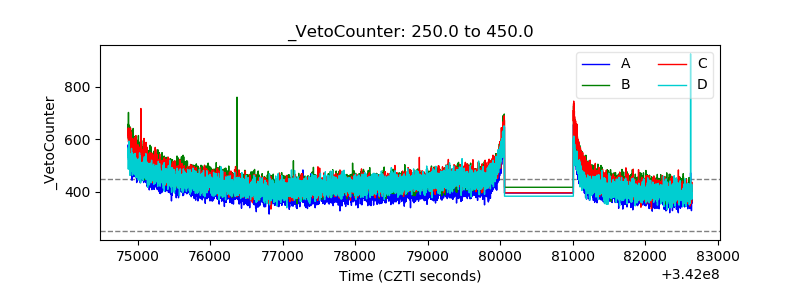 |