| Param | Original file | Final file |
|---|---|---|
| Filename | modeM0/AS1T03_259T01_9000003972_27579cztM0_level2.evt | modeM0/AS1T03_259T01_9000003972_27579cztM0_level2_quad_clean.evt |
| Size (bytes) | 656,766,720 | 100,391,040 |
| Size | 626.3 MB | 95.7 MB |
| Events in quadrant A | 4,323,663 | 616,435 |
| Events in quadrant B | 4,404,373 | 627,106 |
| Events in quadrant C | 4,324,564 | 611,454 |
| Events in quadrant D | 6,249,275 | 582,529 |
| Mode M9 | |||
|---|---|---|---|
| Quadrant | BADHDUFLAG | Total packets | Discarded packets |
| A | 0 | 4 | 0 |
| B | 0 | 4 | 0 |
| C | 0 | 4 | 0 |
| D | 0 | 4 | 0 |
| Mode M0 | |||
|---|---|---|---|
| Quadrant | BADHDUFLAG | Total packets | Discarded packets |
| A | 0 | 18512 | 0 |
| B | 0 | 18566 | 0 |
| C | 0 | 18259 | 0 |
| D | 0 | 24412 | 0 |
| Quadrant | Total seconds | Saturated seconds | Saturation percentage |
|---|---|---|---|
| A | 8675 | 393 | 4.530259% |
| B | 8676 | 446 | 5.140618% |
| C | 8675 | 391 | 4.507205% |
| D | 8675 | 576 | 6.639769% |
Noise dominated data is calculated using 1-second bins in cleaned event files. If a bin has >2000 counts, and if more than 50% of those come from <1% of pixels, then it is considered to be noise-dominated and hence unusable.
| Quadrant | # 1 sec bins | Bins with >0 counts | Bins with >2000 counts | High rate bins dominated by noise | Noise dominated (total time) | Noise dominated (detector-on time) | Marked lightcurve |
|---|---|---|---|---|---|---|---|
| A | 9105 | 8676 | 43 | 43 | 0.47% | 0.50% | 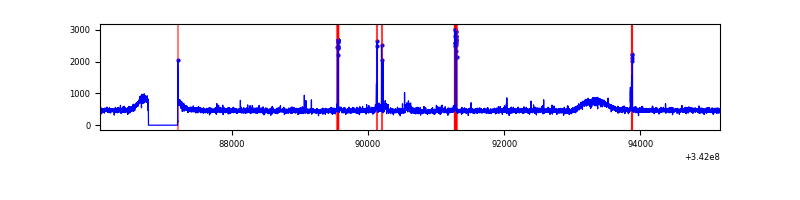 |
| B | 9106 | 8677 | 11 | 11 | 0.12% | 0.13% | 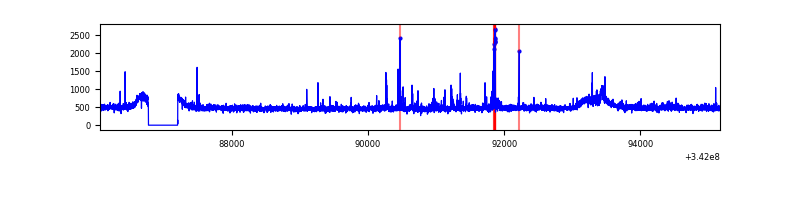 |
| C | 9105 | 8676 | 6 | 6 | 0.07% | 0.07% | 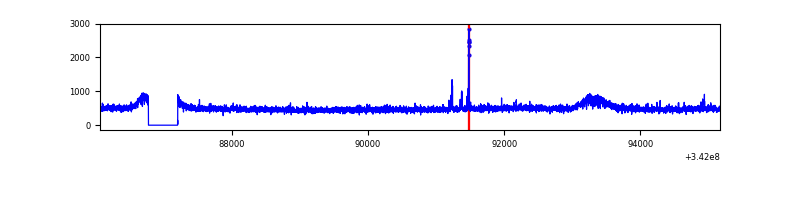 |
| D | 9105 | 8676 | 266 | 266 | 2.92% | 3.07% | 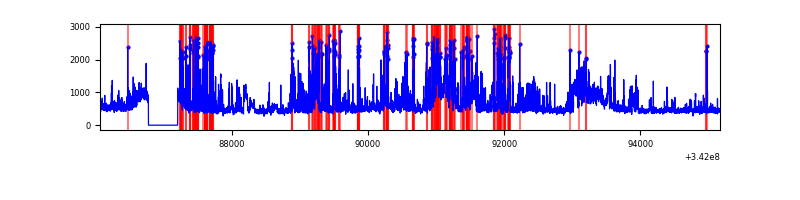 |
Top three noisy pixels from each quadrant. If the there are fewer than three noisy pixels in the level2.evt file, extra rows are filled as -1
| Pixel properties | Quadrant properties | ||||||
|---|---|---|---|---|---|---|---|
| Quadrant | DetID | PixID | Counts | Sigma | Mean | Median | Sigma |
| A | 15 | 169 | 144174 | 661.33 | 1076 | 1052 | 216.4 |
| A | 14 | 235 | 19819 | 86.72 | 1076 | 1052 | 216.4 |
| A | 13 | 254 | 15017 | 64.53 | 1076 | 1052 | 216.4 |
| B | 10 | 245 | 63785 | 299.54 | 1073 | 1040 | 209.5 |
| B | 3 | 64 | 54361 | 254.55 | 1073 | 1040 | 209.5 |
| B | 15 | 222 | 48238 | 225.32 | 1073 | 1040 | 209.5 |
| C | 14 | 238 | 165164 | 674.73 | 1042 | 1047 | 243.2 |
| C | 14 | 67 | 48655 | 195.73 | 1042 | 1047 | 243.2 |
| C | 2 | 16 | 28877 | 114.42 | 1042 | 1047 | 243.2 |
| D | 1 | 52 | 1738122 | 7104.23 | 1035 | 1005 | 244.5 |
| D | 7 | 69 | 239763 | 976.44 | 1035 | 1005 | 244.5 |
| D | 6 | 112 | 232769 | 947.84 | 1035 | 1005 | 244.5 |
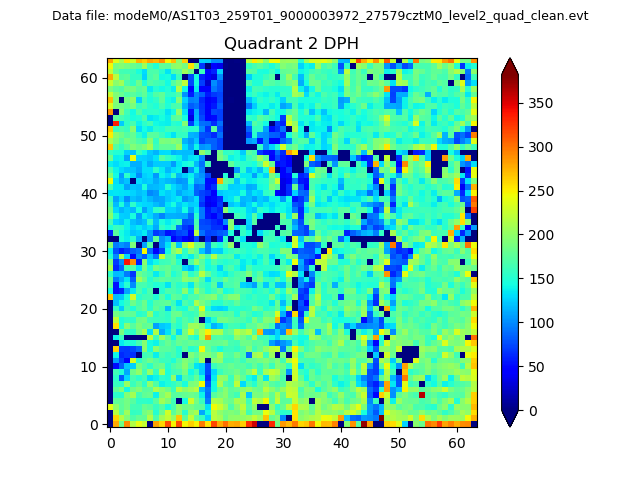
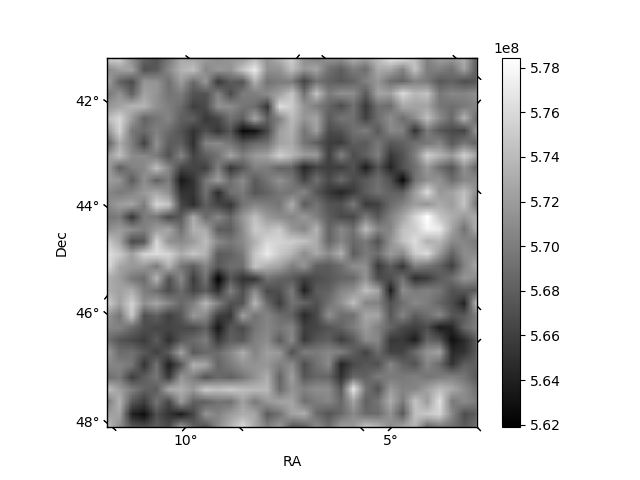
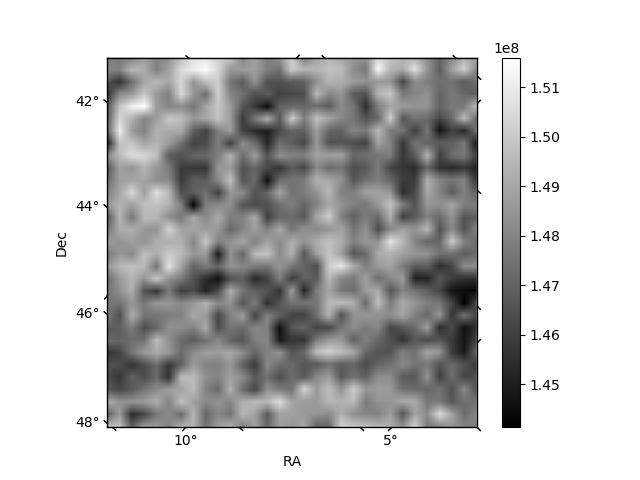
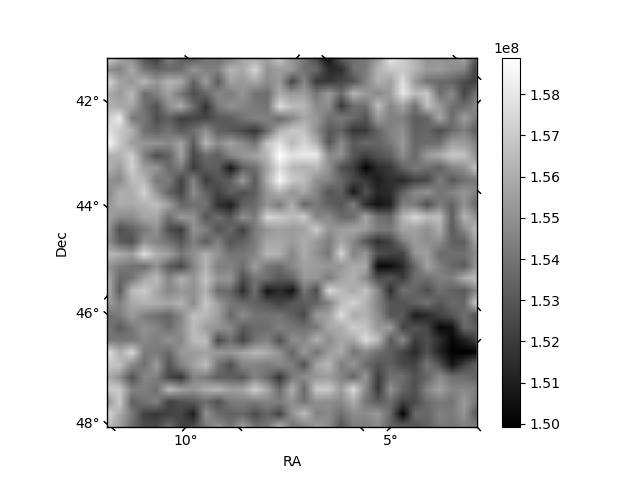
Histogram calculated using DETX and DETY for each event in the final _common_clean file
| Quadrant A | 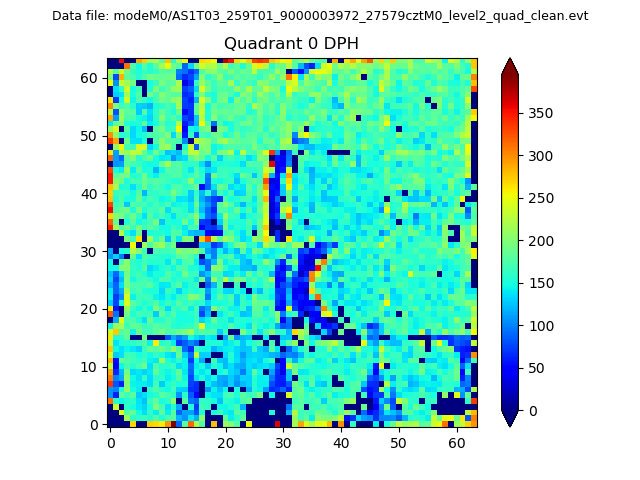 |
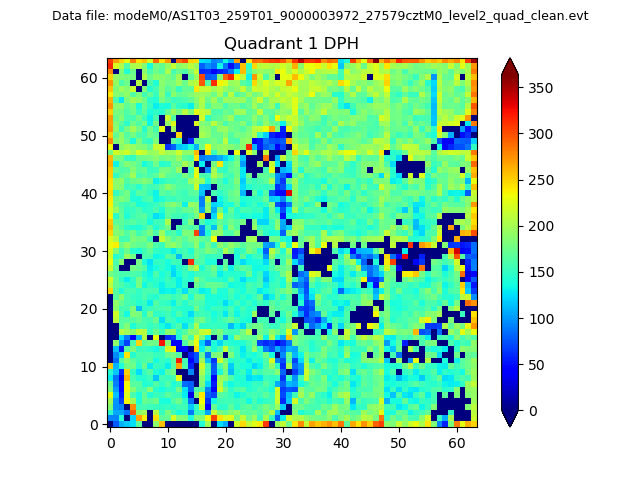 |
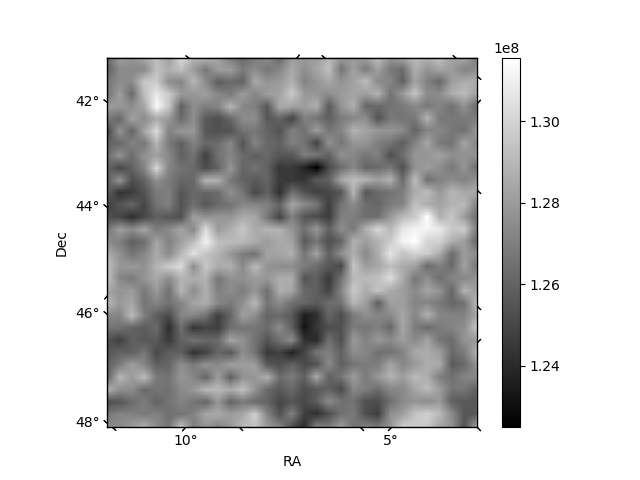
Quadrant B |
|---|---|---|---|
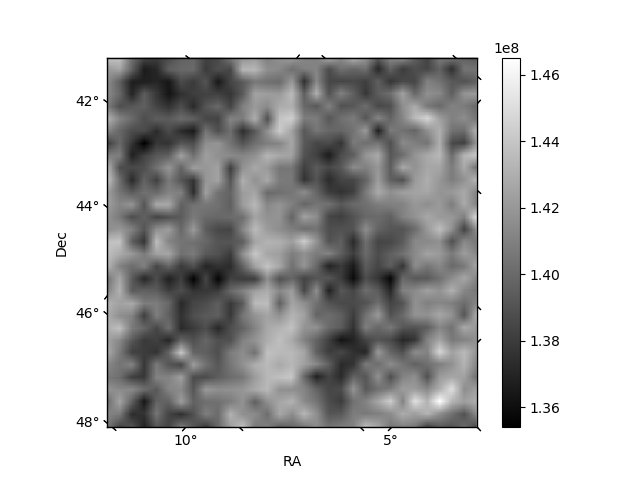
| Quadrant D | 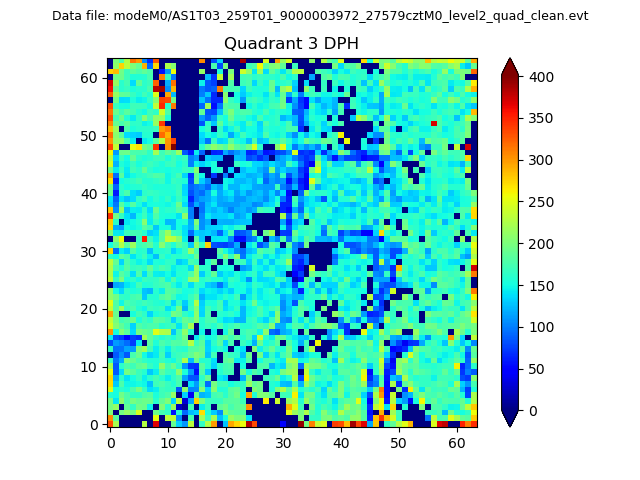 |
 |
Quadrant C |
| Plot type | Count rate plots | Images |
|---|---|---|
| Comparison with Poisson distribution Blue bars denote a histogram of data divided into 1 sec bins. Red curve is a Poisson curve with rate = median count rate of data. |
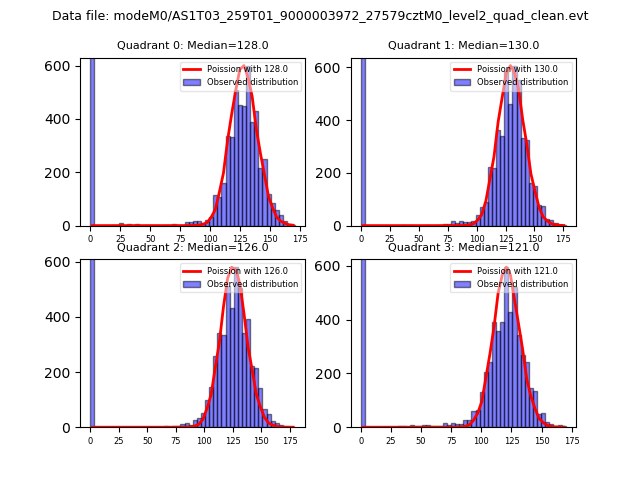 |
 |
| Quadrant-wise count rates Data is divided into 100 sec bins |
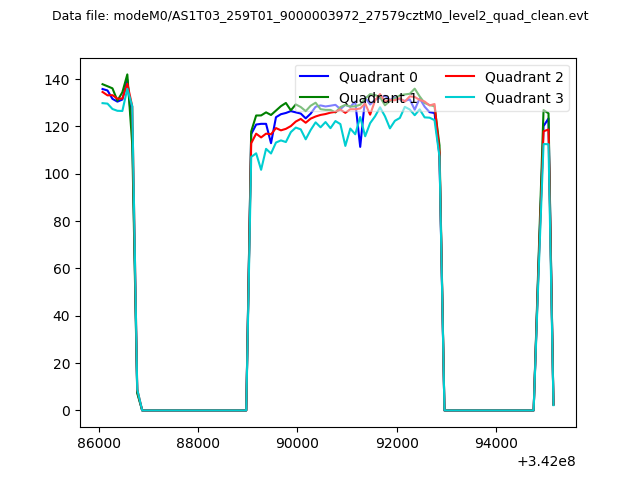 |
|
| Module-wise count rates for Quadrant A Data is divided into 100 sec bins |
 |
 |
| Module-wise count rates for Quadrant B Data is divided into 100 sec bins |
 |
 |
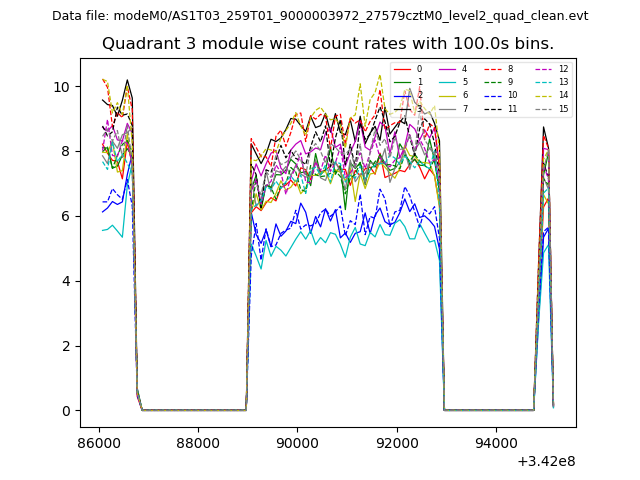
| Module-wise count rates for Quadrant C Data is divided into 100 sec bins |
 |
 |
| Module-wise count rates for Quadrant D Data is divided into 100 sec bins |
 |
 |
| Parameter | Plot |
|---|---|
| CZT HV Monitor |  |
| D_VDD | 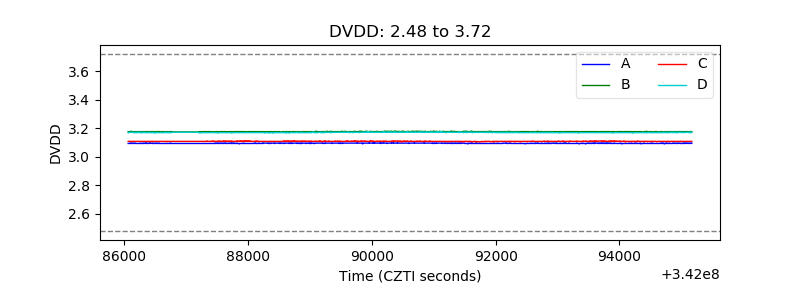 |
| Temperature 1 | 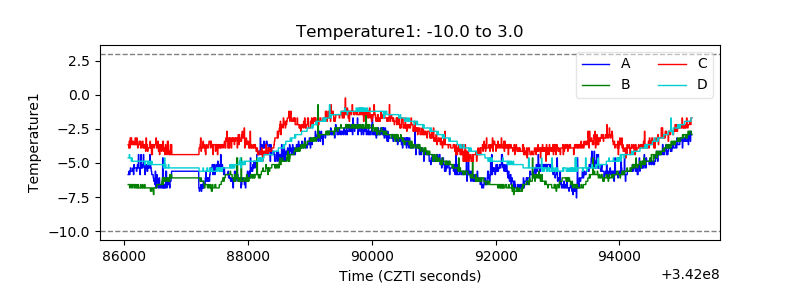 |
| Veto HV Monitor |  |
| Veto LLD | 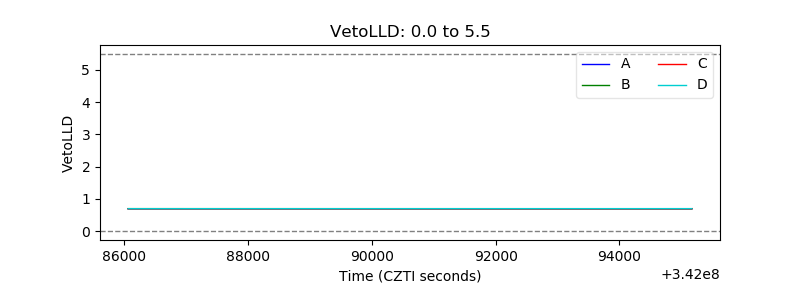 |
| Alpha Counter | 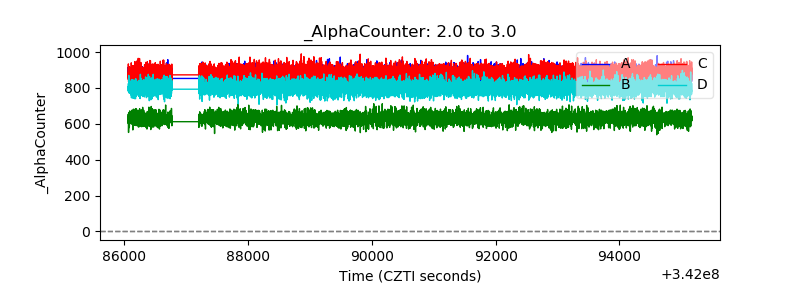 |
| _CPM_Rate | 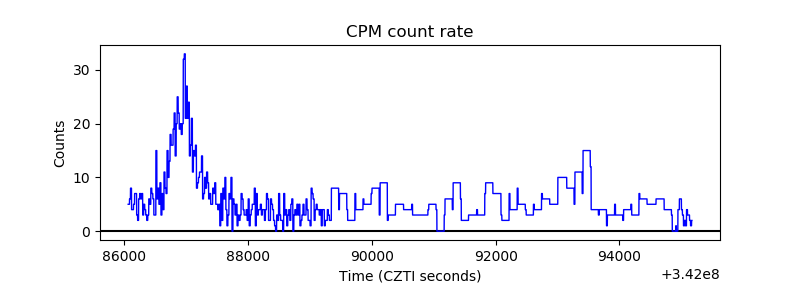 |
| CZT Counter | 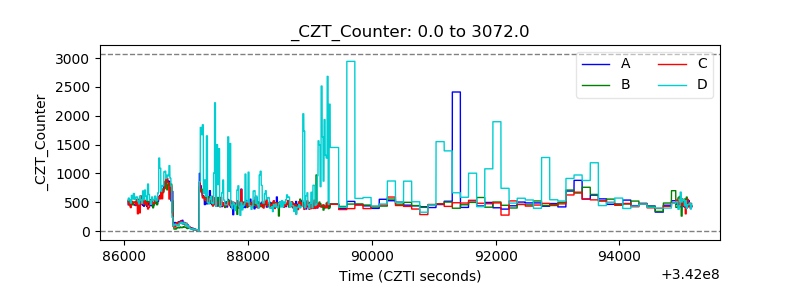 |
| +2.5 Volts monitor | 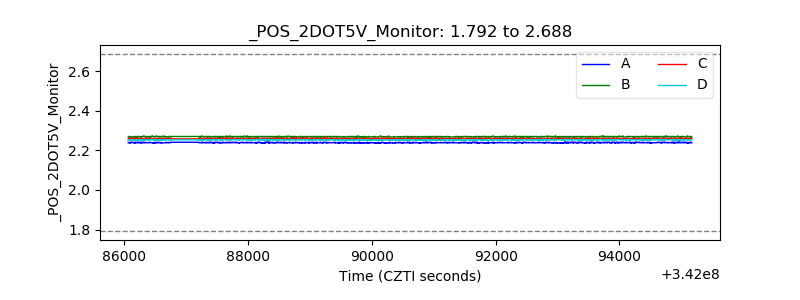 |
| +5 Volts monitor |  |
| _ROLL_ROT |  |
| _Roll_DEC | 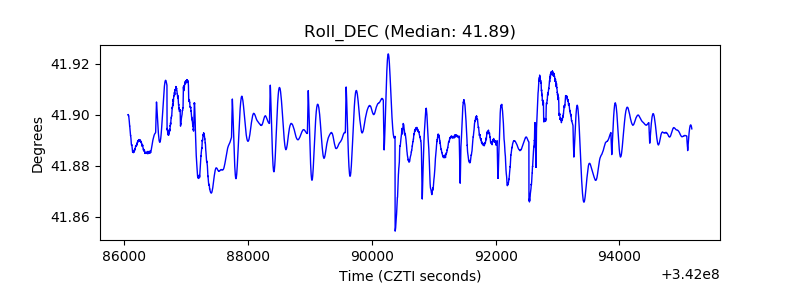 |
| _Roll_RA |  |
| Veto Counter | 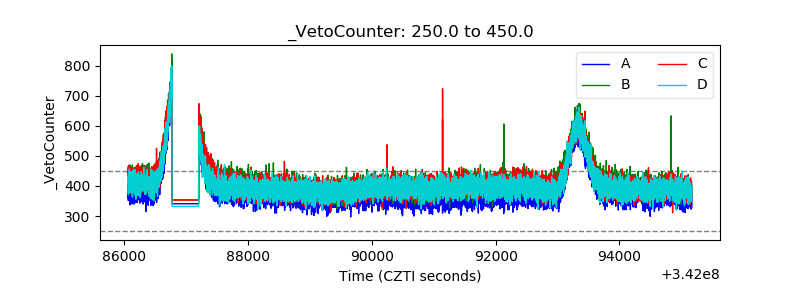 |