| Param | Original file | Final file |
|---|---|---|
| Filename | modeM0/AS1T03_259T01_9000003972_27580cztM0_level2.evt | modeM0/AS1T03_259T01_9000003972_27580cztM0_level2_quad_clean.evt |
| Size (bytes) | 560,341,440 | 92,770,560 |
| Size | 534.4 MB | 88.5 MB |
| Events in quadrant A | 3,749,475 | 577,180 |
| Events in quadrant B | 3,980,572 | 583,850 |
| Events in quadrant C | 3,984,482 | 560,365 |
| Events in quadrant D | 4,719,690 | 539,171 |
| Mode M9 | |||
|---|---|---|---|
| Quadrant | BADHDUFLAG | Total packets | Discarded packets |
| A | 0 | 1 | 0 |
| B | 0 | 1 | 0 |
| C | 0 | 1 | 0 |
| D | 0 | 1 | 0 |
| Mode M0 | |||
|---|---|---|---|
| Quadrant | BADHDUFLAG | Total packets | Discarded packets |
| A | 0 | 16308 | 0 |
| B | 0 | 16819 | 0 |
| C | 0 | 16807 | 0 |
| D | 0 | 19216 | 0 |
| Quadrant | Total seconds | Saturated seconds | Saturation percentage |
|---|---|---|---|
| A | 7892 | 188 | 2.382159% |
| B | 7892 | 257 | 3.256462% |
| C | 7892 | 253 | 3.205778% |
| D | 7892 | 313 | 3.966042% |
Noise dominated data is calculated using 1-second bins in cleaned event files. If a bin has >2000 counts, and if more than 50% of those come from <1% of pixels, then it is considered to be noise-dominated and hence unusable.
| Quadrant | # 1 sec bins | Bins with >0 counts | Bins with >2000 counts | High rate bins dominated by noise | Noise dominated (total time) | Noise dominated (detector-on time) | Marked lightcurve |
|---|---|---|---|---|---|---|---|
| A | 8047 | 7895 | 4 | 4 | 0.05% | 0.05% |  |
| B | 8047 | 7895 | 21 | 21 | 0.26% | 0.27% |  |
| C | 8047 | 7895 | 20 | 20 | 0.25% | 0.25% |  |
| D | 8047 | 7895 | 142 | 142 | 1.76% | 1.80% |  |
Top three noisy pixels from each quadrant. If the there are fewer than three noisy pixels in the level2.evt file, extra rows are filled as -1
| Pixel properties | Quadrant properties | ||||||
|---|---|---|---|---|---|---|---|
| Quadrant | DetID | PixID | Counts | Sigma | Mean | Median | Sigma |
| A | 14 | 235 | 19578 | 95.73 | 963 | 941 | 194.7 |
| A | 13 | 254 | 14113 | 67.66 | 963 | 941 | 194.7 |
| A | 15 | 174 | 11075 | 52.05 | 963 | 941 | 194.7 |
| B | 10 | 245 | 95320 | 513.06 | 956 | 930 | 184.0 |
| B | 4 | 52 | 40827 | 216.86 | 956 | 930 | 184.0 |
| B | 3 | 64 | 34650 | 183.29 | 956 | 930 | 184.0 |
| C | 2 | 16 | 165187 | 755.98 | 926 | 930 | 217.3 |
| C | 14 | 238 | 148828 | 680.69 | 926 | 930 | 217.3 |
| C | 14 | 67 | 25694 | 113.97 | 926 | 930 | 217.3 |
| D | 1 | 52 | 1000006 | 4554.18 | 922 | 897 | 219.4 |
| D | 6 | 112 | 122637 | 554.92 | 922 | 897 | 219.4 |
| D | 2 | 250 | 73248 | 329.79 | 922 | 897 | 219.4 |
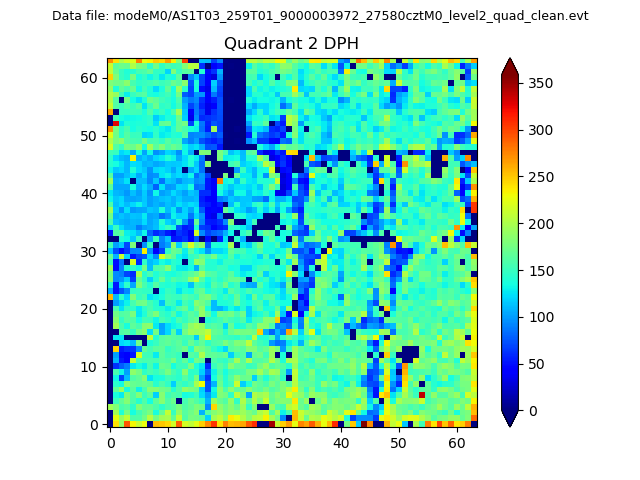
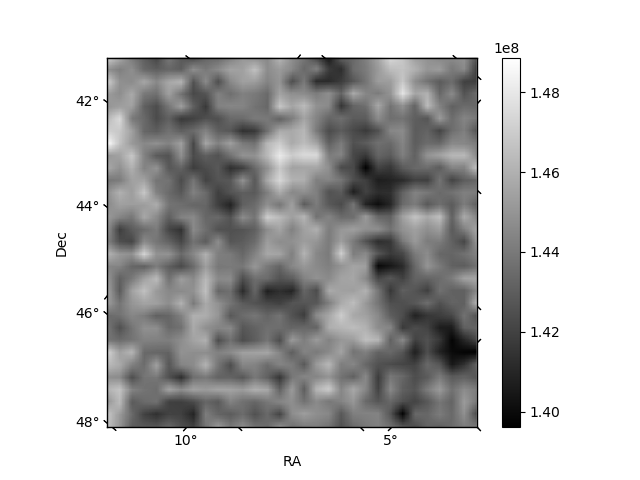
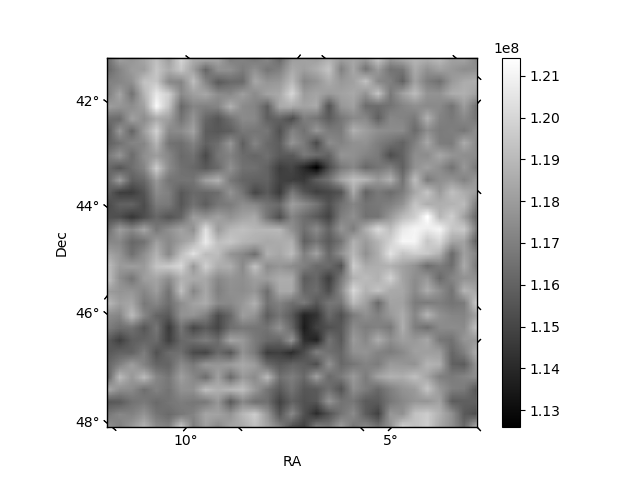
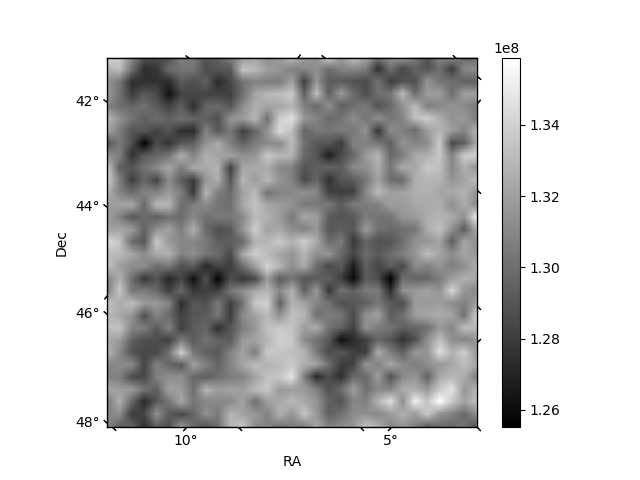
Histogram calculated using DETX and DETY for each event in the final _common_clean file
| Quadrant A | 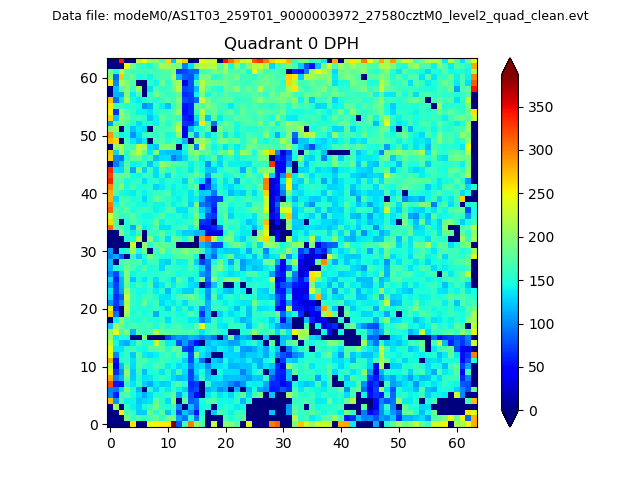 |
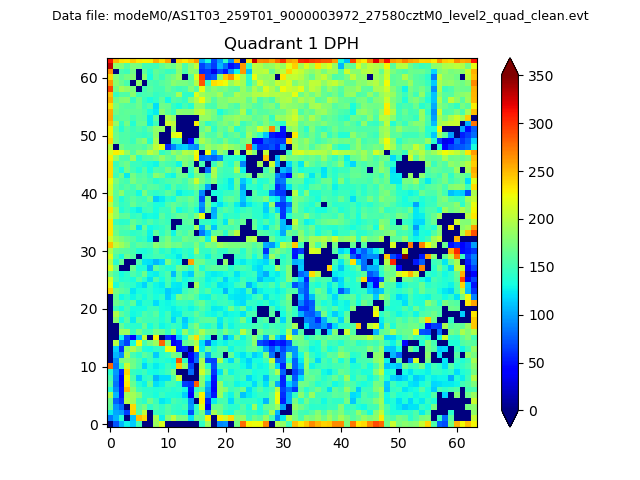 |
Quadrant B |
|---|---|---|---|
| Quadrant D | 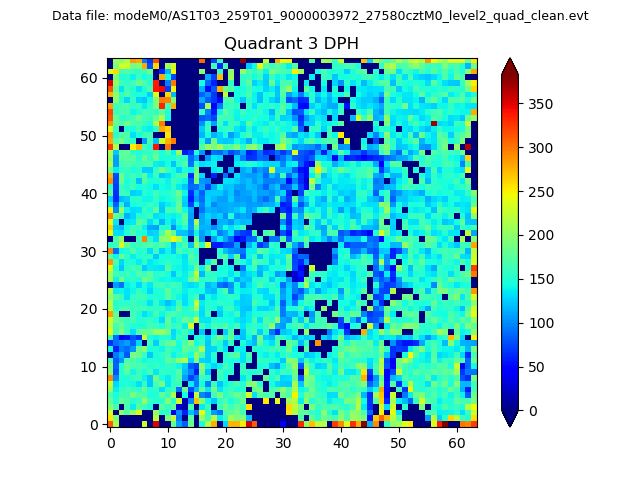 |
 |
Quadrant C |
| Plot type | Count rate plots | Images |
|---|---|---|
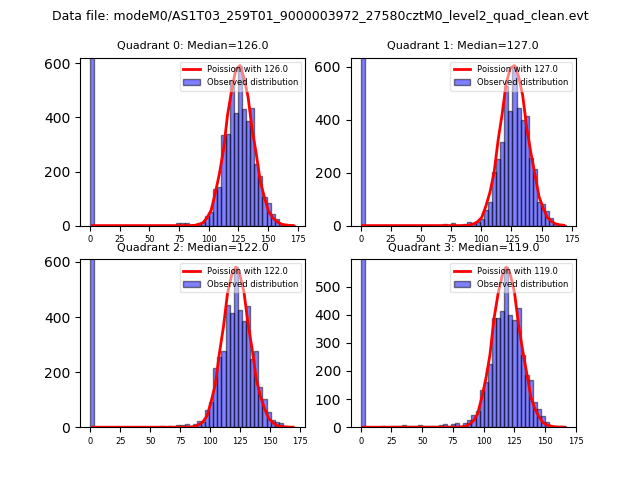
| Comparison with Poisson distribution Blue bars denote a histogram of data divided into 1 sec bins. Red curve is a Poisson curve with rate = median count rate of data. |
 |
 |
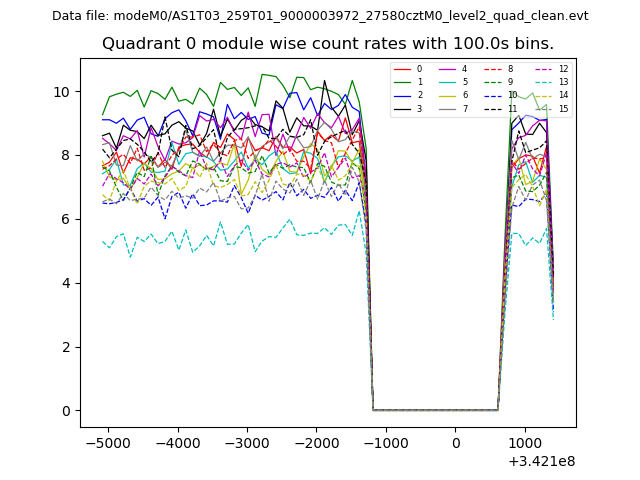
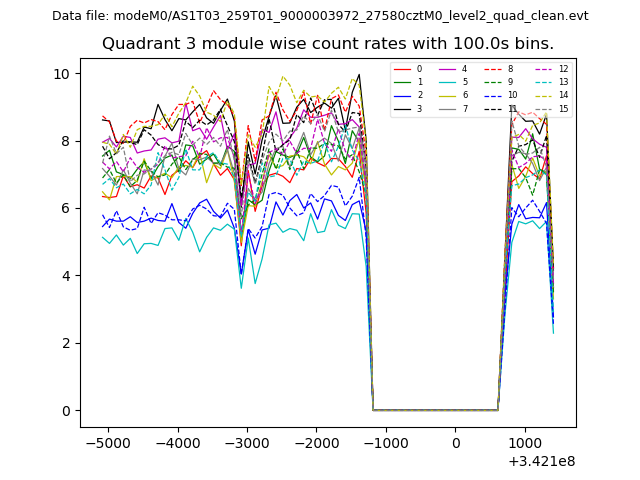
| Quadrant-wise count rates Data is divided into 100 sec bins |
 |
|
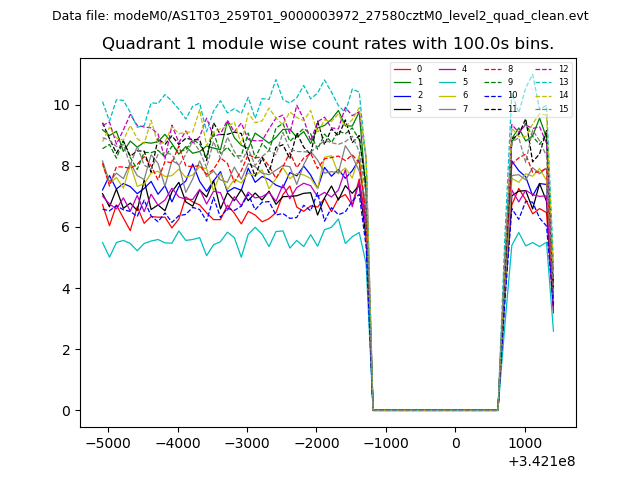
| Module-wise count rates for Quadrant A Data is divided into 100 sec bins |
 |
 |
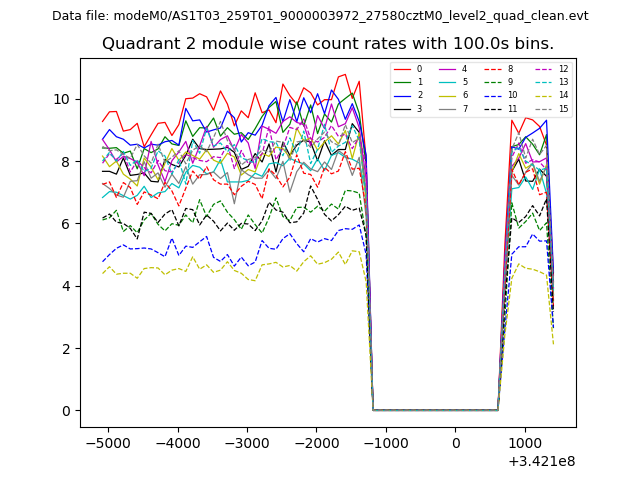
| Module-wise count rates for Quadrant B Data is divided into 100 sec bins |
 |
 |
| Module-wise count rates for Quadrant C Data is divided into 100 sec bins |
 |
 |
| Module-wise count rates for Quadrant D Data is divided into 100 sec bins |
 |
 |
| Parameter | Plot |
|---|---|
| CZT HV Monitor | 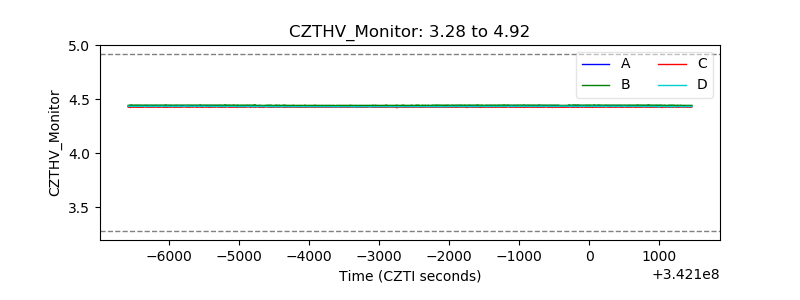 |
| D_VDD | 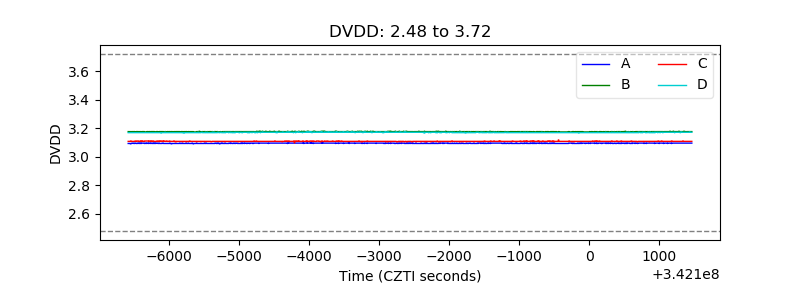 |
| Temperature 1 | 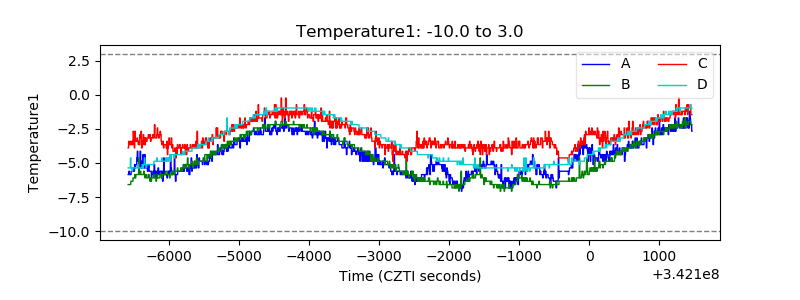 |
| Veto HV Monitor | 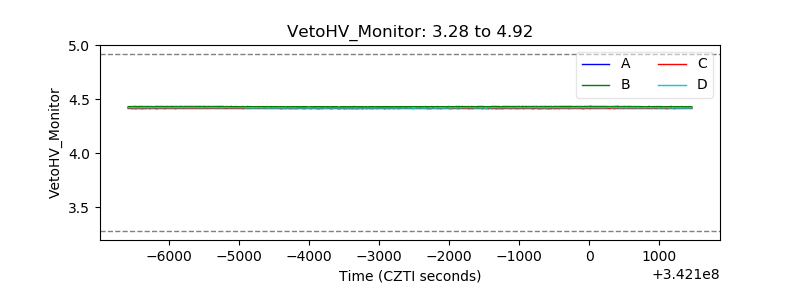 |
| Veto LLD | 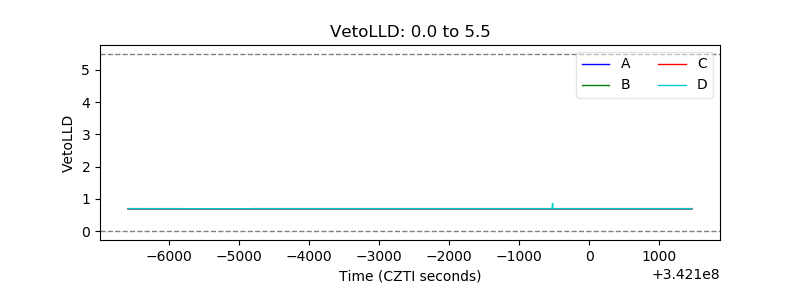 |
| Alpha Counter |  |
| _CPM_Rate | 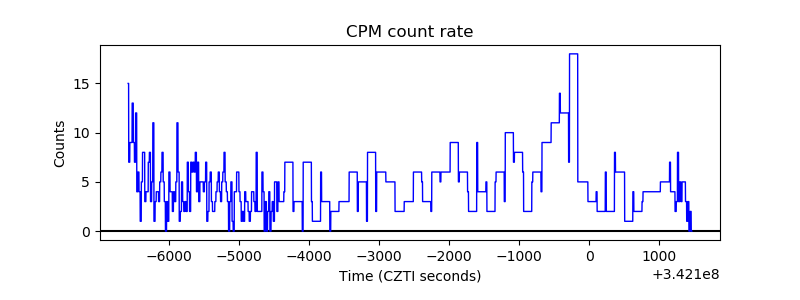 |
| CZT Counter |  |
| +2.5 Volts monitor |  |
| +5 Volts monitor |  |
| _ROLL_ROT | 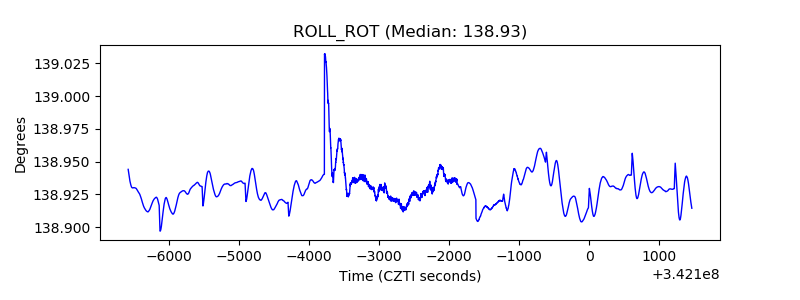 |
| _Roll_DEC | 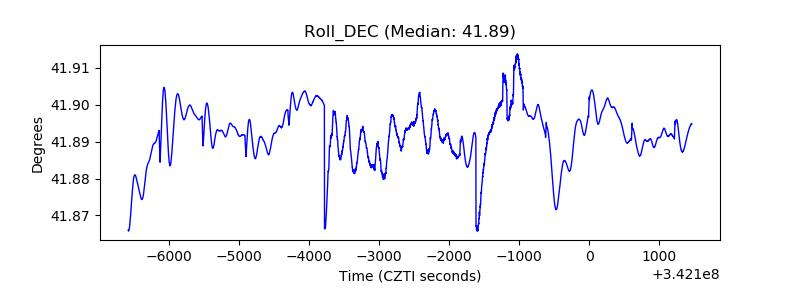 |
| _Roll_RA | 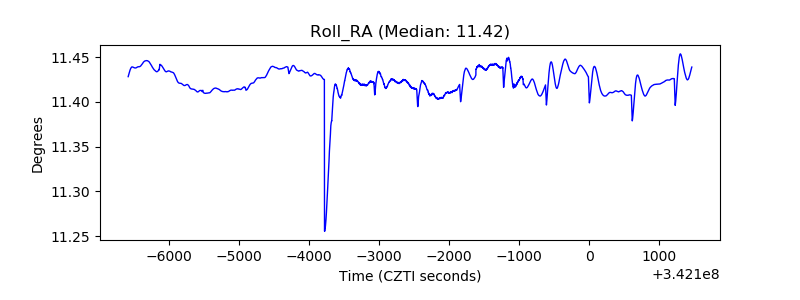 |
| Veto Counter | 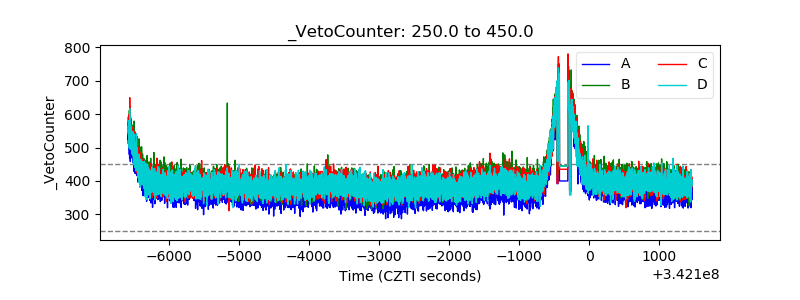 |