| Param | Original file | Final file |
|---|---|---|
| Filename | modeM0/AS1T03_259T01_9000003972_27583cztM0_level2.evt | modeM0/AS1T03_259T01_9000003972_27583cztM0_level2_quad_clean.evt |
| Size (bytes) | 182,926,080 | 33,212,160 |
| Size | 174.5 MB | 31.7 MB |
| Events in quadrant A | 1,298,915 | 207,384 |
| Events in quadrant B | 1,374,552 | 210,730 |
| Events in quadrant C | 1,297,850 | 198,929 |
| Events in quadrant D | 1,383,229 | 195,403 |
| Mode M0 | |||
|---|---|---|---|
| Quadrant | BADHDUFLAG | Total packets | Discarded packets |
| A | 0 | 5544 | 0 |
| B | 0 | 5756 | 0 |
| C | 0 | 5556 | 0 |
| D | 0 | 5806 | 0 |
| Quadrant | Total seconds | Saturated seconds | Saturation percentage |
|---|---|---|---|
| A | 2691 | 40 | 1.486436% |
| B | 2692 | 46 | 1.708767% |
| C | 2692 | 49 | 1.820208% |
| D | 2692 | 15 | 0.557207% |
Noise dominated data is calculated using 1-second bins in cleaned event files. If a bin has >2000 counts, and if more than 50% of those come from <1% of pixels, then it is considered to be noise-dominated and hence unusable.
| Quadrant | # 1 sec bins | Bins with >0 counts | Bins with >2000 counts | High rate bins dominated by noise | Noise dominated (total time) | Noise dominated (detector-on time) | Marked lightcurve |
|---|---|---|---|---|---|---|---|
| A | 2691 | 2691 | 0 | 0 | 0.00% | 0.00% | 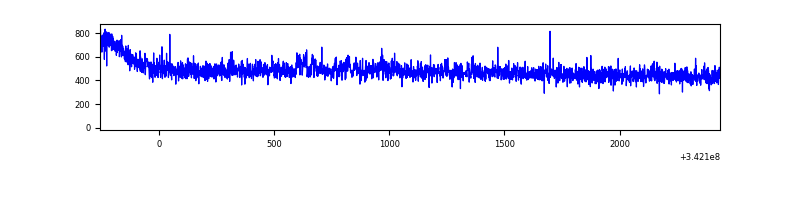 |
| B | 2692 | 2692 | 2 | 2 | 0.07% | 0.07% | 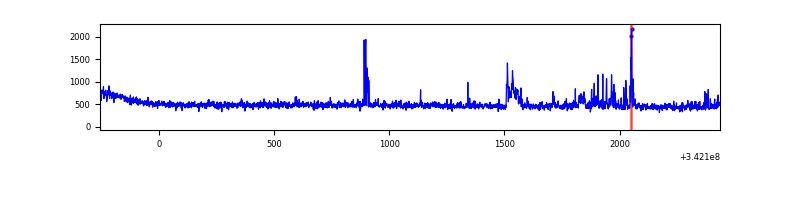 |
| C | 2692 | 2692 | 0 | 0 | 0.00% | 0.00% | 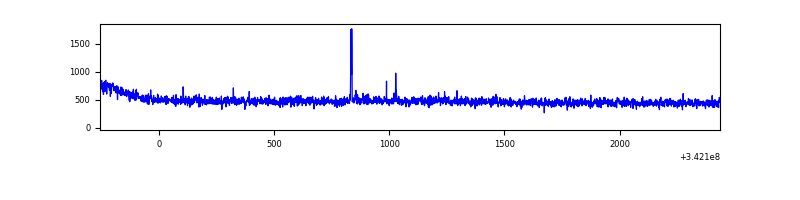 |
| D | 2692 | 2692 | 3 | 3 | 0.11% | 0.11% | 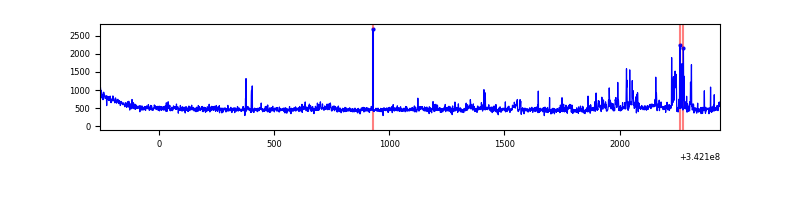 |
Top three noisy pixels from each quadrant. If the there are fewer than three noisy pixels in the level2.evt file, extra rows are filled as -1
| Pixel properties | Quadrant properties | ||||||
|---|---|---|---|---|---|---|---|
| Quadrant | DetID | PixID | Counts | Sigma | Mean | Median | Sigma |
| A | 15 | 174 | 10214 | 142.99 | 334 | 326 | 69.2 |
| A | 13 | 254 | 4854 | 65.48 | 334 | 326 | 69.2 |
| A | 3 | 137 | 3297 | 42.96 | 334 | 326 | 69.2 |
| B | 15 | 32 | 56061 | 855.09 | 327 | 319 | 65.2 |
| B | 4 | 52 | 18648 | 281.17 | 327 | 319 | 65.2 |
| B | 12 | 111 | 8018 | 118.1 | 327 | 319 | 65.2 |
| C | 14 | 238 | 50509 | 667.53 | 316 | 316 | 75.2 |
| C | 2 | 16 | 10662 | 137.59 | 316 | 316 | 75.2 |
| C | 3 | 233 | 2919 | 34.62 | 316 | 316 | 75.2 |
| D | 1 | 52 | 140331 | 1819.6 | 320 | 309 | 77.0 |
| D | 2 | 250 | 17837 | 227.78 | 320 | 309 | 77.0 |
| D | 2 | 234 | 10715 | 135.23 | 320 | 309 | 77.0 |
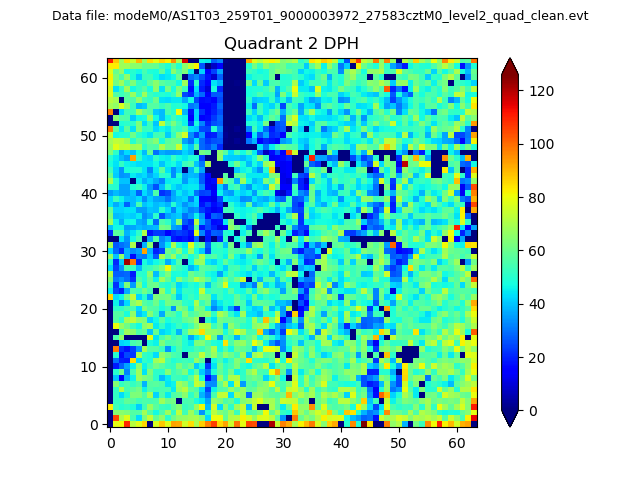
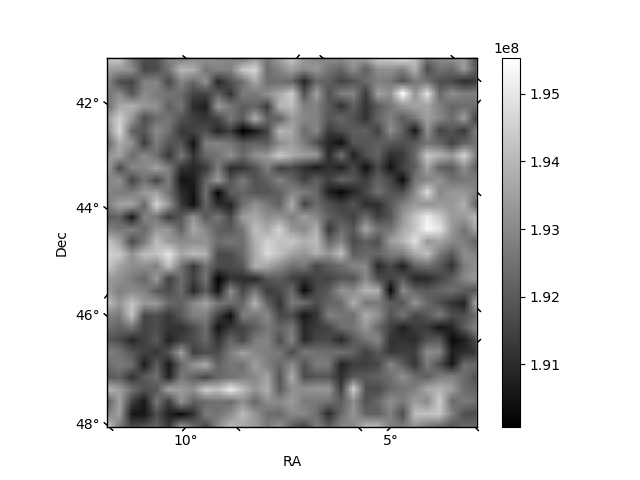
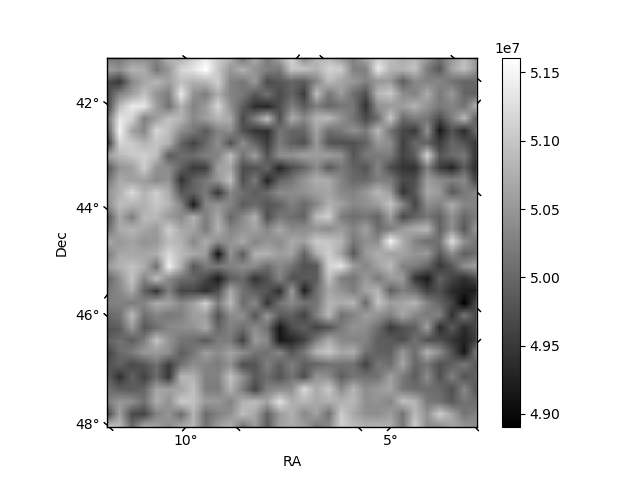
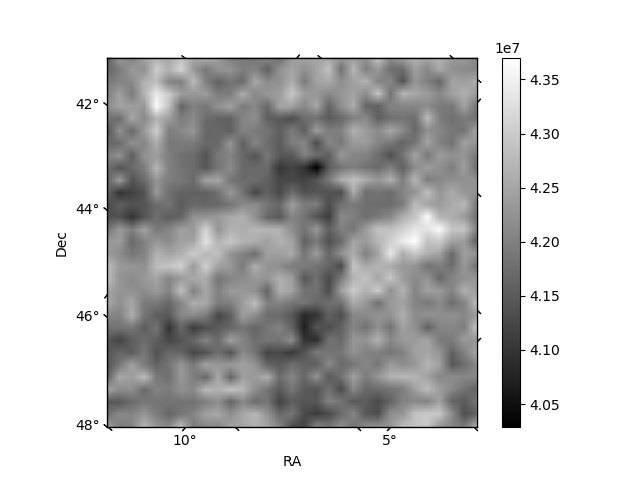
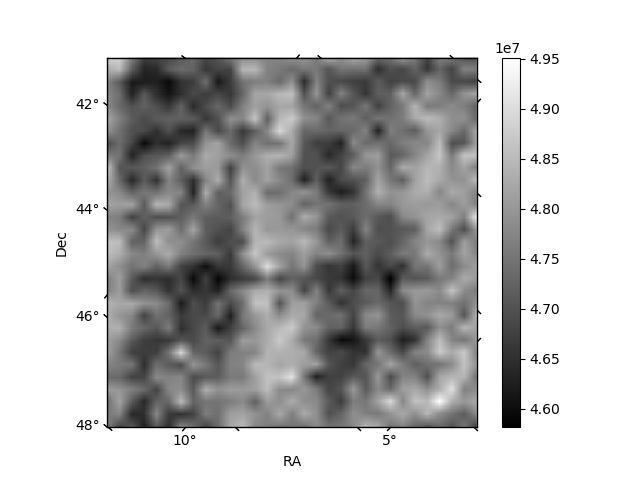
Histogram calculated using DETX and DETY for each event in the final _common_clean file
| Quadrant A | 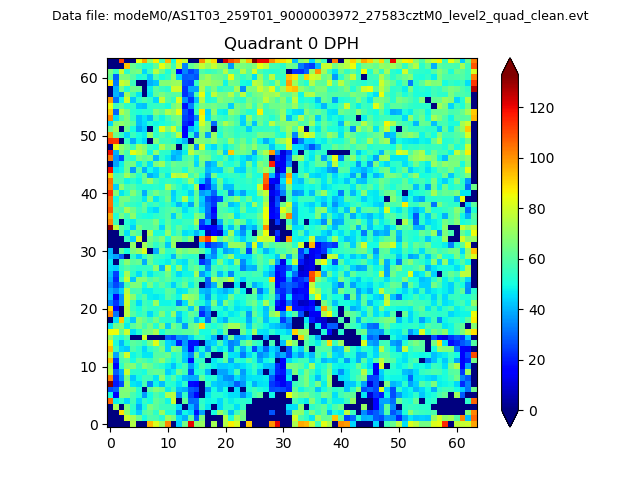 |
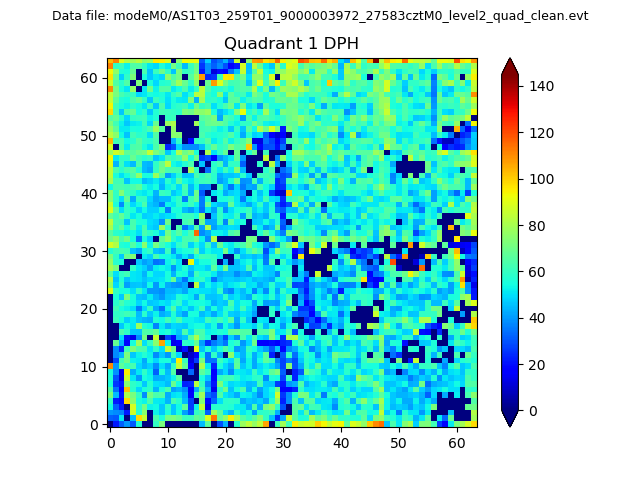 |
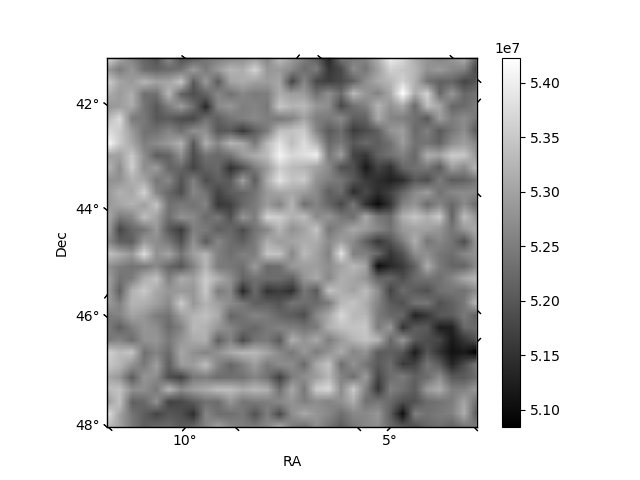
Quadrant B |
|---|---|---|---|
| Quadrant D | 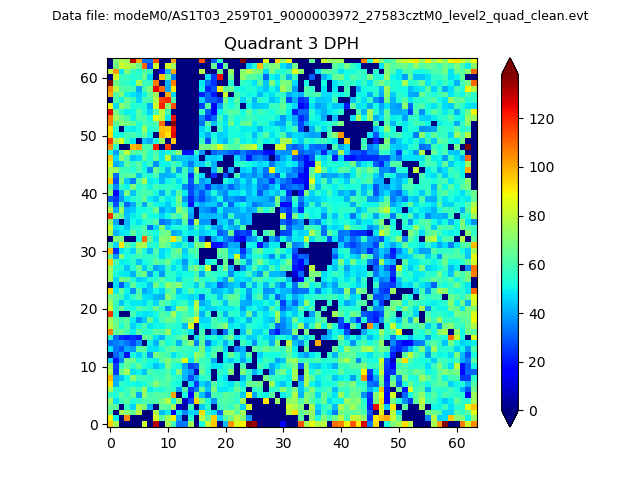 |
 |
Quadrant C |
| Plot type | Count rate plots | Images |
|---|---|---|
| Comparison with Poisson distribution Blue bars denote a histogram of data divided into 1 sec bins. Red curve is a Poisson curve with rate = median count rate of data. |
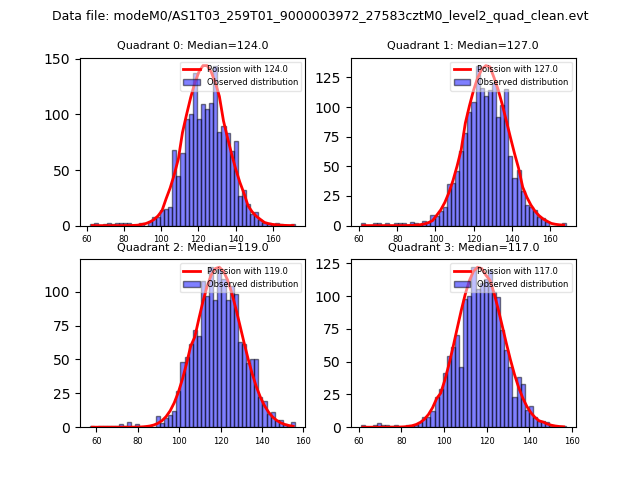 |
 |
| Quadrant-wise count rates Data is divided into 100 sec bins |
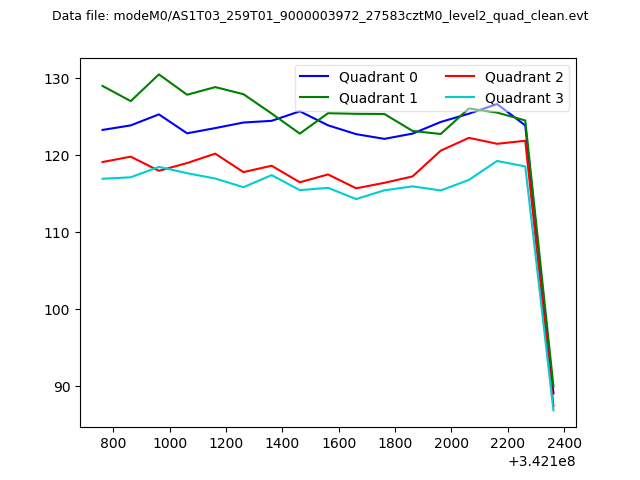 |
|
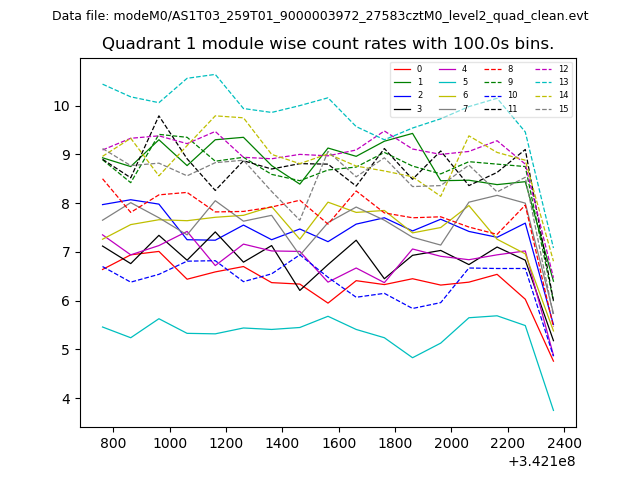
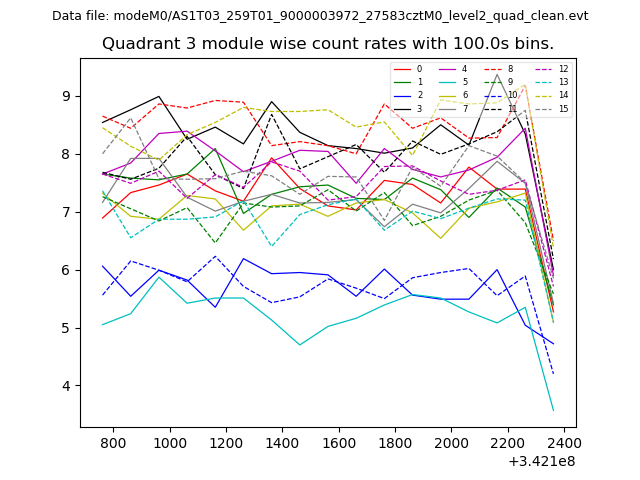
| Module-wise count rates for Quadrant A Data is divided into 100 sec bins |
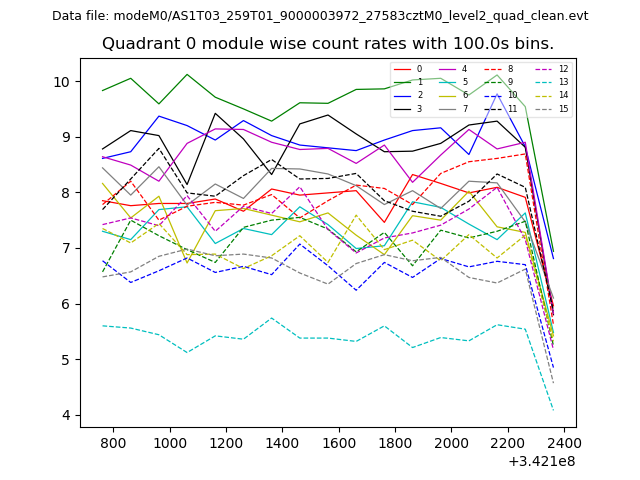 |
 |
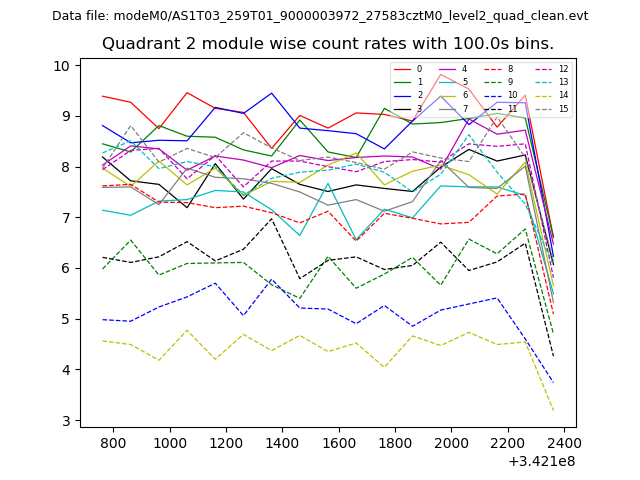
| Module-wise count rates for Quadrant B Data is divided into 100 sec bins |
 |
 |
| Module-wise count rates for Quadrant C Data is divided into 100 sec bins |
 |
 |
| Module-wise count rates for Quadrant D Data is divided into 100 sec bins |
 |
 |
| Parameter | Plot |
|---|---|
| CZT HV Monitor | 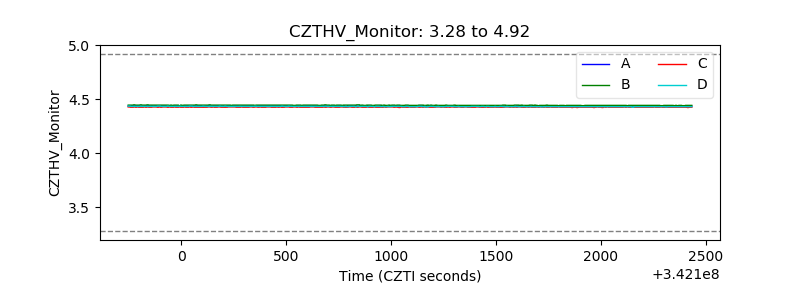 |
| D_VDD | 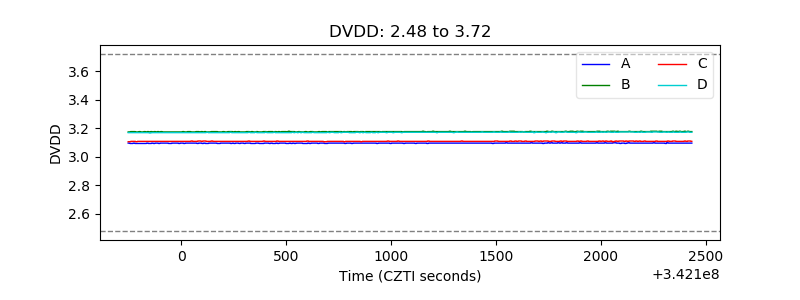 |
| Temperature 1 | 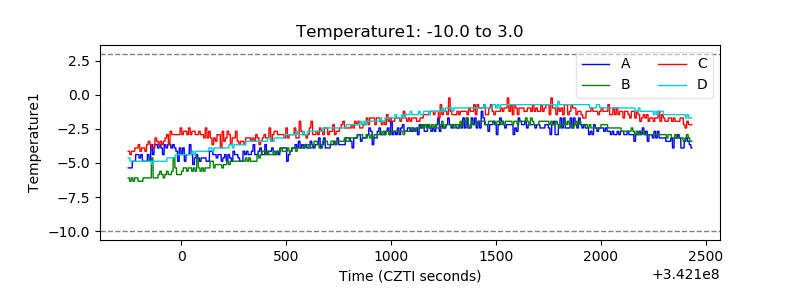 |
| Veto HV Monitor |  |
| Veto LLD | 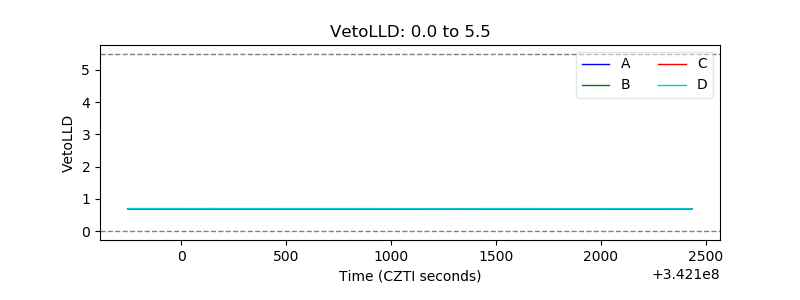 |
| Alpha Counter | 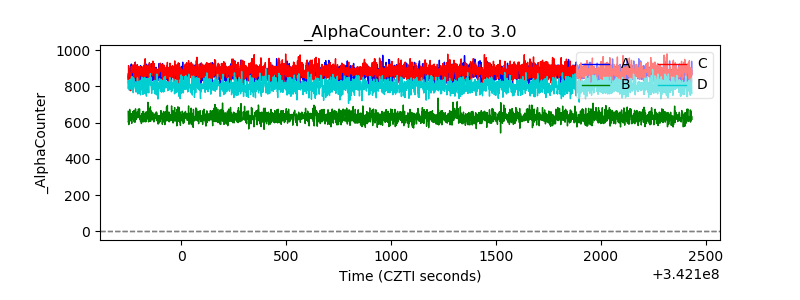 |
| _CPM_Rate | 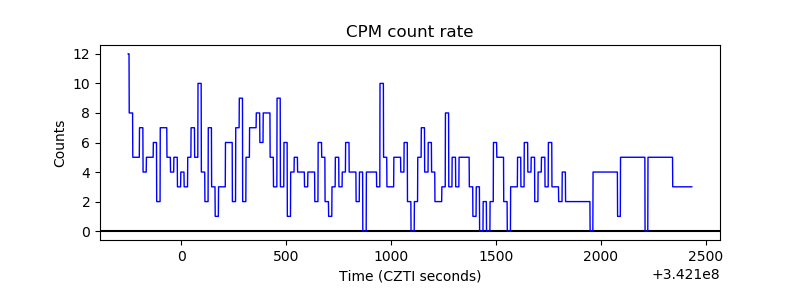 |
| CZT Counter |  |
| +2.5 Volts monitor |  |
| +5 Volts monitor |  |
| _ROLL_ROT | 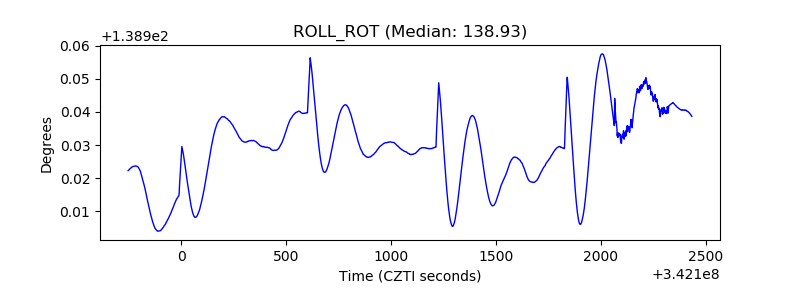 |
| _Roll_DEC | 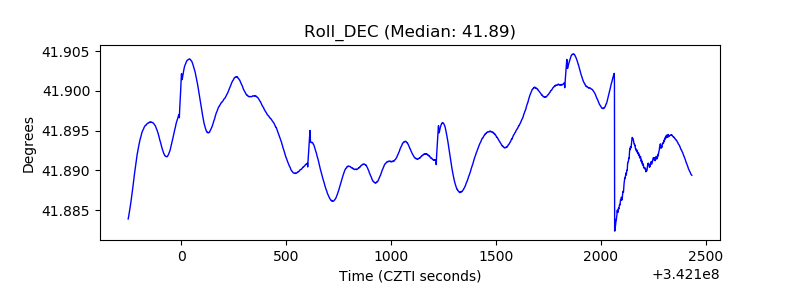 |
| _Roll_RA | 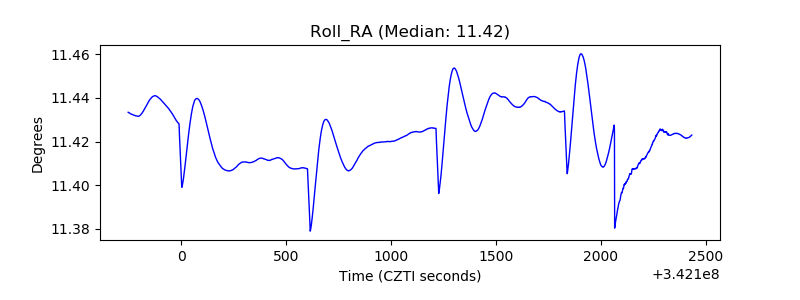 |
| Veto Counter | 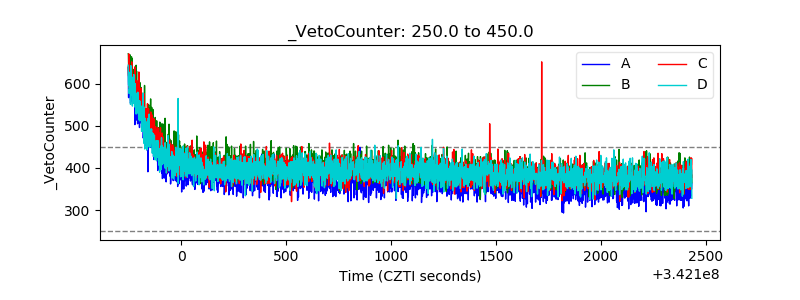 |