| Param | Original file | Final file |
|---|---|---|
| Filename | modeM0/AS1T03_257T01_9000003976_27592cztM0_level2.evt | modeM0/AS1T03_257T01_9000003976_27592cztM0_level2_quad_clean.evt |
| Size (bytes) | 637,842,240 | 104,261,760 |
| Size | 608.3 MB | 99.4 MB |
| Events in quadrant A | 4,159,151 | 658,358 |
| Events in quadrant B | 4,364,894 | 667,099 |
| Events in quadrant C | 4,449,684 | 635,025 |
| Events in quadrant D | 5,772,932 | 611,958 |
| Mode M9 | |||
|---|---|---|---|
| Quadrant | BADHDUFLAG | Total packets | Discarded packets |
| A | 0 | 18 | 0 |
| B | 0 | 18 | 0 |
| C | 0 | 18 | 0 |
| D | 0 | 18 | 0 |
| Mode M0 | |||
|---|---|---|---|
| Quadrant | BADHDUFLAG | Total packets | Discarded packets |
| A | 0 | 17557 | 0 |
| B | 0 | 18059 | 0 |
| C | 0 | 18396 | 0 |
| D | 0 | 22830 | 0 |
| Quadrant | Total seconds | Saturated seconds | Saturation percentage |
|---|---|---|---|
| A | 8420 | 148 | 1.757720% |
| B | 8420 | 219 | 2.600950% |
| C | 8420 | 261 | 3.099762% |
| D | 8420 | 222 | 2.636580% |
Noise dominated data is calculated using 1-second bins in cleaned event files. If a bin has >2000 counts, and if more than 50% of those come from <1% of pixels, then it is considered to be noise-dominated and hence unusable.
| Quadrant | # 1 sec bins | Bins with >0 counts | Bins with >2000 counts | High rate bins dominated by noise | Noise dominated (total time) | Noise dominated (detector-on time) | Marked lightcurve |
|---|---|---|---|---|---|---|---|
| A | 10215 | 8422 | 0 | 0 | 0.00% | 0.00% | 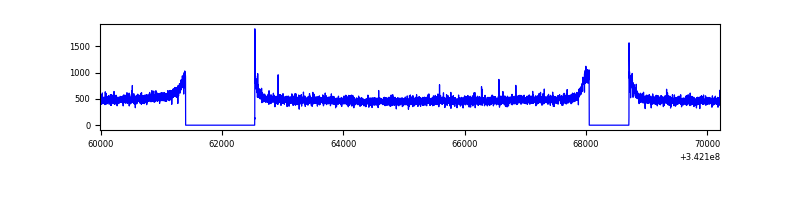 |
| B | 10215 | 8422 | 11 | 11 | 0.11% | 0.13% | 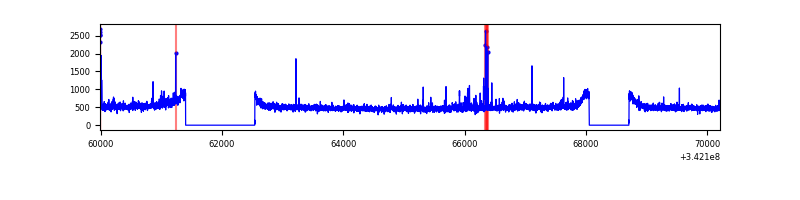 |
| C | 10215 | 8422 | 45 | 45 | 0.44% | 0.53% | 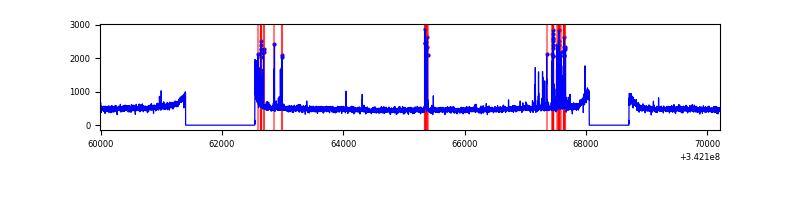 |
| D | 10215 | 8422 | 93 | 93 | 0.91% | 1.10% | 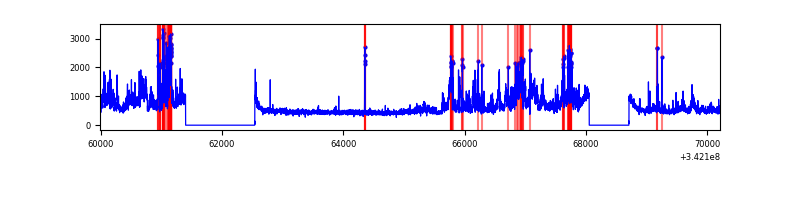 |
Top three noisy pixels from each quadrant. If the there are fewer than three noisy pixels in the level2.evt file, extra rows are filled as -1
| Pixel properties | Quadrant properties | ||||||
|---|---|---|---|---|---|---|---|
| Quadrant | DetID | PixID | Counts | Sigma | Mean | Median | Sigma |
| A | 13 | 254 | 13078 | 55.64 | 1076 | 1052 | 216.1 |
| A | 8 | 192 | 10875 | 45.45 | 1076 | 1052 | 216.1 |
| A | 3 | 137 | 10422 | 43.35 | 1076 | 1052 | 216.1 |
| B | 15 | 32 | 53361 | 253.41 | 1069 | 1040 | 206.5 |
| B | 0 | 230 | 49782 | 236.08 | 1069 | 1040 | 206.5 |
| B | 0 | 245 | 32836 | 154.0 | 1069 | 1040 | 206.5 |
| C | 2 | 16 | 268742 | 1106.31 | 1028 | 1032 | 242.0 |
| C | 14 | 238 | 162468 | 667.13 | 1028 | 1032 | 242.0 |
| C | 13 | 61 | 6974 | 24.56 | 1028 | 1032 | 242.0 |
| D | 1 | 52 | 1546696 | 6264.53 | 1033 | 1004 | 246.7 |
| D | 2 | 250 | 122233 | 491.33 | 1033 | 1004 | 246.7 |
| D | 12 | 227 | 87593 | 350.94 | 1033 | 1004 | 246.7 |
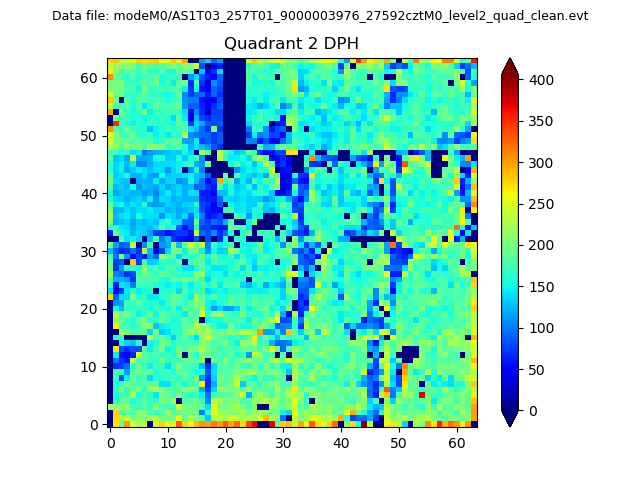
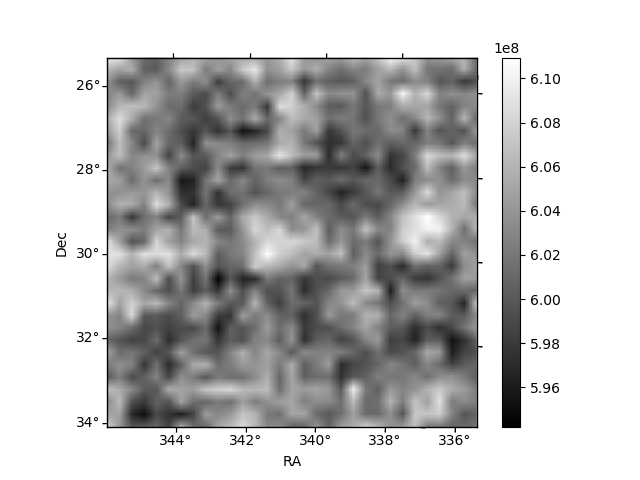
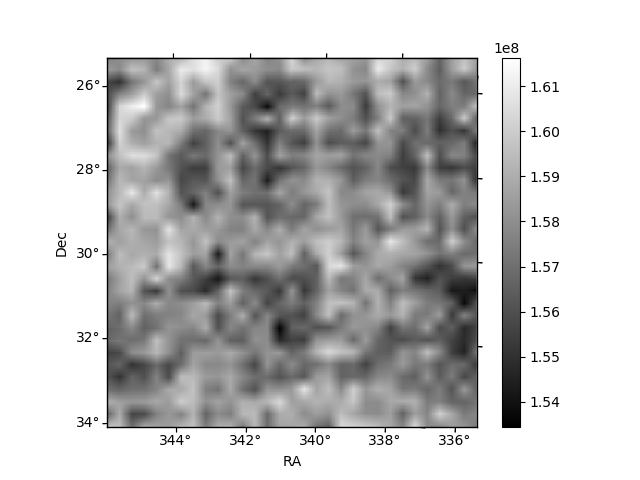
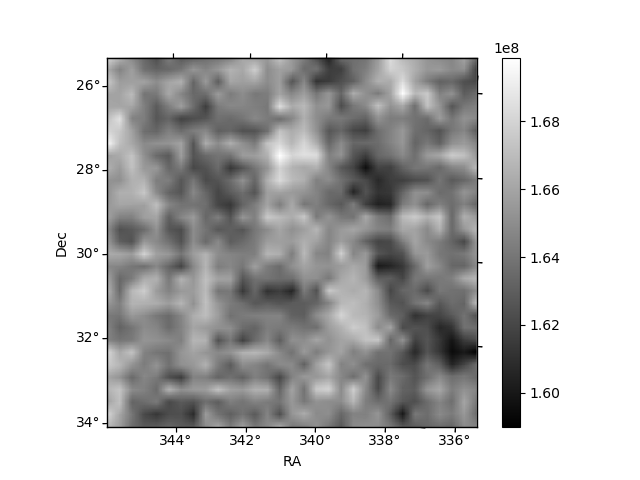
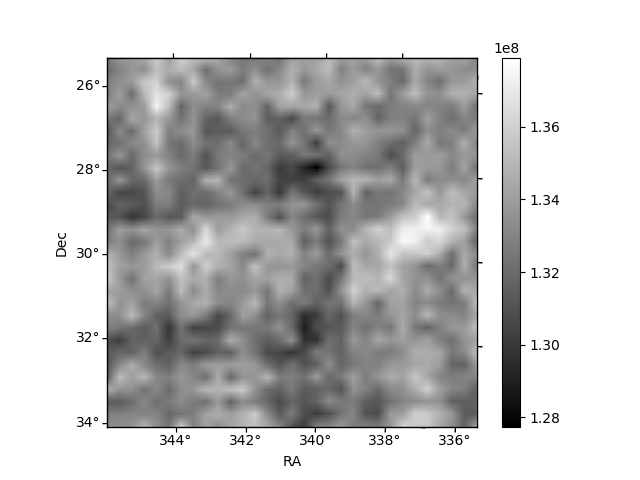
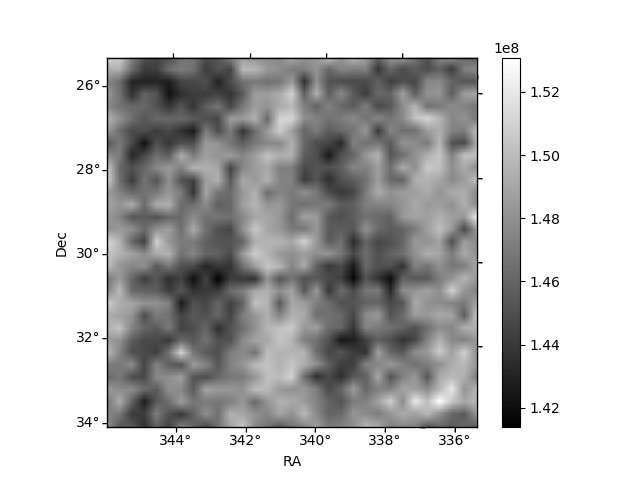
Histogram calculated using DETX and DETY for each event in the final _common_clean file
| Quadrant A | 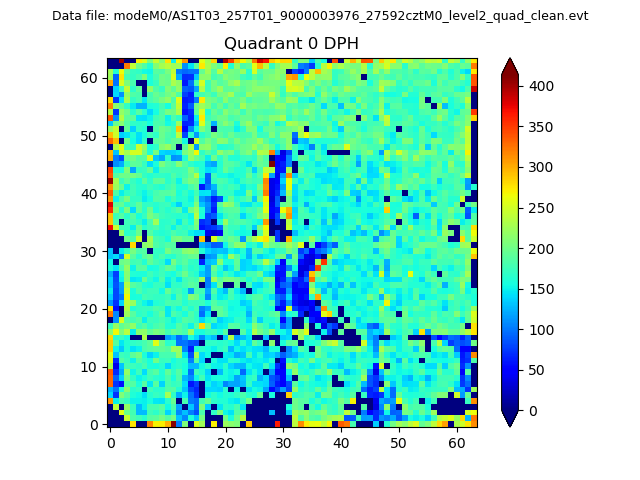 |
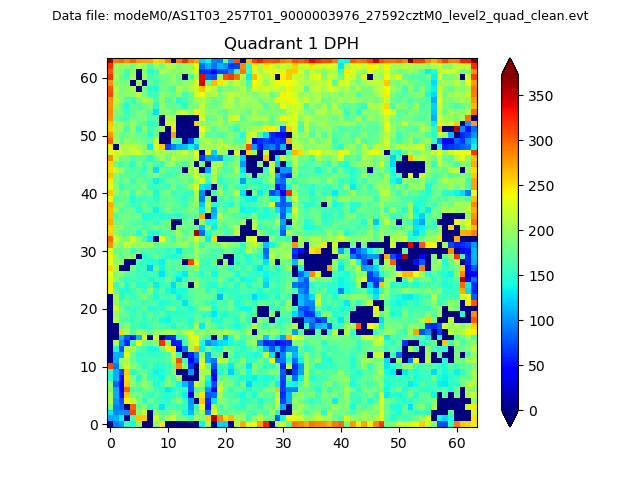 |
Quadrant B |
|---|---|---|---|
| Quadrant D | 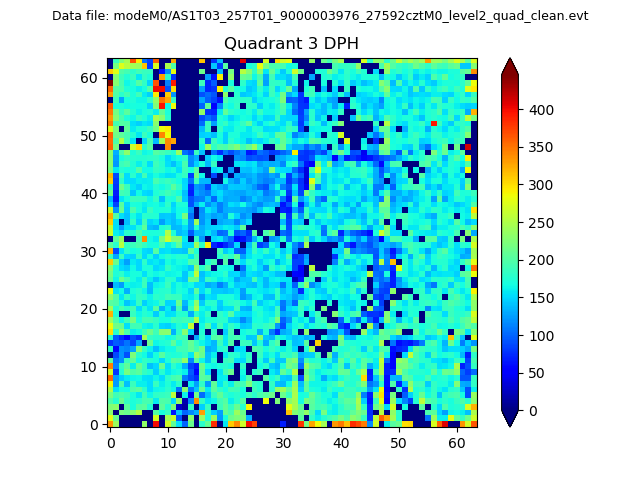 |
 |
Quadrant C |
| Plot type | Count rate plots | Images |
|---|---|---|
| Comparison with Poisson distribution Blue bars denote a histogram of data divided into 1 sec bins. Red curve is a Poisson curve with rate = median count rate of data. |
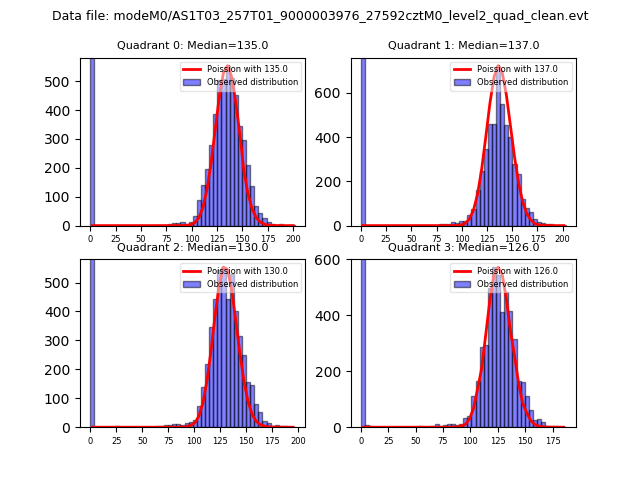 |
 |
| Quadrant-wise count rates Data is divided into 100 sec bins |
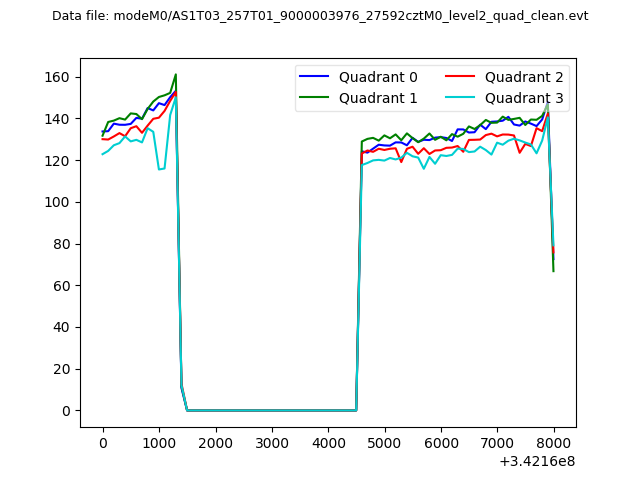 |
|
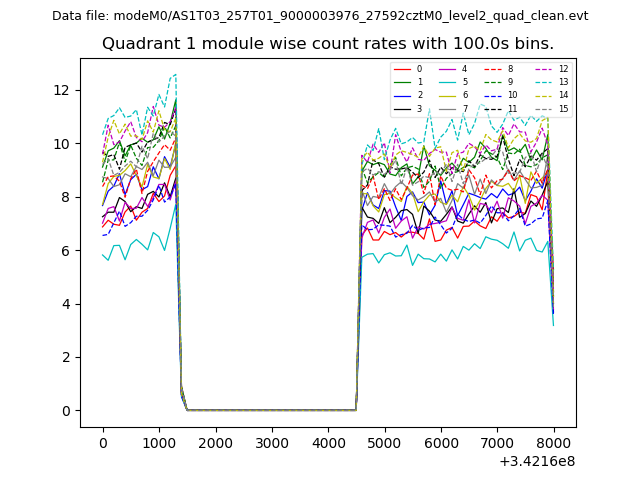
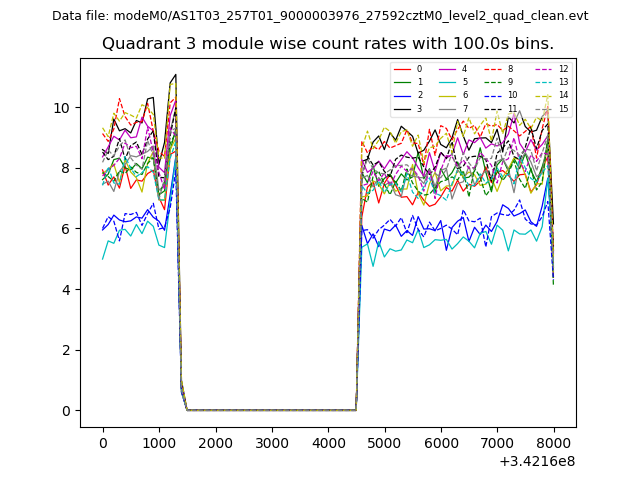
| Module-wise count rates for Quadrant A Data is divided into 100 sec bins |
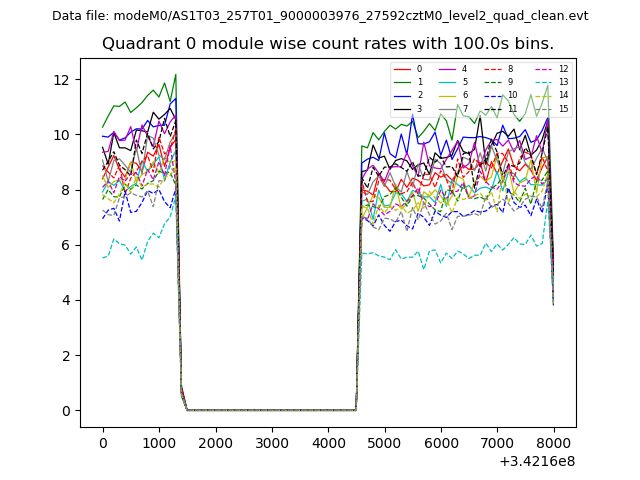 |
 |
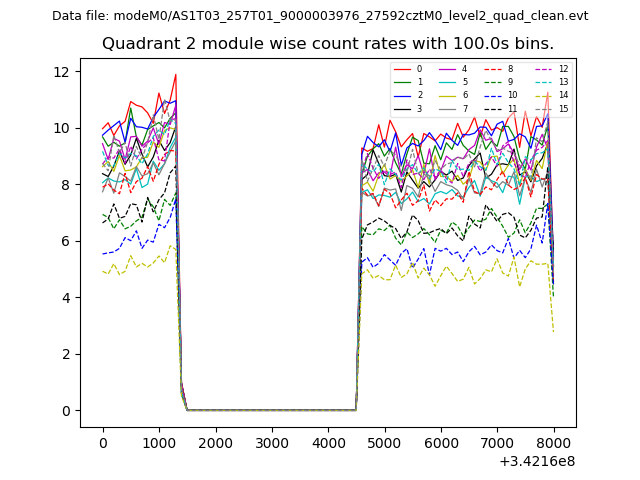
| Module-wise count rates for Quadrant B Data is divided into 100 sec bins |
 |
 |
| Module-wise count rates for Quadrant C Data is divided into 100 sec bins |
 |
 |
| Module-wise count rates for Quadrant D Data is divided into 100 sec bins |
 |
 |
| Parameter | Plot |
|---|---|
| CZT HV Monitor | 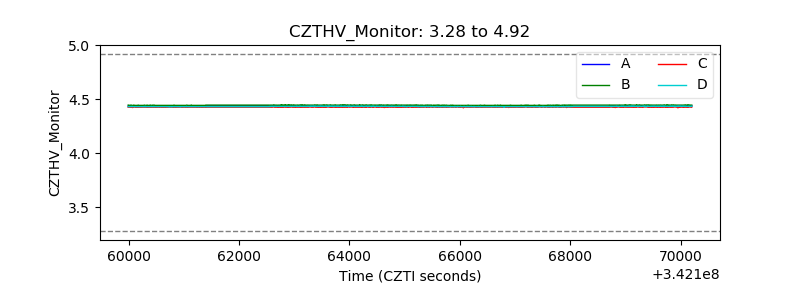 |
| D_VDD | 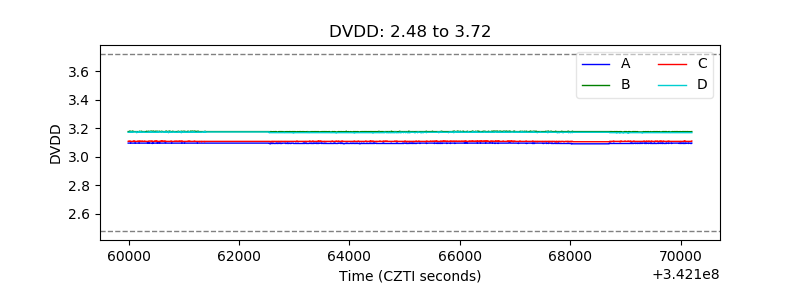 |
| Temperature 1 | 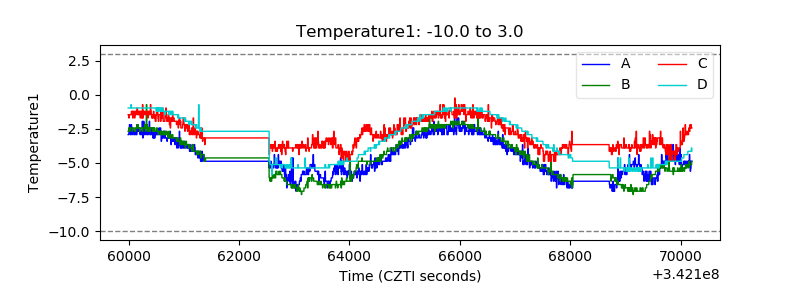 |
| Veto HV Monitor |  |
| Veto LLD | 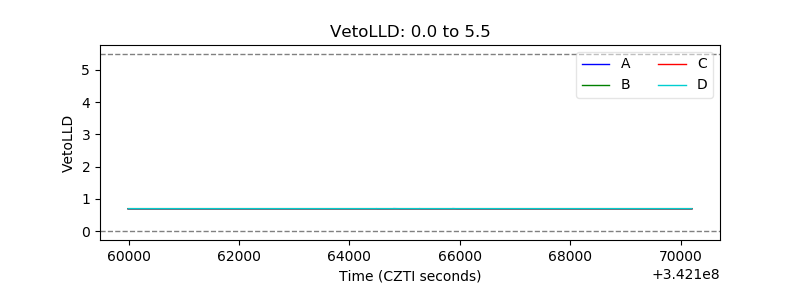 |
| Alpha Counter | 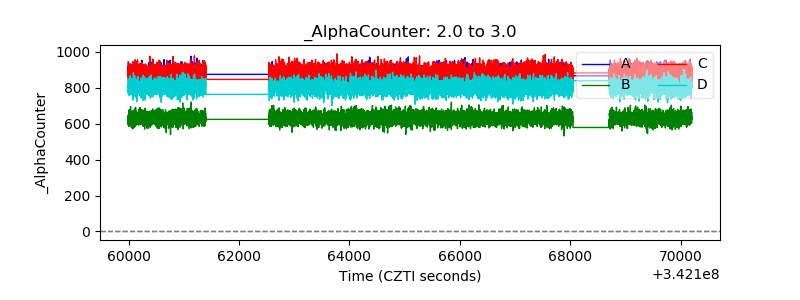 |
| _CPM_Rate | 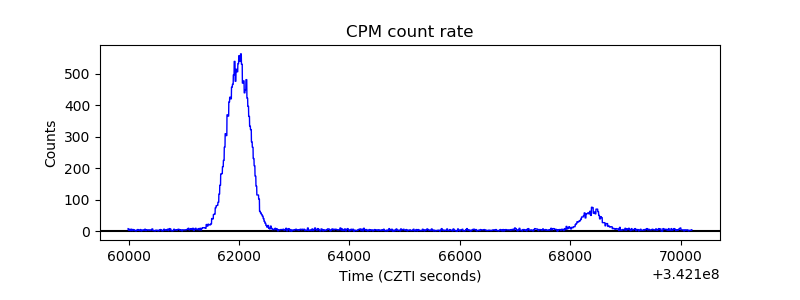 |
| CZT Counter | 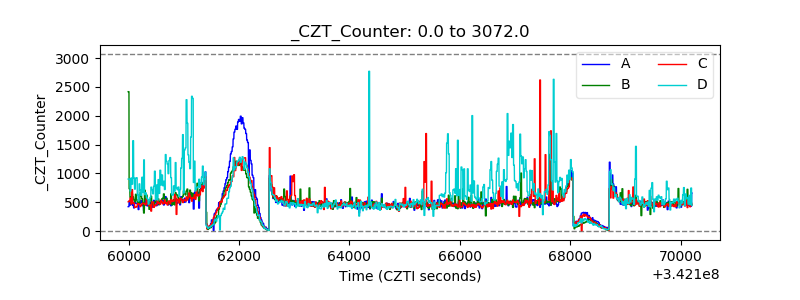 |
| +2.5 Volts monitor | 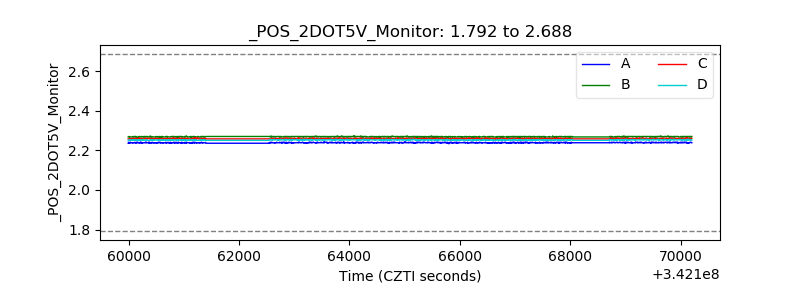 |
| +5 Volts monitor | 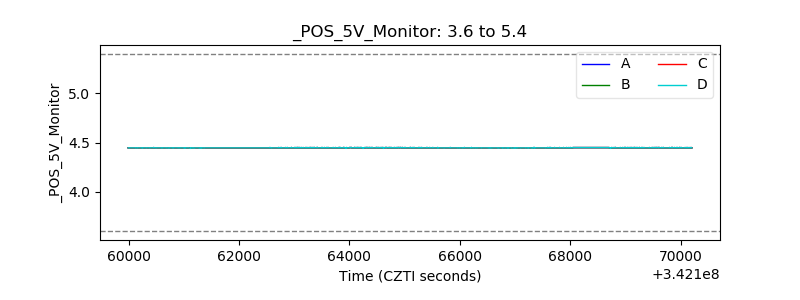 |
| _ROLL_ROT | 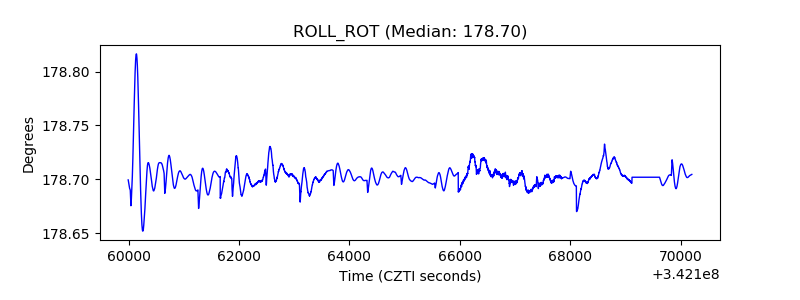 |
| _Roll_DEC | 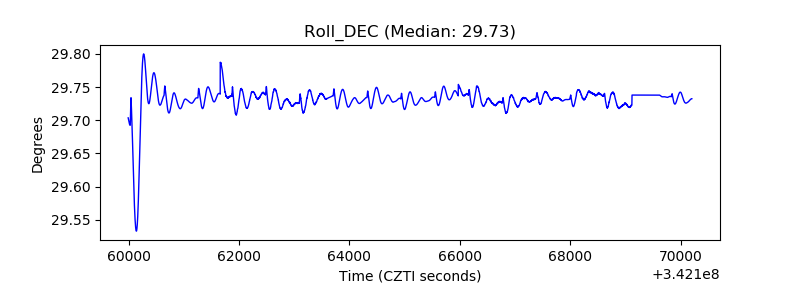 |
| _Roll_RA | 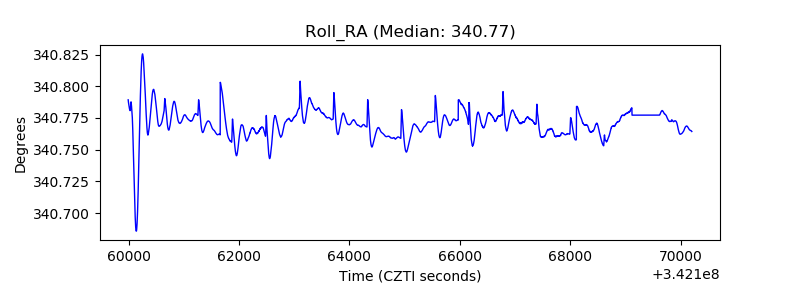 |
| Veto Counter | 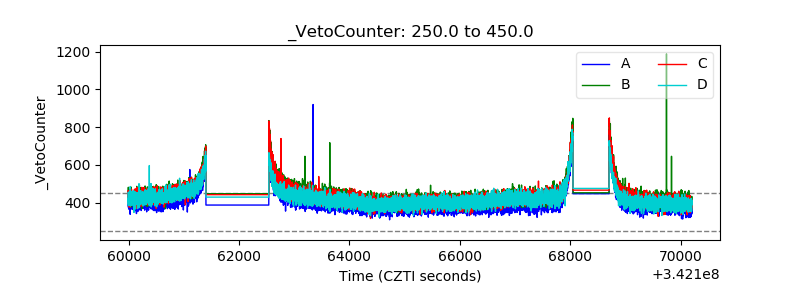 |