| Param | Original file | Final file |
|---|---|---|
| Filename | modeM0/AS1T03_257T01_9000003976_27593cztM0_level2.evt | modeM0/AS1T03_257T01_9000003976_27593cztM0_level2_quad_clean.evt |
| Size (bytes) | 668,946,240 | 91,316,160 |
| Size | 638.0 MB | 87.1 MB |
| Events in quadrant A | 3,931,823 | 565,291 |
| Events in quadrant B | 4,556,191 | 568,404 |
| Events in quadrant C | 4,111,700 | 547,128 |
| Events in quadrant D | 7,112,633 | 523,157 |
| Mode M9 | |||
|---|---|---|---|
| Quadrant | BADHDUFLAG | Total packets | Discarded packets |
| A | 0 | 9 | 0 |
| B | 0 | 9 | 0 |
| C | 0 | 9 | 0 |
| D | 0 | 9 | 0 |
| Mode M0 | |||
|---|---|---|---|
| Quadrant | BADHDUFLAG | Total packets | Discarded packets |
| A | 0 | 16886 | 0 |
| B | 0 | 18690 | 0 |
| C | 0 | 17323 | 0 |
| D | 0 | 26602 | 0 |
| Quadrant | Total seconds | Saturated seconds | Saturation percentage |
|---|---|---|---|
| A | 8080 | 267 | 3.304455% |
| B | 8080 | 387 | 4.789604% |
| C | 8080 | 350 | 4.331683% |
| D | 8081 | 569 | 7.041208% |
Noise dominated data is calculated using 1-second bins in cleaned event files. If a bin has >2000 counts, and if more than 50% of those come from <1% of pixels, then it is considered to be noise-dominated and hence unusable.
| Quadrant | # 1 sec bins | Bins with >0 counts | Bins with >2000 counts | High rate bins dominated by noise | Noise dominated (total time) | Noise dominated (detector-on time) | Marked lightcurve |
|---|---|---|---|---|---|---|---|
| A | 8905 | 8083 | 0 | 0 | 0.00% | 0.00% | 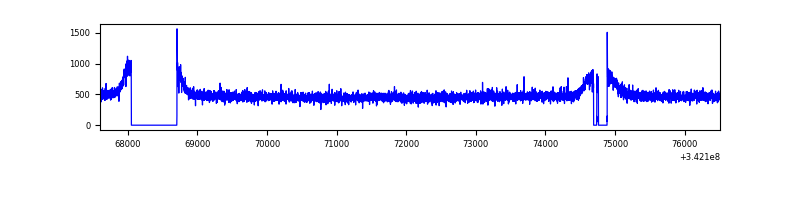 |
| B | 8905 | 8083 | 27 | 27 | 0.30% | 0.33% | 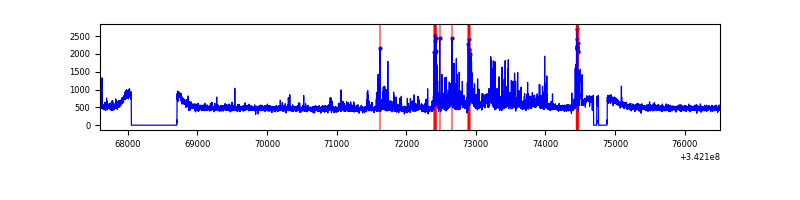 |
| C | 8905 | 8083 | 17 | 17 | 0.19% | 0.21% | 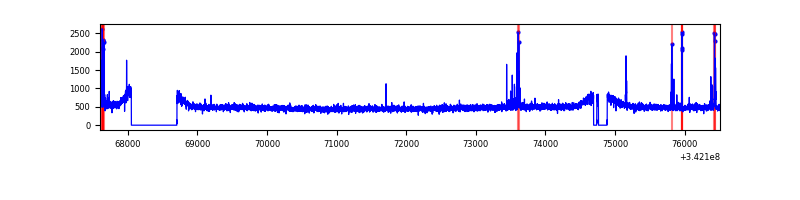 |
| D | 8906 | 8084 | 290 | 290 | 3.26% | 3.59% | 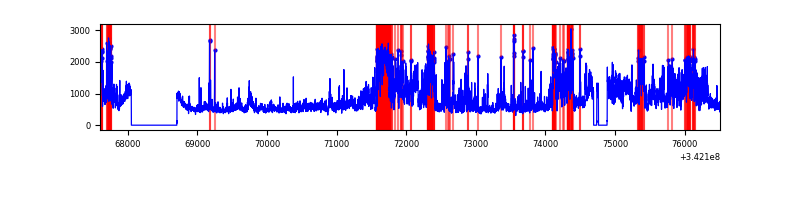 |
Top three noisy pixels from each quadrant. If the there are fewer than three noisy pixels in the level2.evt file, extra rows are filled as -1
| Pixel properties | Quadrant properties | ||||||
|---|---|---|---|---|---|---|---|
| Quadrant | DetID | PixID | Counts | Sigma | Mean | Median | Sigma |
| A | 13 | 254 | 13033 | 58.25 | 1017 | 992 | 206.7 |
| A | 3 | 137 | 10350 | 45.27 | 1017 | 992 | 206.7 |
| A | 0 | 226 | 8616 | 36.88 | 1017 | 992 | 206.7 |
| B | 3 | 64 | 422430 | 2136.91 | 1012 | 984 | 197.2 |
| B | 10 | 245 | 84438 | 423.15 | 1012 | 984 | 197.2 |
| B | 0 | 230 | 38462 | 190.03 | 1012 | 984 | 197.2 |
| C | 14 | 238 | 155185 | 658.18 | 980 | 985 | 234.3 |
| C | 2 | 16 | 127101 | 538.3 | 980 | 985 | 234.3 |
| C | 13 | 61 | 6692 | 24.36 | 980 | 985 | 234.3 |
| D | 1 | 52 | 2944035 | 12546.27 | 975 | 947 | 234.6 |
| D | 6 | 112 | 250477 | 1063.74 | 975 | 947 | 234.6 |
| D | 2 | 250 | 119016 | 503.32 | 975 | 947 | 234.6 |
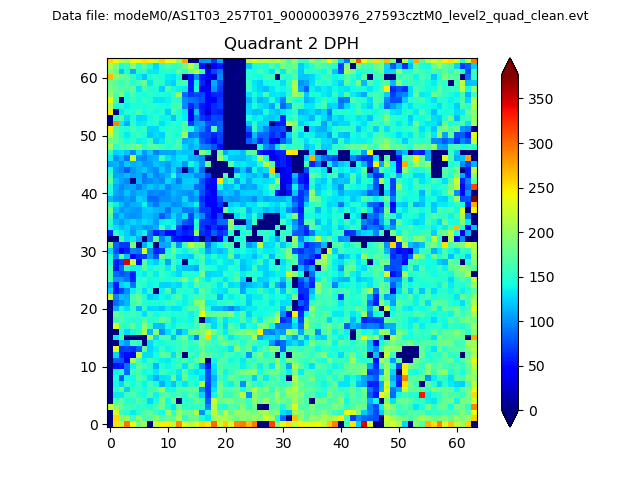
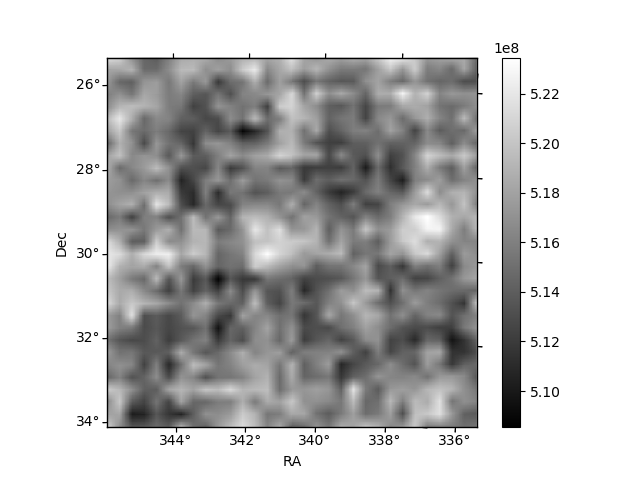
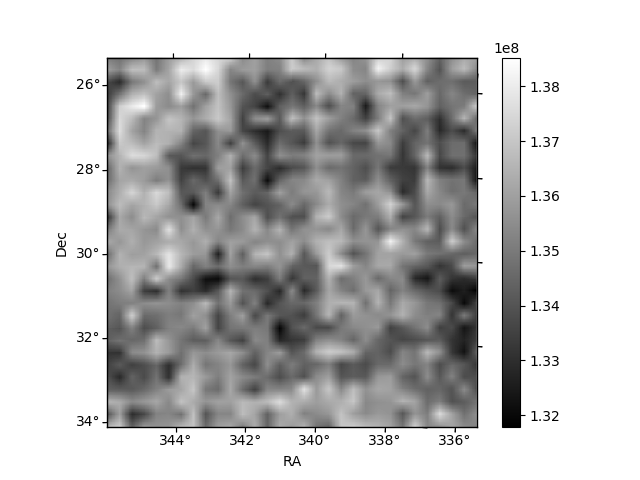
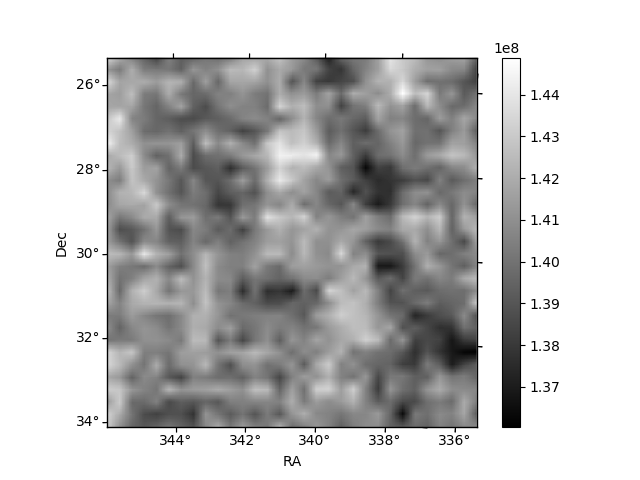
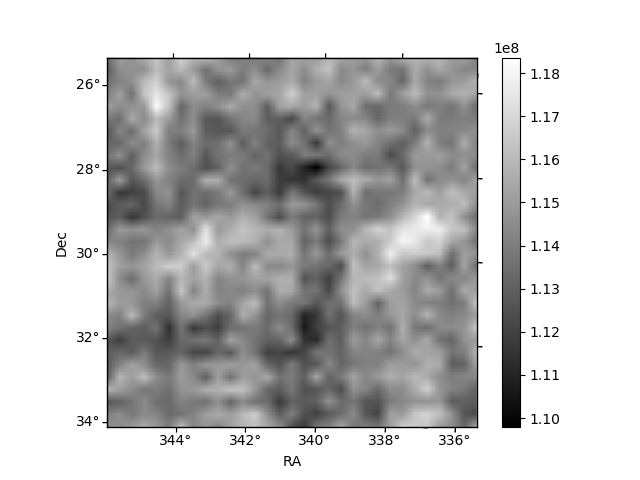
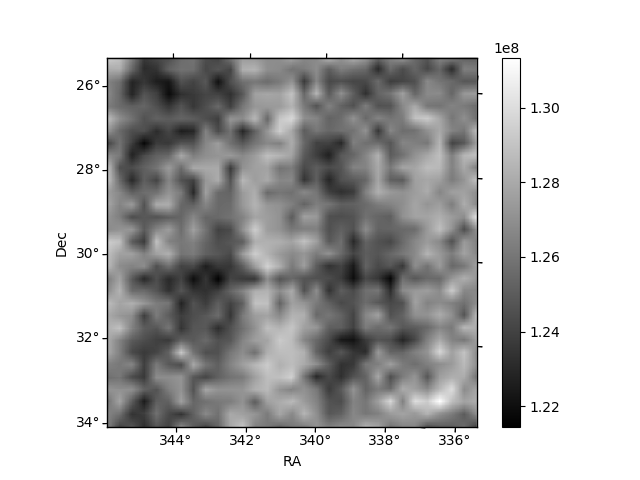
Histogram calculated using DETX and DETY for each event in the final _common_clean file
| Quadrant A | 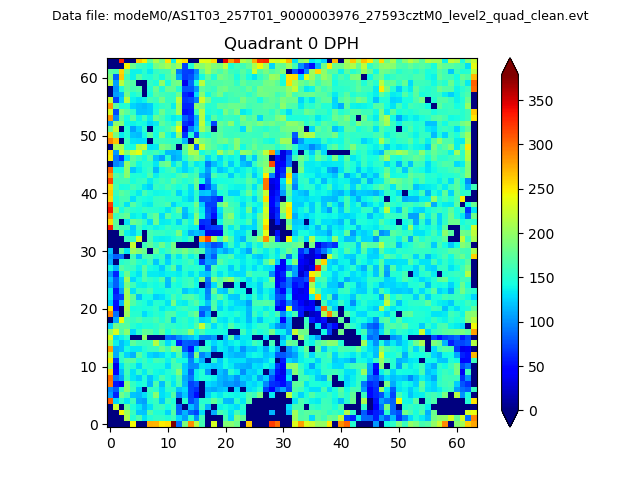 |
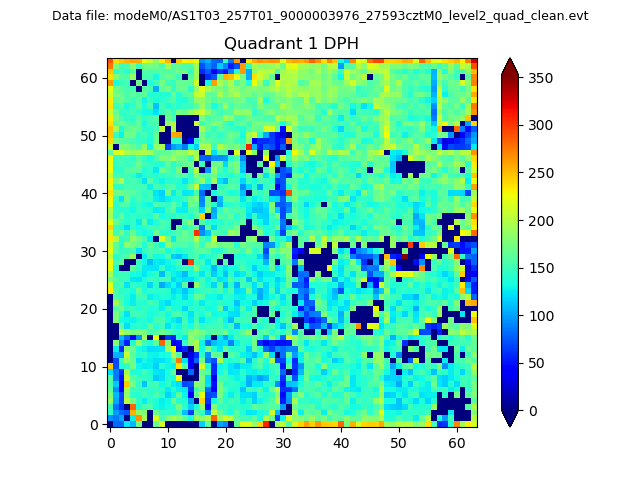 |
Quadrant B |
|---|---|---|---|
| Quadrant D | 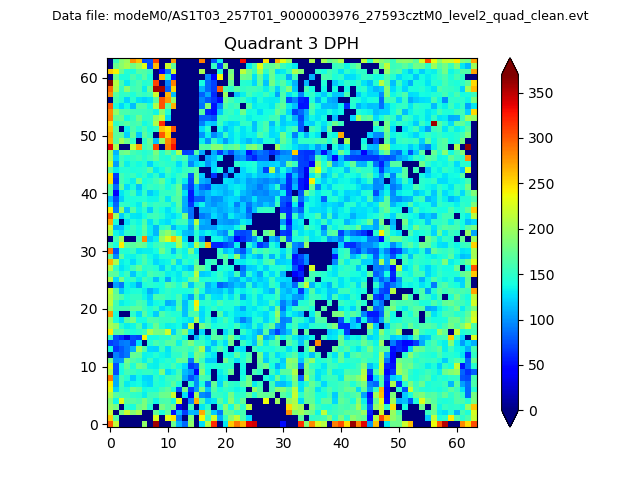 |
 |
Quadrant C |
| Plot type | Count rate plots | Images |
|---|---|---|
| Comparison with Poisson distribution Blue bars denote a histogram of data divided into 1 sec bins. Red curve is a Poisson curve with rate = median count rate of data. |
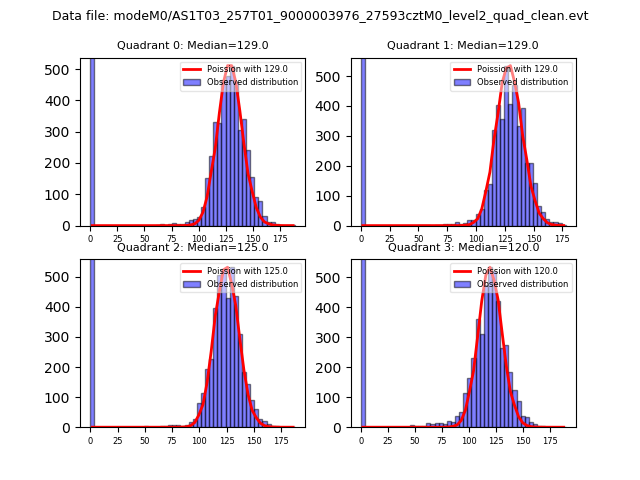 |
 |
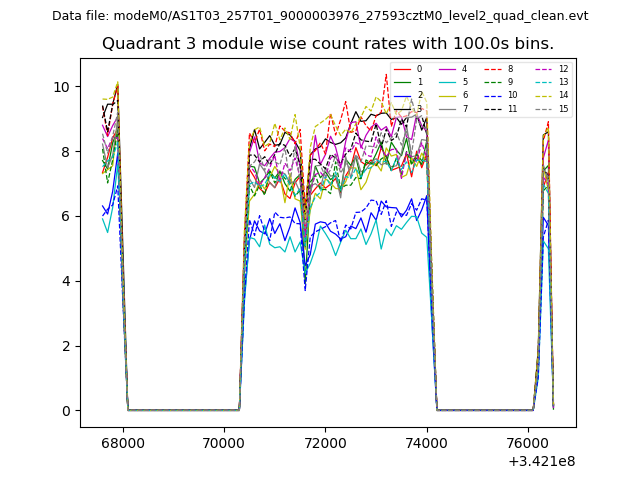
| Quadrant-wise count rates Data is divided into 100 sec bins |
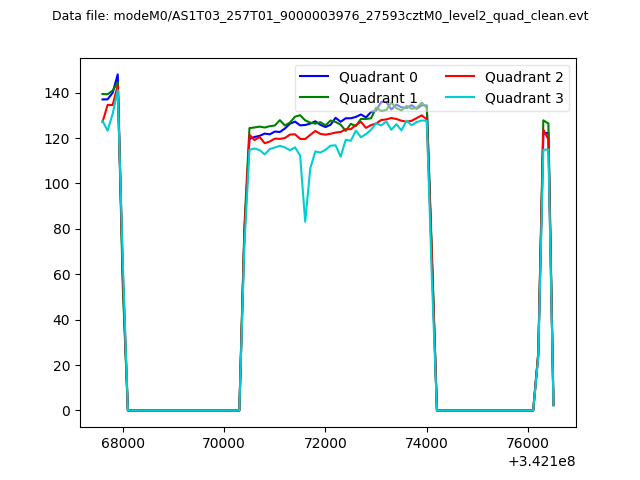 |
|
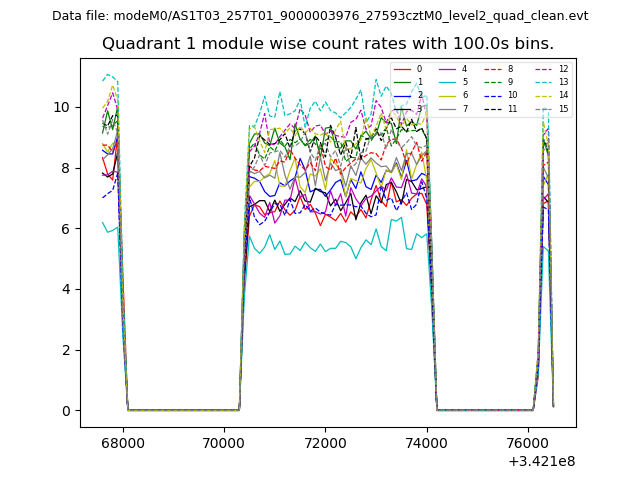
| Module-wise count rates for Quadrant A Data is divided into 100 sec bins |
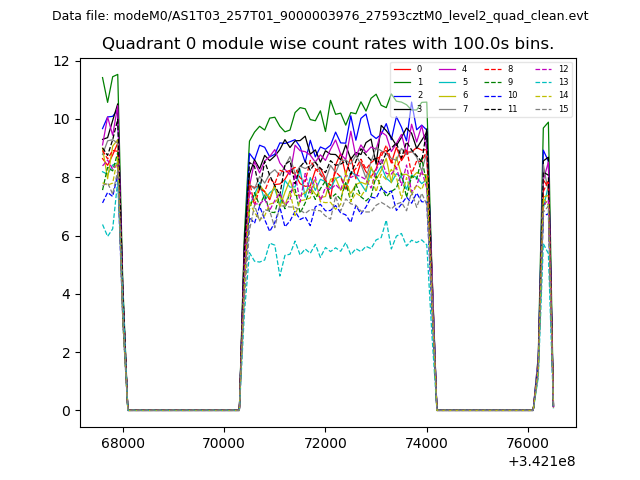 |
 |
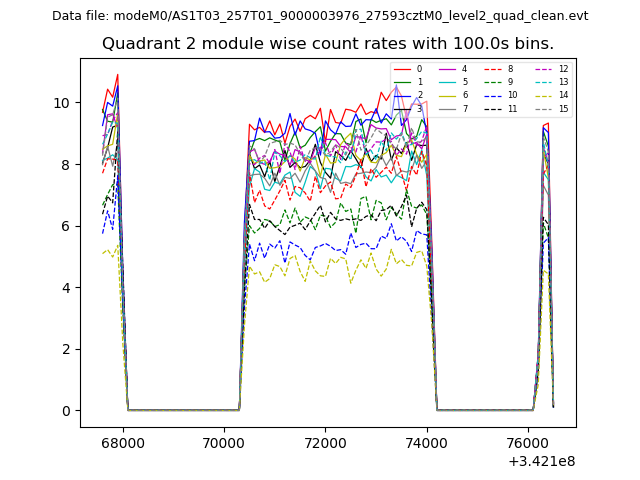
| Module-wise count rates for Quadrant B Data is divided into 100 sec bins |
 |
 |
| Module-wise count rates for Quadrant C Data is divided into 100 sec bins |
 |
 |
| Module-wise count rates for Quadrant D Data is divided into 100 sec bins |
 |
 |
| Parameter | Plot |
|---|---|
| CZT HV Monitor | 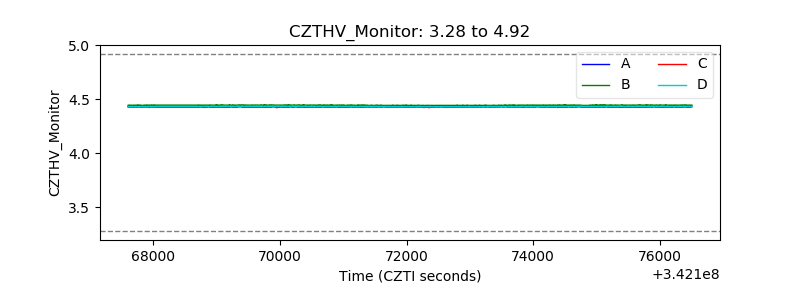 |
| D_VDD | 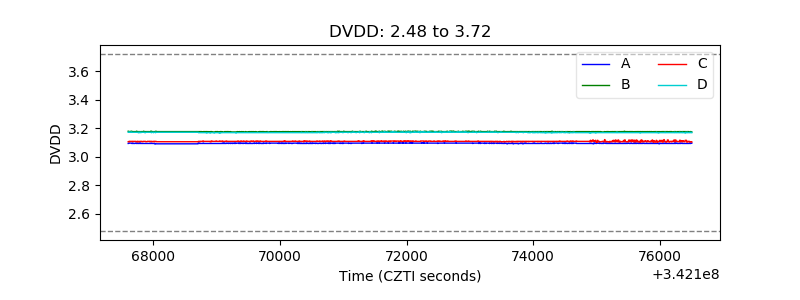 |
| Temperature 1 | 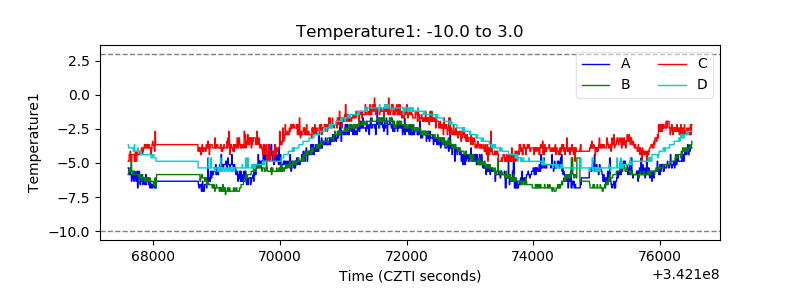 |
| Veto HV Monitor | 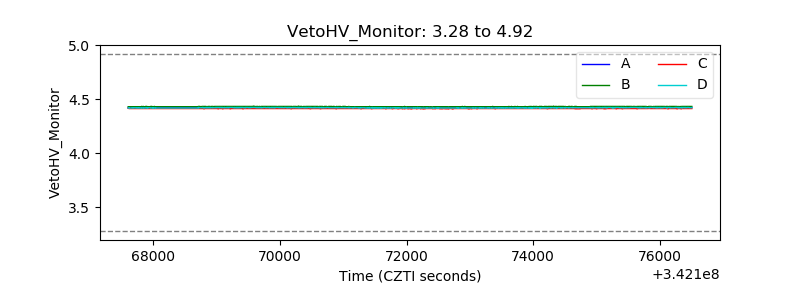 |
| Veto LLD | 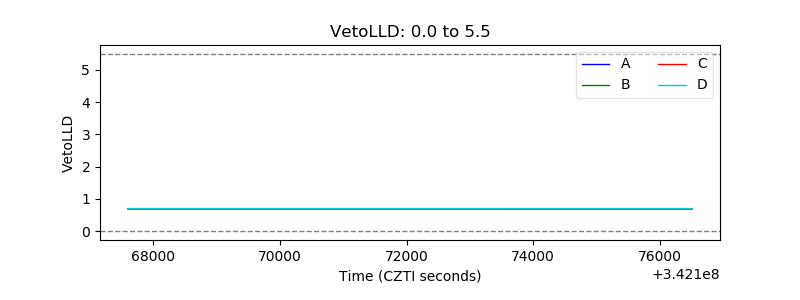 |
| Alpha Counter | 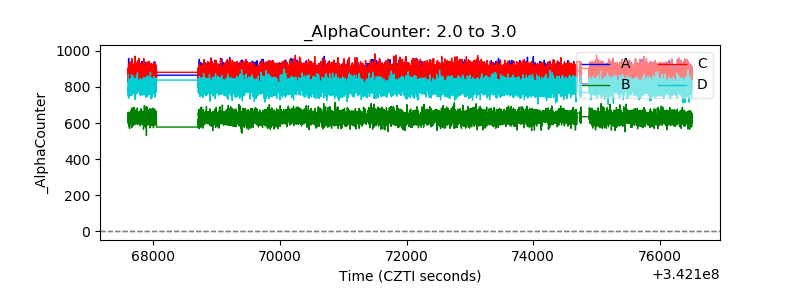 |
| _CPM_Rate | 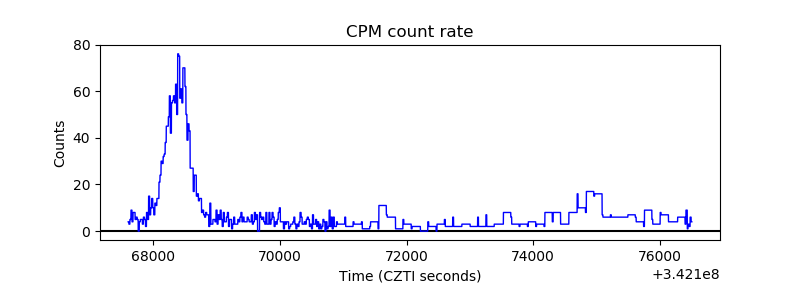 |
| CZT Counter | 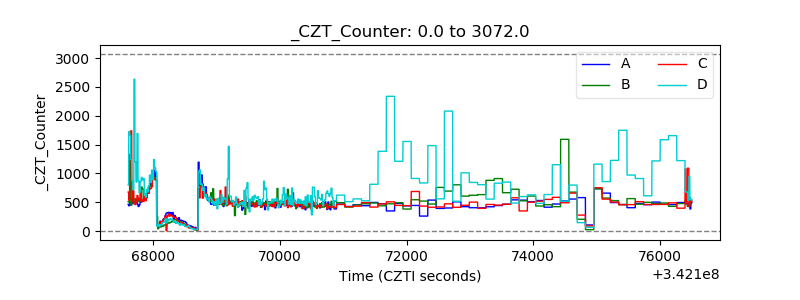 |
| +2.5 Volts monitor |  |
| +5 Volts monitor |  |
| _ROLL_ROT | 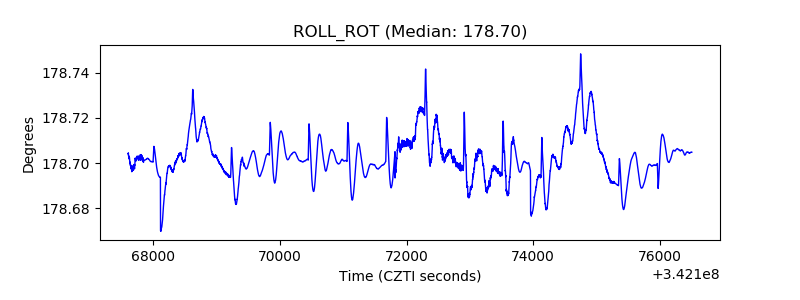 |
| _Roll_DEC |  |
| _Roll_RA | 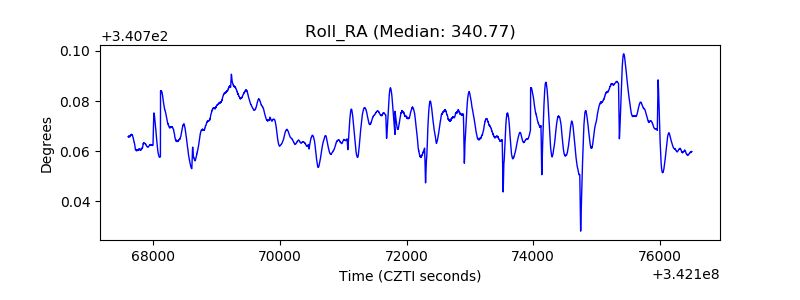 |
| Veto Counter | 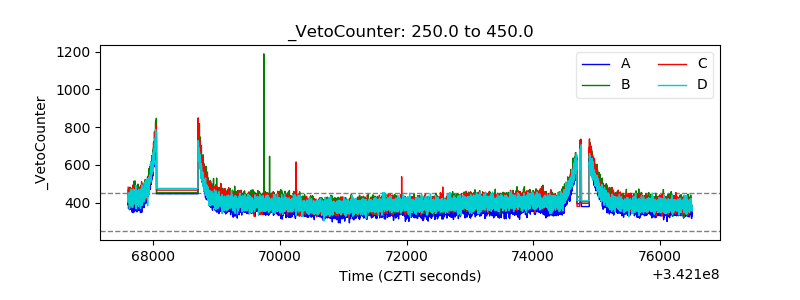 |