| Param | Original file | Final file |
|---|---|---|
| Filename | modeM0/AS1T03_257T01_9000003976_27594cztM0_level2.evt | modeM0/AS1T03_257T01_9000003976_27594cztM0_level2_quad_clean.evt |
| Size (bytes) | 745,041,600 | 90,086,400 |
| Size | 710.5 MB | 85.9 MB |
| Events in quadrant A | 3,965,129 | 559,677 |
| Events in quadrant B | 4,141,122 | 569,703 |
| Events in quadrant C | 4,297,930 | 540,606 |
| Events in quadrant D | 9,605,270 | 488,494 |
| Mode M9 | |||
|---|---|---|---|
| Quadrant | BADHDUFLAG | Total packets | Discarded packets |
| A | 0 | 2 | 0 |
| B | 0 | 2 | 0 |
| C | 0 | 2 | 0 |
| D | 0 | 2 | 0 |
| Mode M0 | |||
|---|---|---|---|
| Quadrant | BADHDUFLAG | Total packets | Discarded packets |
| A | 0 | 17164 | 0 |
| B | 0 | 17451 | 0 |
| C | 0 | 18006 | 0 |
| D | 0 | 34420 | 0 |
| Quadrant | Total seconds | Saturated seconds | Saturation percentage |
|---|---|---|---|
| A | 8188 | 328 | 4.005862% |
| B | 8189 | 401 | 4.896813% |
| C | 8189 | 414 | 5.055562% |
| D | 8187 | 1289 | 15.744473% |
Noise dominated data is calculated using 1-second bins in cleaned event files. If a bin has >2000 counts, and if more than 50% of those come from <1% of pixels, then it is considered to be noise-dominated and hence unusable.
| Quadrant | # 1 sec bins | Bins with >0 counts | Bins with >2000 counts | High rate bins dominated by noise | Noise dominated (total time) | Noise dominated (detector-on time) | Marked lightcurve |
|---|---|---|---|---|---|---|---|
| A | 8409 | 8193 | 0 | 0 | 0.00% | 0.00% | 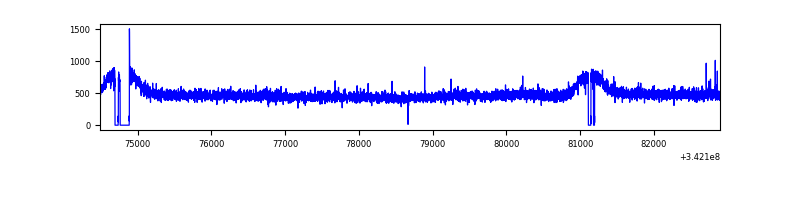 |
| B | 8409 | 8193 | 0 | 0 | 0.00% | 0.00% | 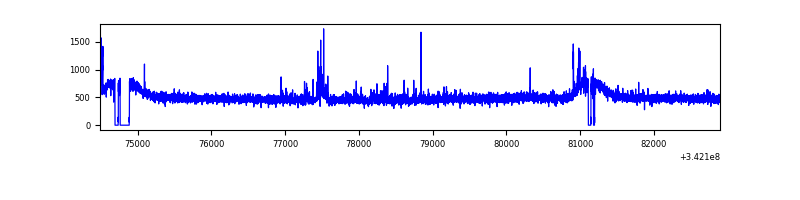 |
| C | 8409 | 8193 | 45 | 45 | 0.54% | 0.55% | 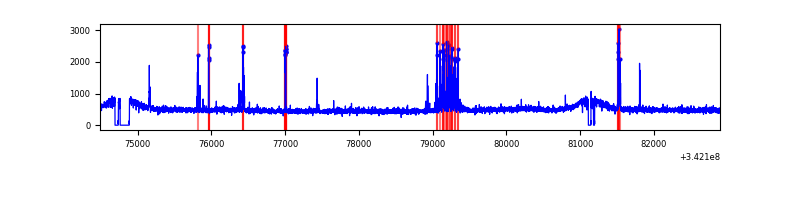 |
| D | 8409 | 8193 | 918 | 918 | 10.92% | 11.20% | 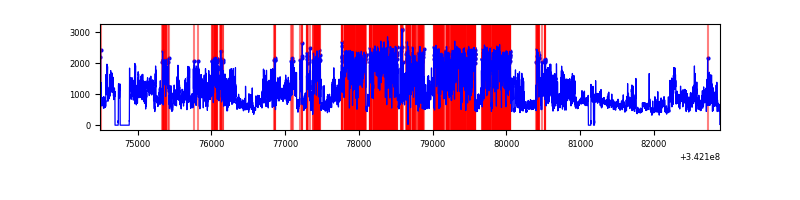 |
Top three noisy pixels from each quadrant. If the there are fewer than three noisy pixels in the level2.evt file, extra rows are filled as -1
| Pixel properties | Quadrant properties | ||||||
|---|---|---|---|---|---|---|---|
| Quadrant | DetID | PixID | Counts | Sigma | Mean | Median | Sigma |
| A | 13 | 254 | 14363 | 63.73 | 1025 | 997 | 209.7 |
| A | 3 | 137 | 10411 | 44.89 | 1025 | 997 | 209.7 |
| A | 0 | 226 | 8820 | 37.3 | 1025 | 997 | 209.7 |
| B | 10 | 245 | 42236 | 208.29 | 1018 | 988 | 198.0 |
| B | 0 | 230 | 38099 | 187.4 | 1018 | 988 | 198.0 |
| B | 4 | 200 | 34618 | 169.82 | 1018 | 988 | 198.0 |
| C | 2 | 16 | 242883 | 1044.58 | 983 | 986 | 231.6 |
| C | 14 | 238 | 156324 | 670.79 | 983 | 986 | 231.6 |
| C | 3 | 233 | 33592 | 140.8 | 983 | 986 | 231.6 |
| D | 1 | 52 | 5750013 | 24619.78 | 965 | 935 | 233.5 |
| D | 7 | 80 | 96158 | 407.78 | 965 | 935 | 233.5 |
| D | 2 | 250 | 63123 | 266.31 | 965 | 935 | 233.5 |
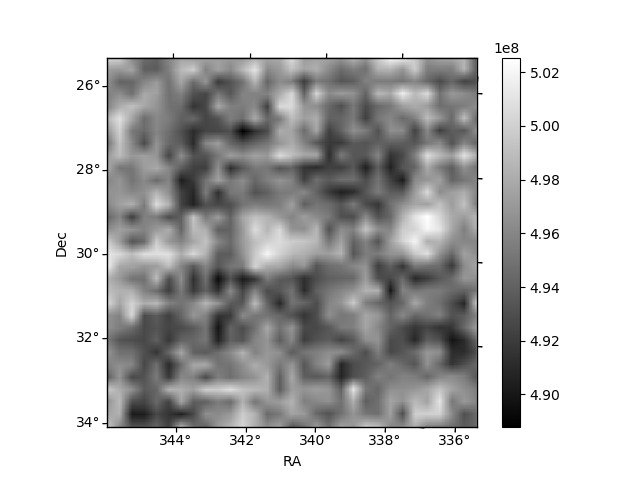
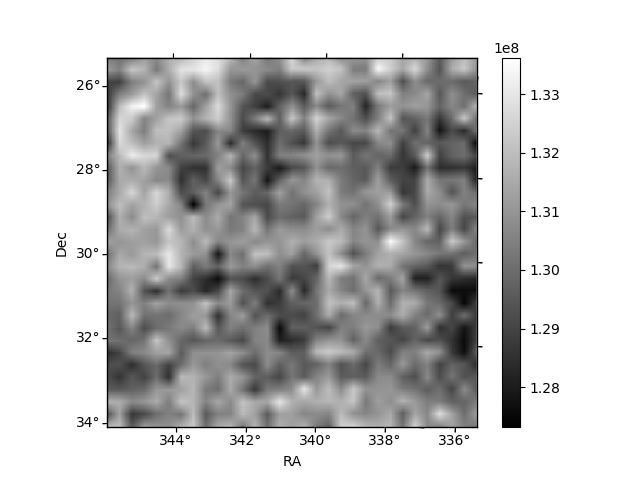
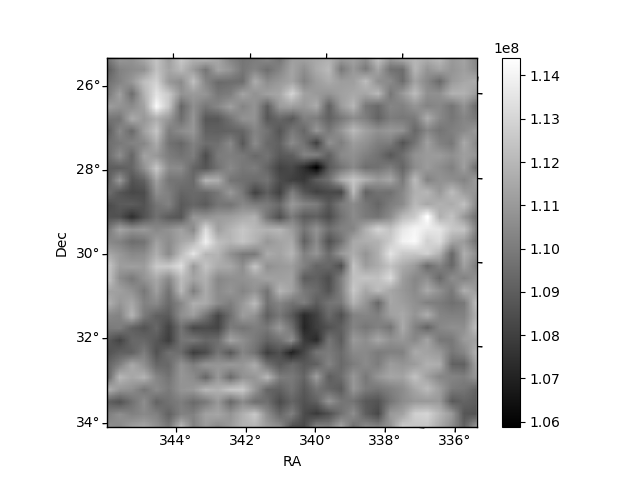
Histogram calculated using DETX and DETY for each event in the final _common_clean file
| Quadrant A | 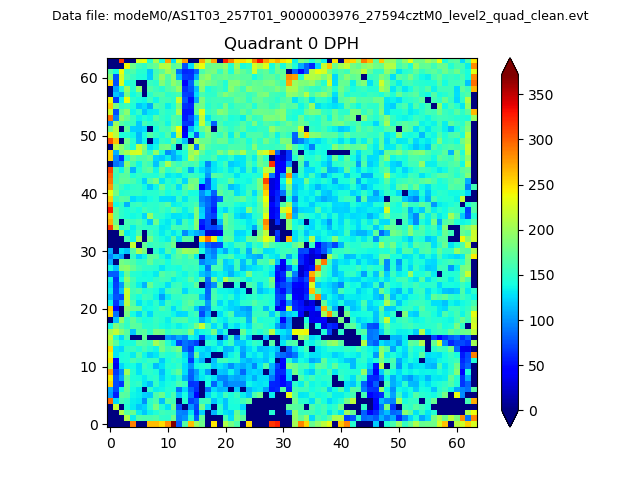 |
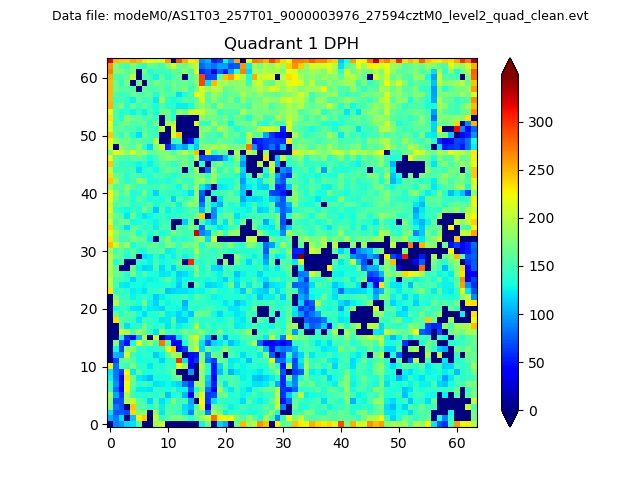 |
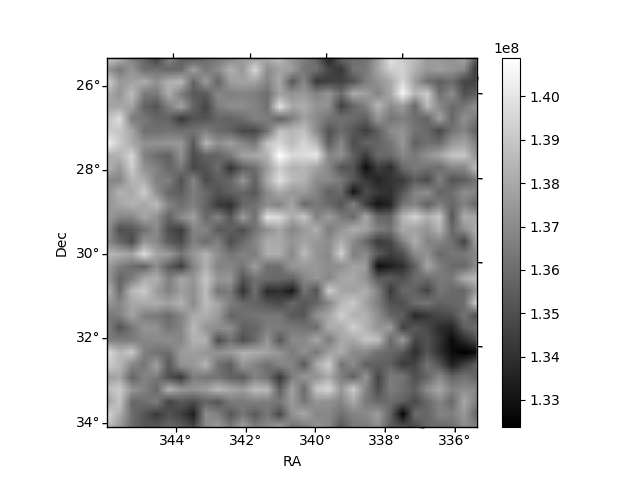
Quadrant B |
|---|---|---|---|
| Quadrant D | 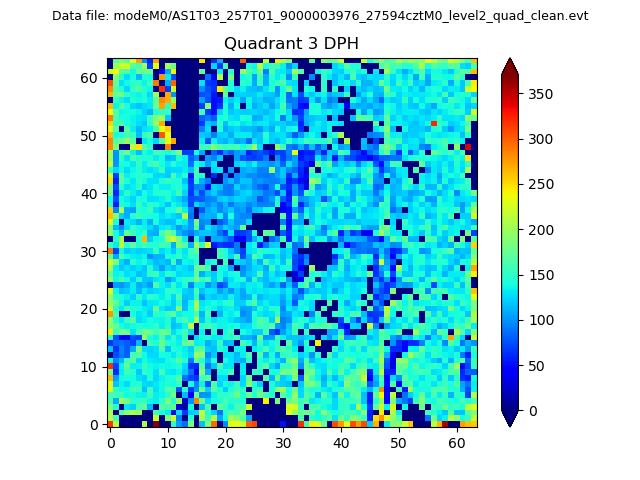 |
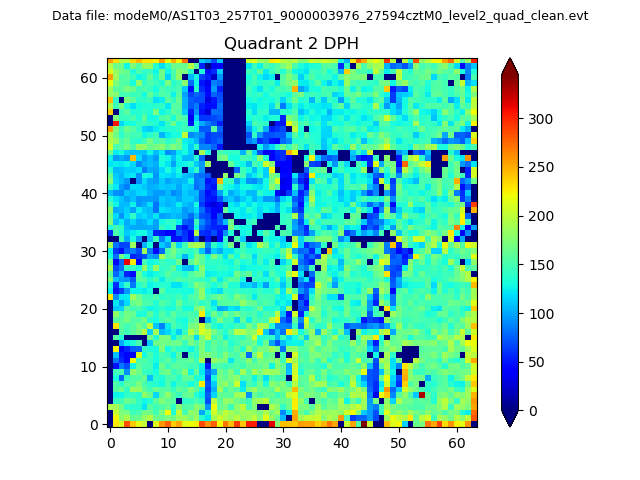 |
Quadrant C |
| Plot type | Count rate plots | Images |
|---|---|---|
| Comparison with Poisson distribution Blue bars denote a histogram of data divided into 1 sec bins. Red curve is a Poisson curve with rate = median count rate of data. |
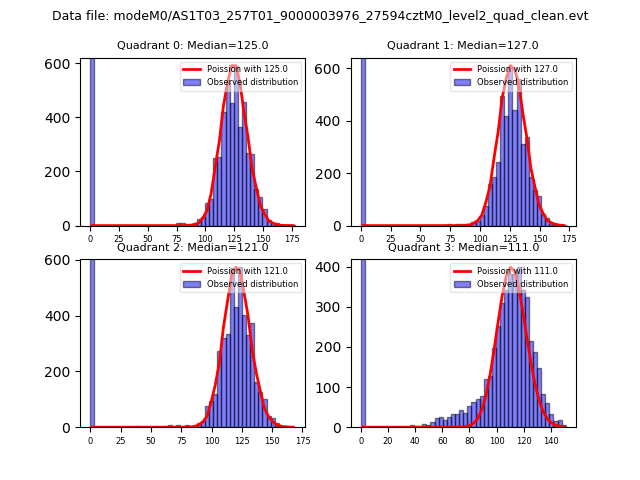 |
 |
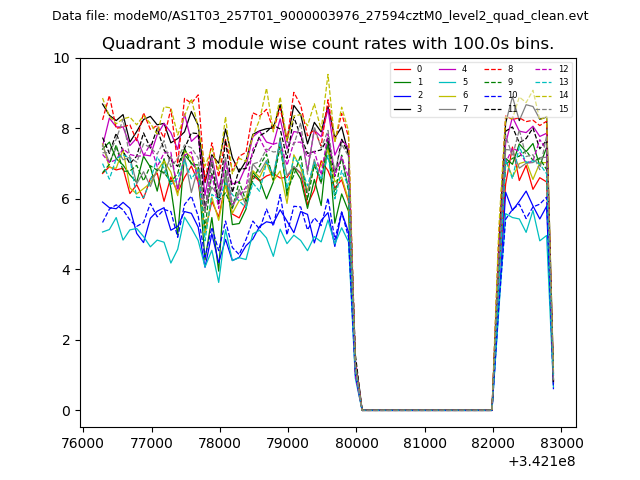
| Quadrant-wise count rates Data is divided into 100 sec bins |
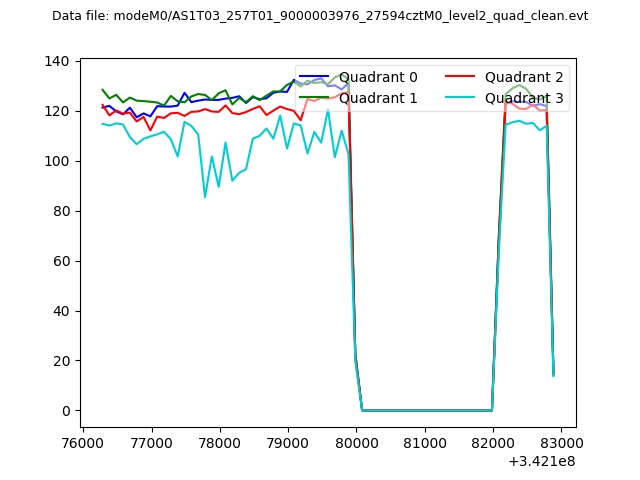 |
|
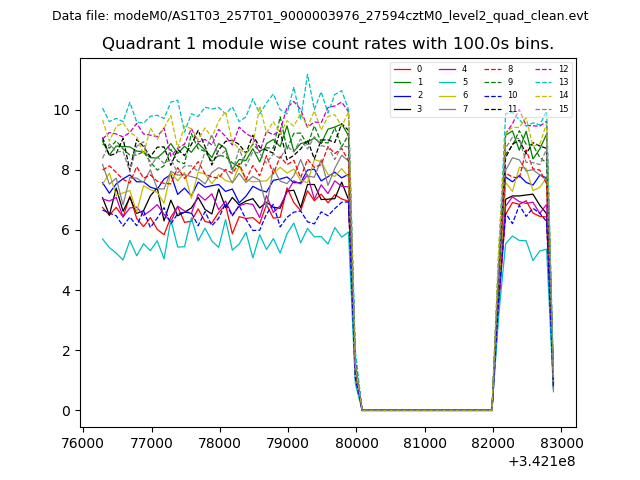
| Module-wise count rates for Quadrant A Data is divided into 100 sec bins |
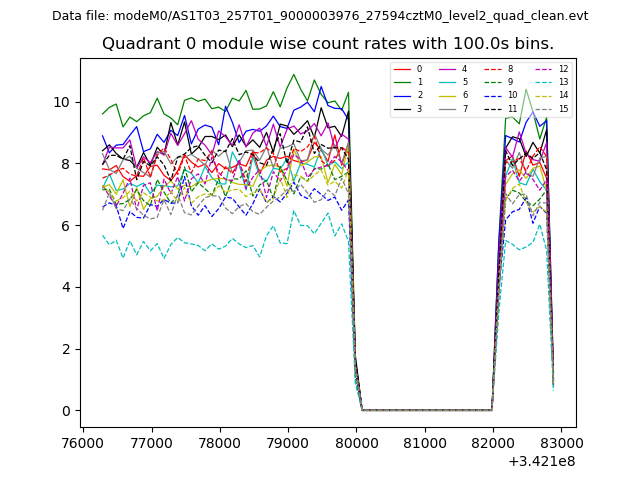 |
 |
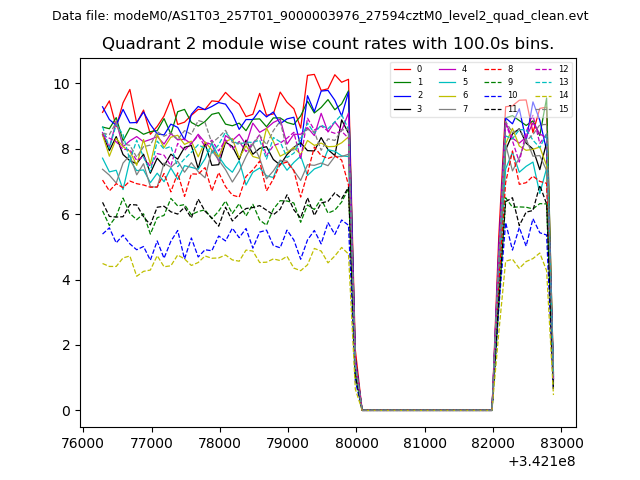
| Module-wise count rates for Quadrant B Data is divided into 100 sec bins |
 |
 |
| Module-wise count rates for Quadrant C Data is divided into 100 sec bins |
 |
 |
| Module-wise count rates for Quadrant D Data is divided into 100 sec bins |
 |
 |
| Parameter | Plot |
|---|---|
| CZT HV Monitor | 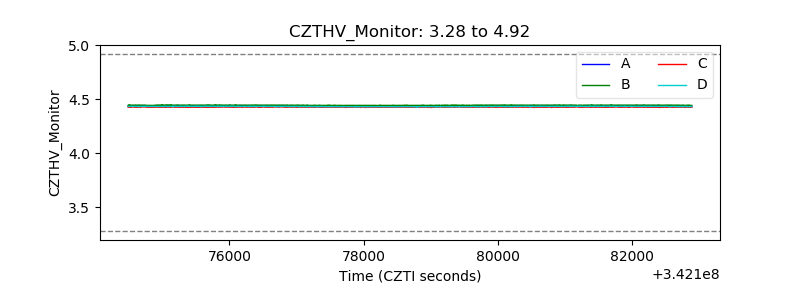 |
| D_VDD | 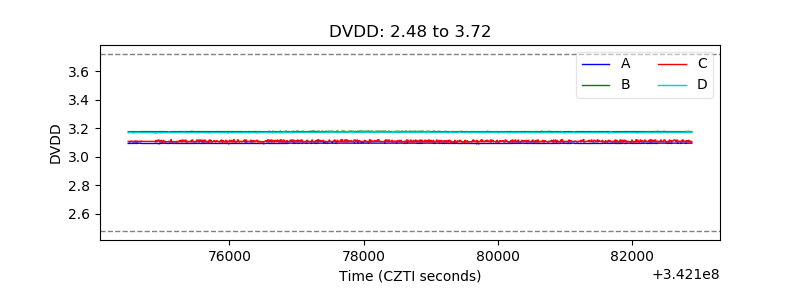 |
| Temperature 1 | 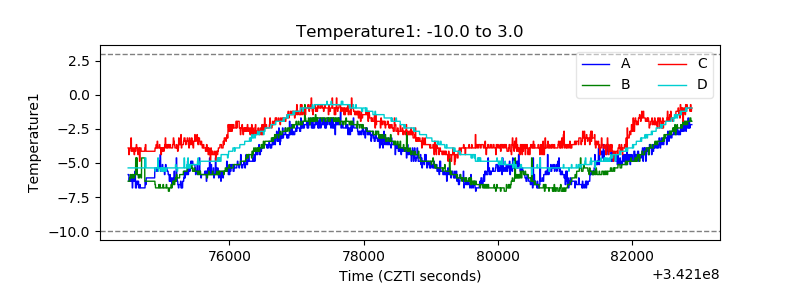 |
| Veto HV Monitor | 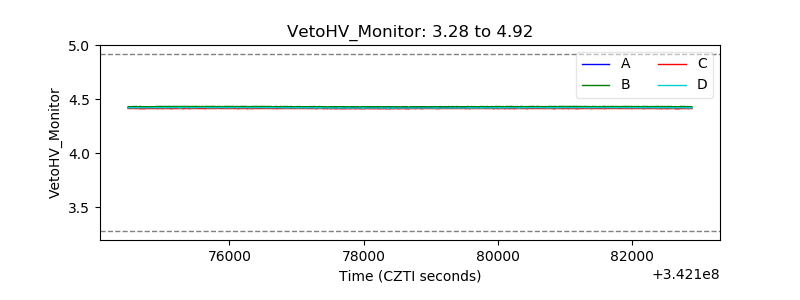 |
| Veto LLD | 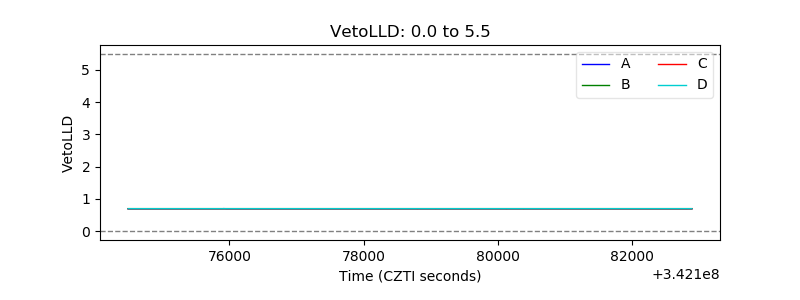 |
| Alpha Counter | 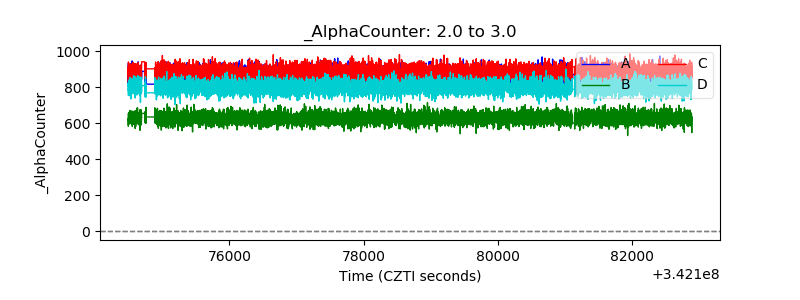 |
| _CPM_Rate | 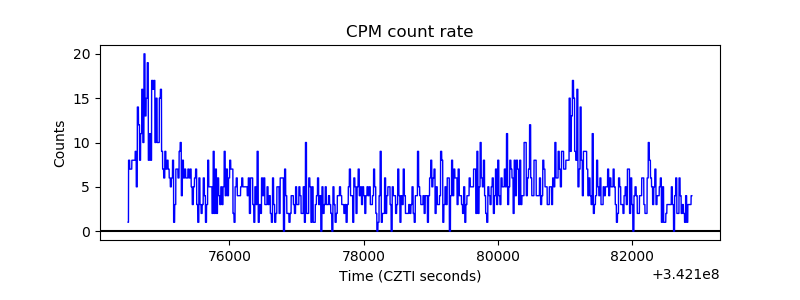 |
| CZT Counter | 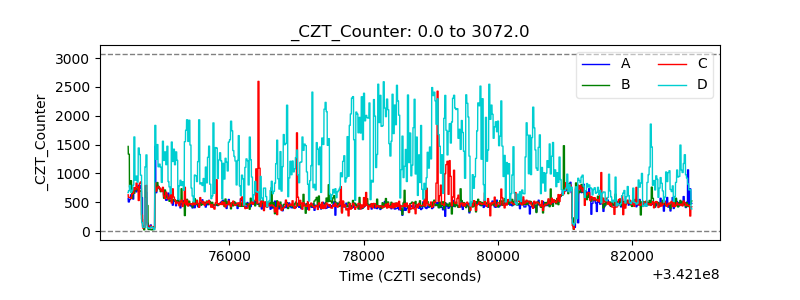 |
| +2.5 Volts monitor |  |
| +5 Volts monitor |  |
| _ROLL_ROT | 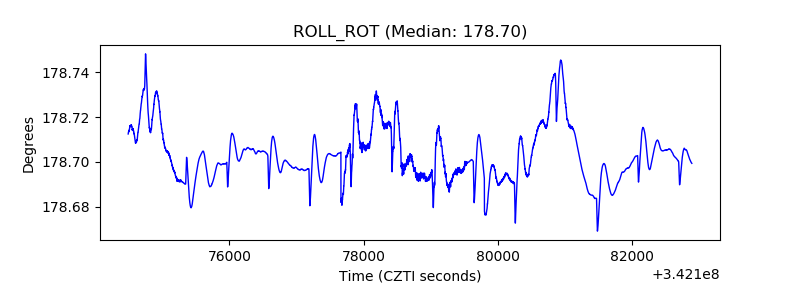 |
| _Roll_DEC | 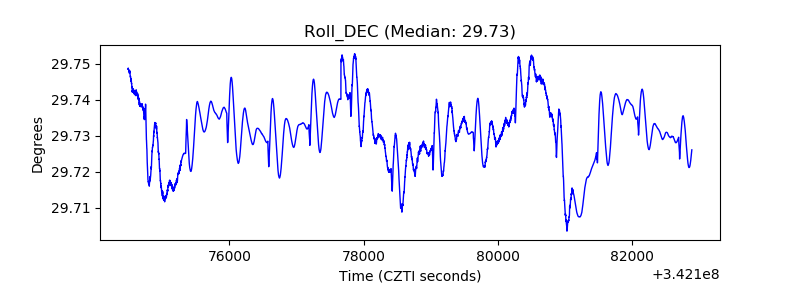 |
| _Roll_RA | 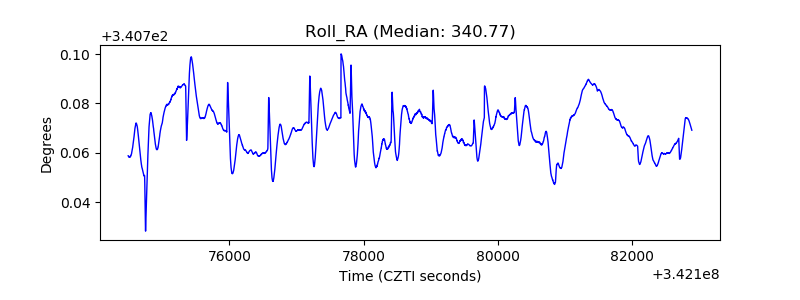 |
| Veto Counter | 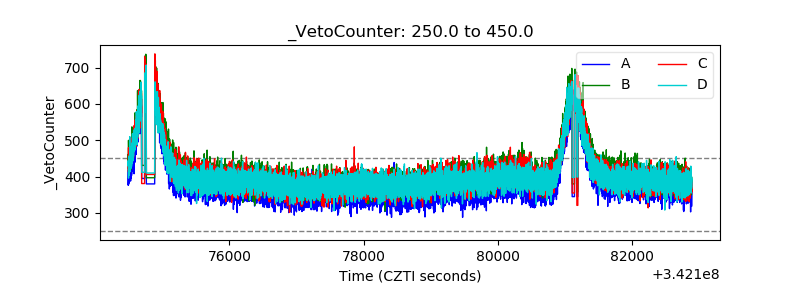 |