| Param | Original file | Final file |
|---|---|---|
| Filename | modeM0/AS1T03_257T01_9000003976_27595cztM0_level2.evt | modeM0/AS1T03_257T01_9000003976_27595cztM0_level2_quad_clean.evt |
| Size (bytes) | 537,451,200 | 92,845,440 |
| Size | 512.6 MB | 88.5 MB |
| Events in quadrant A | 3,186,756 | 603,403 |
| Events in quadrant B | 3,297,699 | 613,616 |
| Events in quadrant C | 3,345,547 | 582,927 |
| Events in quadrant D | 5,991,806 | 544,153 |
| Mode M9 | |||
|---|---|---|---|
| Quadrant | BADHDUFLAG | Total packets | Discarded packets |
| A | 0 | 3 | 0 |
| B | 0 | 3 | 0 |
| C | 0 | 3 | 0 |
| D | 0 | 3 | 0 |
| Mode M0 | |||
|---|---|---|---|
| Quadrant | BADHDUFLAG | Total packets | Discarded packets |
| A | 0 | 13830 | 0 |
| B | 0 | 14036 | 0 |
| C | 0 | 14256 | 0 |
| D | 0 | 22437 | 0 |
| Quadrant | Total seconds | Saturated seconds | Saturation percentage |
|---|---|---|---|
| A | 6705 | 113 | 1.685309% |
| B | 6705 | 155 | 2.311708% |
| C | 6705 | 156 | 2.326622% |
| D | 6706 | 639 | 9.528780% |
Noise dominated data is calculated using 1-second bins in cleaned event files. If a bin has >2000 counts, and if more than 50% of those come from <1% of pixels, then it is considered to be noise-dominated and hence unusable.
| Quadrant | # 1 sec bins | Bins with >0 counts | Bins with >2000 counts | High rate bins dominated by noise | Noise dominated (total time) | Noise dominated (detector-on time) | Marked lightcurve |
|---|---|---|---|---|---|---|---|
| A | 7000 | 6706 | 0 | 0 | 0.00% | 0.00% |  |
| B | 7000 | 6706 | 2 | 2 | 0.03% | 0.03% |  |
| C | 7000 | 6706 | 19 | 19 | 0.27% | 0.28% |  |
| D | 7001 | 6707 | 517 | 517 | 7.38% | 7.71% | 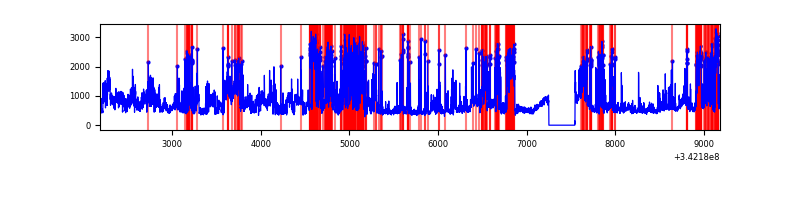 |
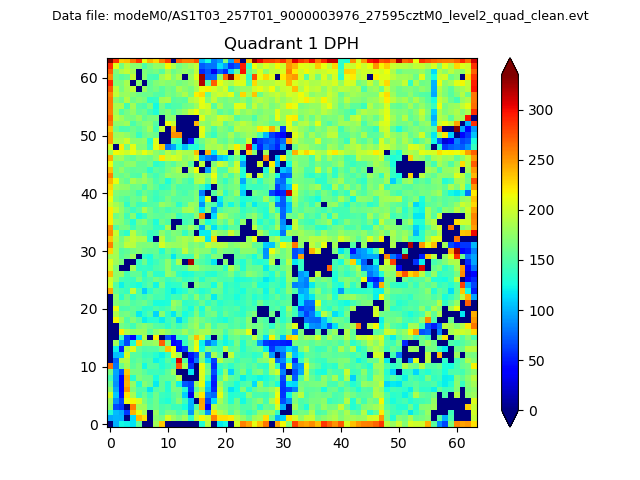
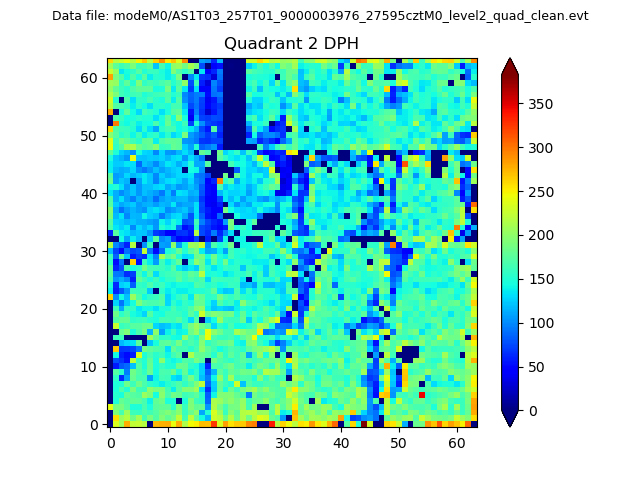
Top three noisy pixels from each quadrant. If the there are fewer than three noisy pixels in the level2.evt file, extra rows are filled as -1
| Pixel properties | Quadrant properties | ||||||
|---|---|---|---|---|---|---|---|
| Quadrant | DetID | PixID | Counts | Sigma | Mean | Median | Sigma |
| A | 15 | 174 | 38301 | 226.94 | 813 | 794 | 165.3 |
| A | 13 | 254 | 12067 | 68.21 | 813 | 794 | 165.3 |
| A | 3 | 137 | 7897 | 42.98 | 813 | 794 | 165.3 |
| B | 10 | 245 | 50430 | 320.75 | 803 | 782 | 154.8 |
| B | 15 | 32 | 40335 | 255.53 | 803 | 782 | 154.8 |
| B | 12 | 111 | 19458 | 120.65 | 803 | 782 | 154.8 |
| C | 2 | 16 | 168643 | 912.89 | 778 | 782 | 183.9 |
| C | 14 | 238 | 122753 | 663.32 | 778 | 782 | 183.9 |
| C | 8 | 128 | 9411 | 46.93 | 778 | 782 | 183.9 |
| D | 7 | 80 | 1707978 | 9293.13 | 766 | 744 | 183.7 |
| D | 1 | 52 | 1221481 | 6644.94 | 766 | 744 | 183.7 |
| D | 2 | 250 | 128118 | 693.35 | 766 | 744 | 183.7 |
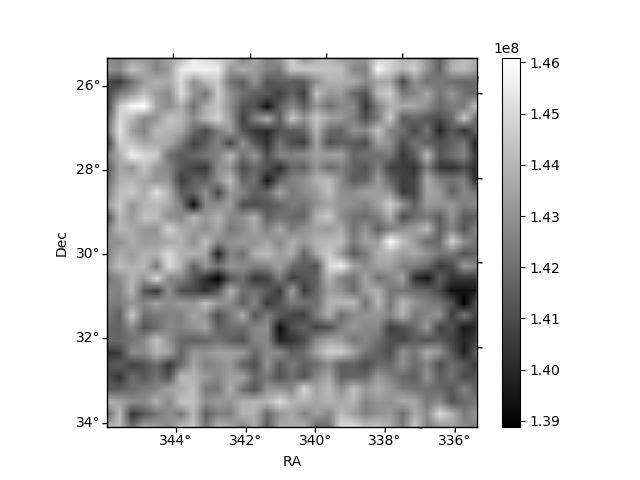
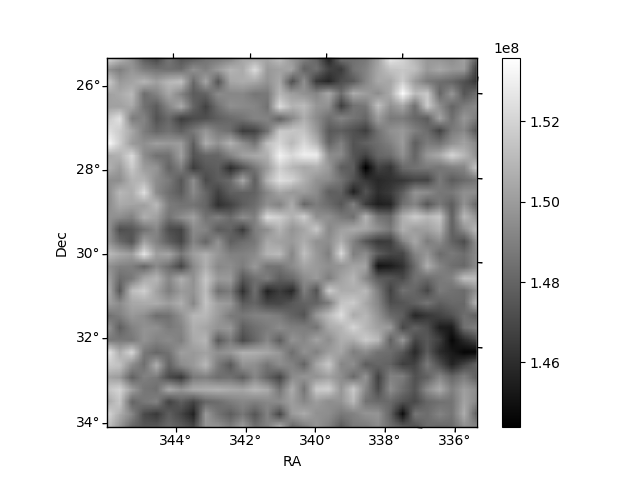
Histogram calculated using DETX and DETY for each event in the final _common_clean file
| Quadrant A | 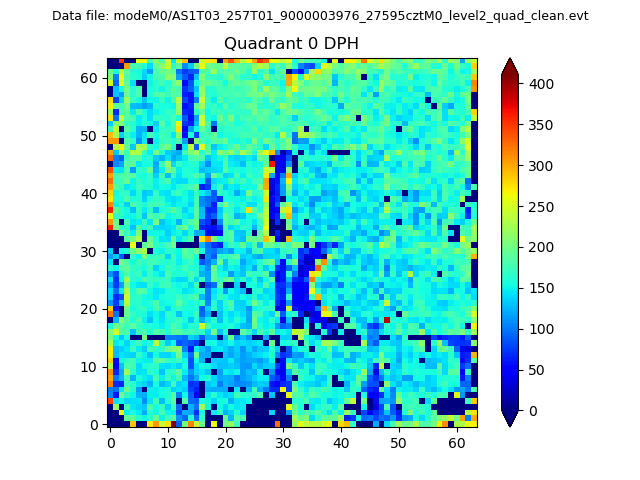 |
 |
Quadrant B |
|---|---|---|---|
| Quadrant D | 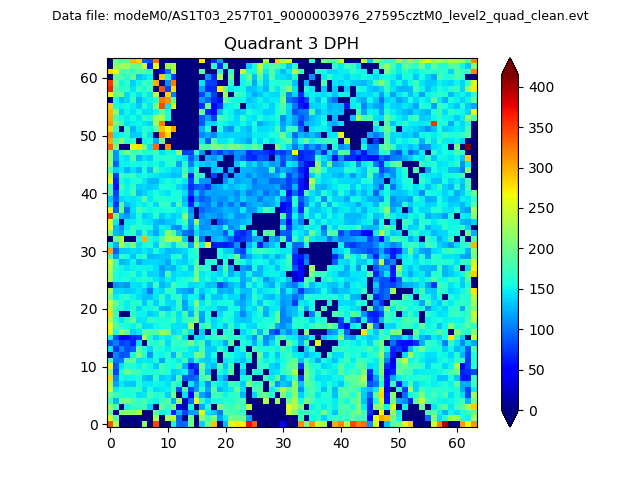 |
 |
Quadrant C |
| Plot type | Count rate plots | Images |
|---|---|---|
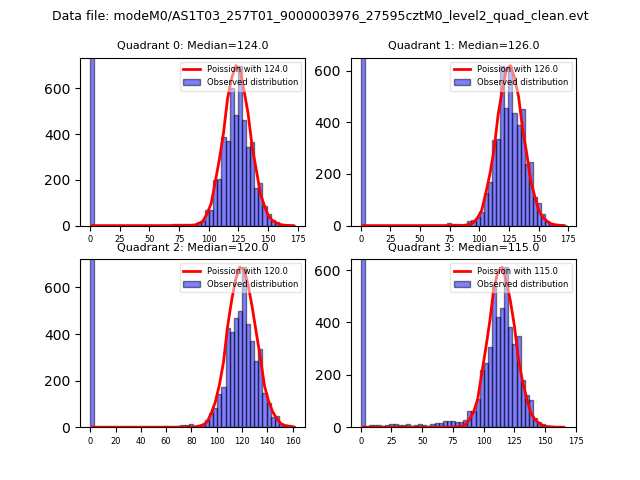
| Comparison with Poisson distribution Blue bars denote a histogram of data divided into 1 sec bins. Red curve is a Poisson curve with rate = median count rate of data. |
 |
 |
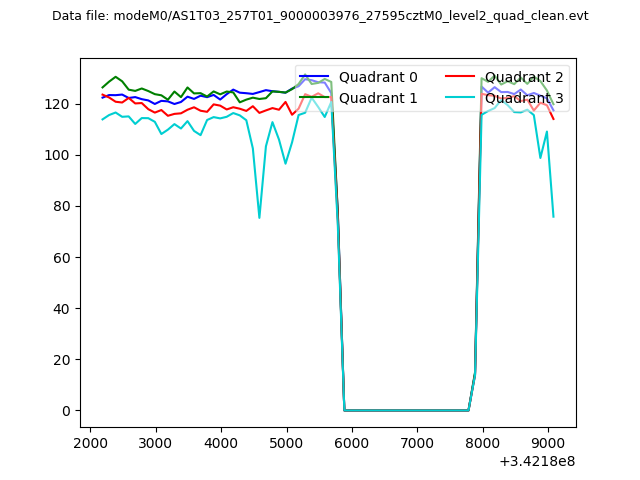
| Quadrant-wise count rates Data is divided into 100 sec bins |
 |
|
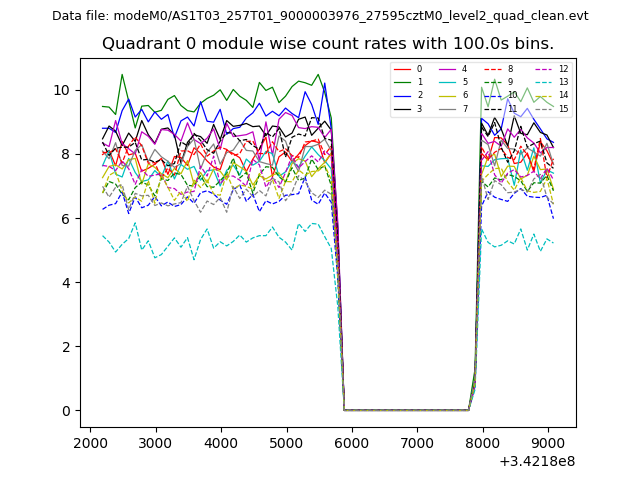
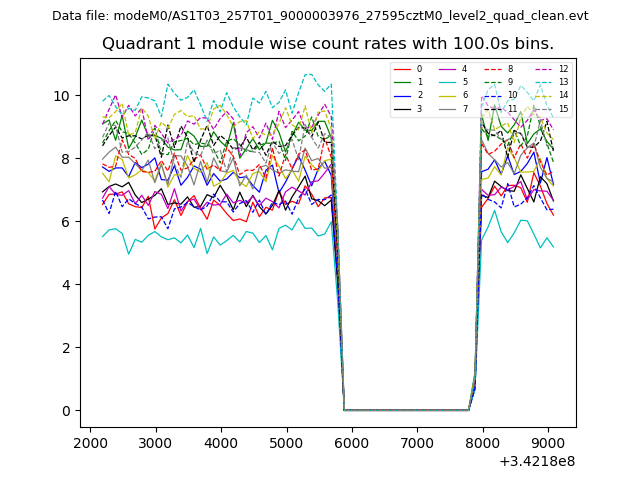
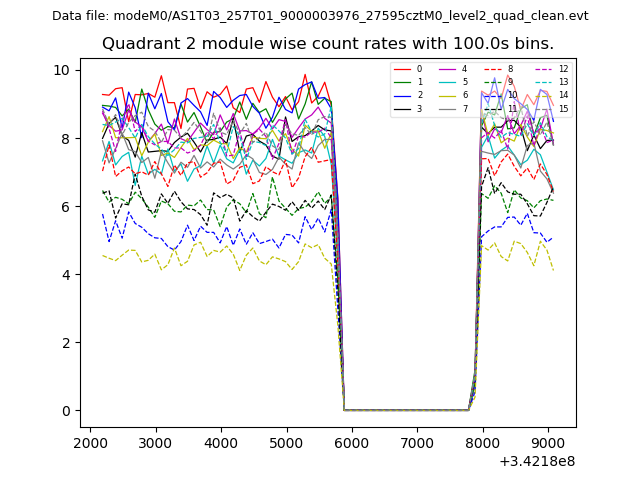
| Module-wise count rates for Quadrant A Data is divided into 100 sec bins |
 |
 |
| Module-wise count rates for Quadrant B Data is divided into 100 sec bins |
 |
 |
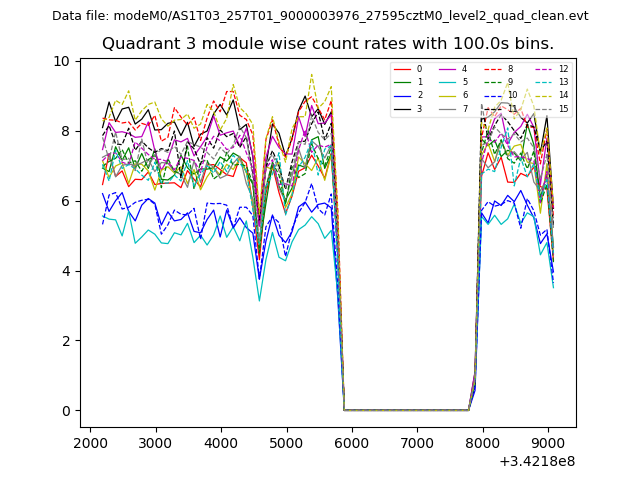
| Module-wise count rates for Quadrant C Data is divided into 100 sec bins |
 |
 |
| Module-wise count rates for Quadrant D Data is divided into 100 sec bins |
 |
 |
| Parameter | Plot |
|---|---|
| CZT HV Monitor | 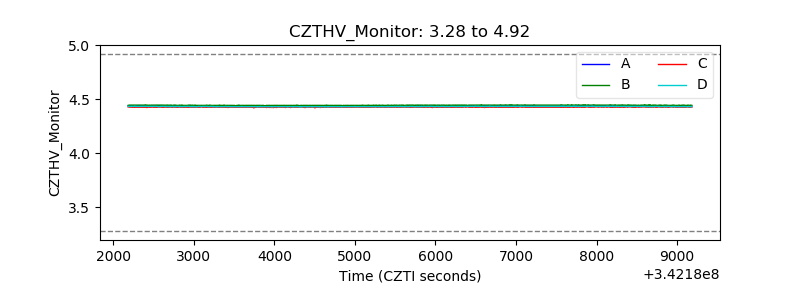 |
| D_VDD | 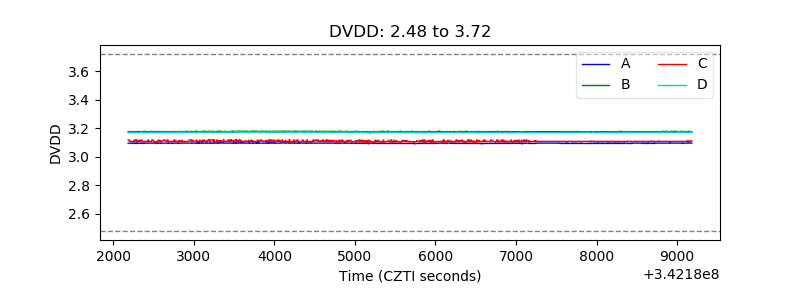 |
| Temperature 1 | 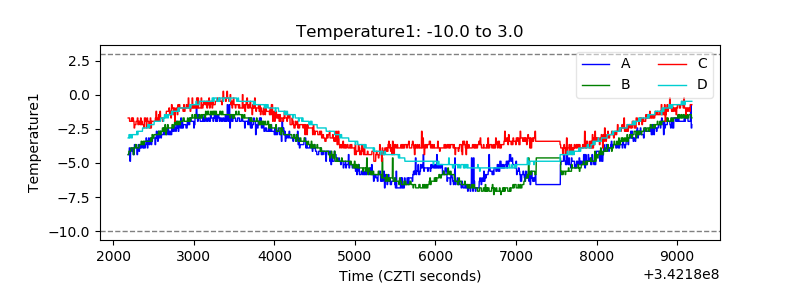 |
| Veto HV Monitor | 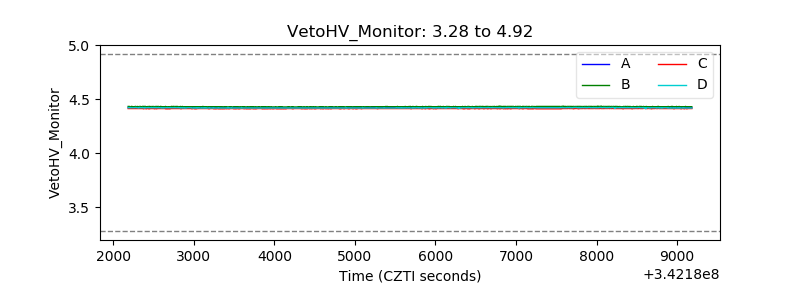 |
| Veto LLD | 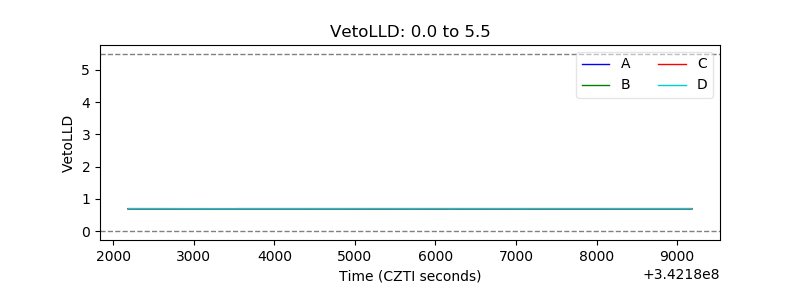 |
| Alpha Counter | 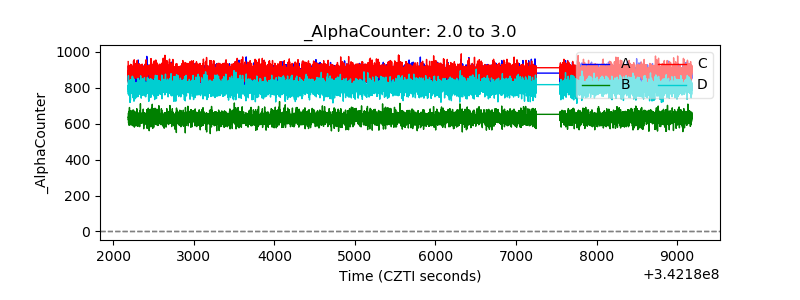 |
| _CPM_Rate | 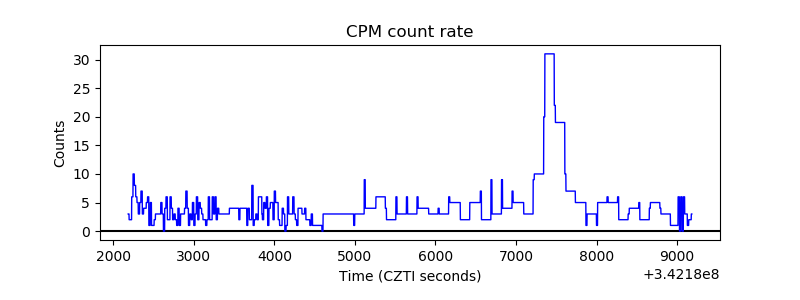 |
| CZT Counter | 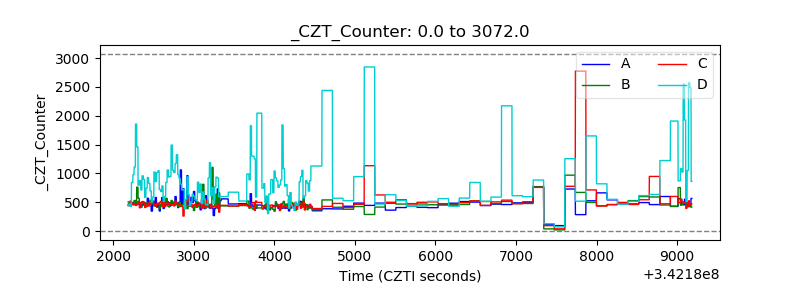 |
| +2.5 Volts monitor |  |
| +5 Volts monitor |  |
| _ROLL_ROT | 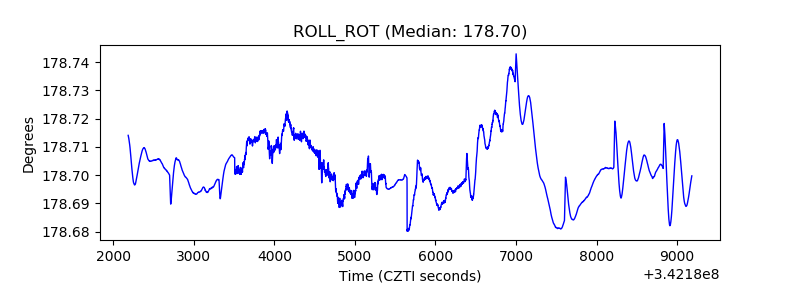 |
| _Roll_DEC | 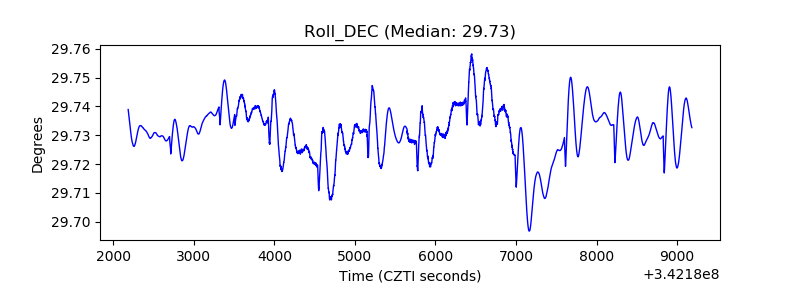 |
| _Roll_RA | 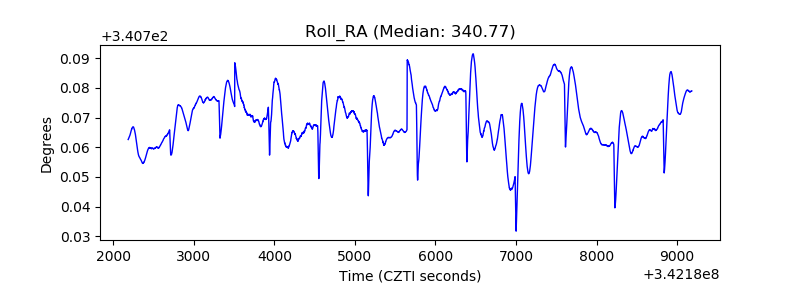 |
| Veto Counter | 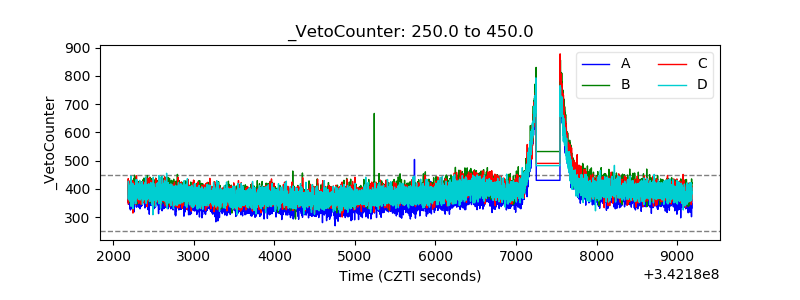 |