| Param | Original file | Final file |
|---|---|---|
| Filename | modeM0/AS1T03_257T01_9000003976_27597cztM0_level2.evt | modeM0/AS1T03_257T01_9000003976_27597cztM0_level2_quad_clean.evt |
| Size (bytes) | 1,035,328,320 | 171,288,000 |
| Size | 987.4 MB | 163.4 MB |
| Events in quadrant A | 5,894,582 | 1,110,394 |
| Events in quadrant B | 6,353,153 | 1,126,002 |
| Events in quadrant C | 6,291,858 | 1,074,588 |
| Events in quadrant D | 11,959,666 | 1,000,943 |
| Mode M9 | |||
|---|---|---|---|
| Quadrant | BADHDUFLAG | Total packets | Discarded packets |
| A | 0 | 12 | 0 |
| B | 0 | 12 | 0 |
| C | 0 | 12 | 0 |
| D | 0 | 12 | 0 |
| Mode M0 | |||
|---|---|---|---|
| Quadrant | BADHDUFLAG | Total packets | Discarded packets |
| A | 0 | 25860 | 0 |
| B | 0 | 26841 | 0 |
| C | 0 | 26861 | 0 |
| D | 0 | 44328 | 0 |
| Quadrant | Total seconds | Saturated seconds | Saturation percentage |
|---|---|---|---|
| A | 12663 | 124 | 0.979231% |
| B | 12664 | 159 | 1.255527% |
| C | 12664 | 253 | 1.997789% |
| D | 12664 | 1218 | 9.617814% |
Noise dominated data is calculated using 1-second bins in cleaned event files. If a bin has >2000 counts, and if more than 50% of those come from <1% of pixels, then it is considered to be noise-dominated and hence unusable.
| Quadrant | # 1 sec bins | Bins with >0 counts | Bins with >2000 counts | High rate bins dominated by noise | Noise dominated (total time) | Noise dominated (detector-on time) | Marked lightcurve |
|---|---|---|---|---|---|---|---|
| A | 13928 | 12665 | 1 | 1 | 0.01% | 0.01% | 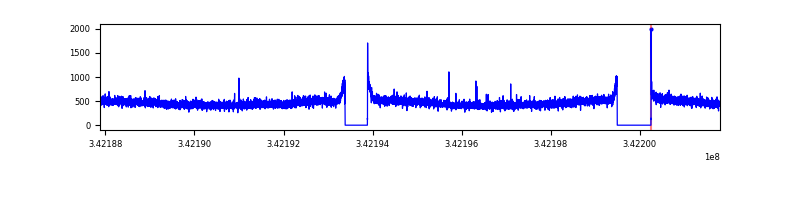 |
| B | 13929 | 12666 | 23 | 23 | 0.17% | 0.18% | 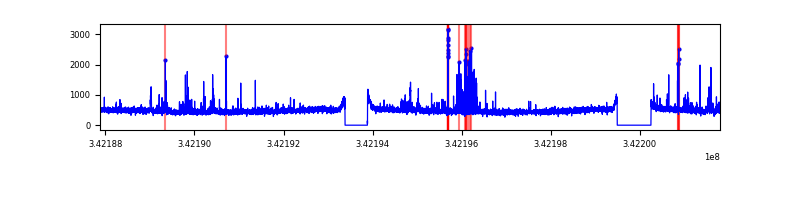 |
| C | 13929 | 12666 | 42 | 42 | 0.30% | 0.33% | 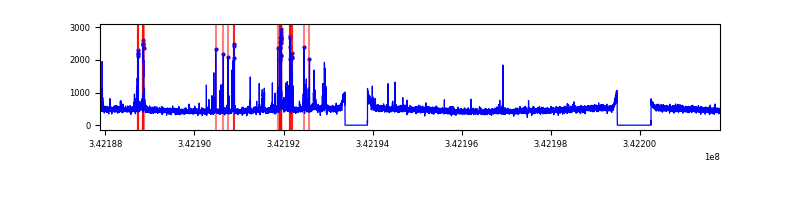 |
| D | 13929 | 12666 | 1174 | 1174 | 8.43% | 9.27% | 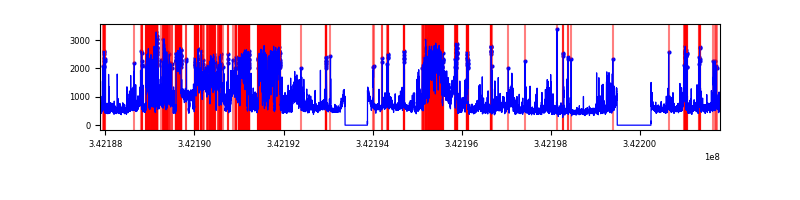 |
Top three noisy pixels from each quadrant. If the there are fewer than three noisy pixels in the level2.evt file, extra rows are filled as -1
| Pixel properties | Quadrant properties | ||||||
|---|---|---|---|---|---|---|---|
| Quadrant | DetID | PixID | Counts | Sigma | Mean | Median | Sigma |
| A | 13 | 254 | 22255 | 67.34 | 1522 | 1488 | 308.4 |
| A | 3 | 137 | 14861 | 43.36 | 1522 | 1488 | 308.4 |
| A | 8 | 192 | 13429 | 38.72 | 1522 | 1488 | 308.4 |
| B | 15 | 32 | 142336 | 483.75 | 1509 | 1466 | 291.2 |
| B | 3 | 64 | 108685 | 368.19 | 1509 | 1466 | 291.2 |
| B | 4 | 200 | 68190 | 229.13 | 1509 | 1466 | 291.2 |
| C | 2 | 16 | 348968 | 1015.6 | 1456 | 1463 | 342.2 |
| C | 14 | 238 | 235052 | 682.67 | 1456 | 1463 | 342.2 |
| C | 3 | 233 | 25685 | 70.79 | 1456 | 1463 | 342.2 |
| D | 1 | 52 | 5073105 | 14780.21 | 1442 | 1402 | 343.1 |
| D | 7 | 80 | 981398 | 2855.95 | 1442 | 1402 | 343.1 |
| D | 2 | 250 | 267863 | 776.53 | 1442 | 1402 | 343.1 |
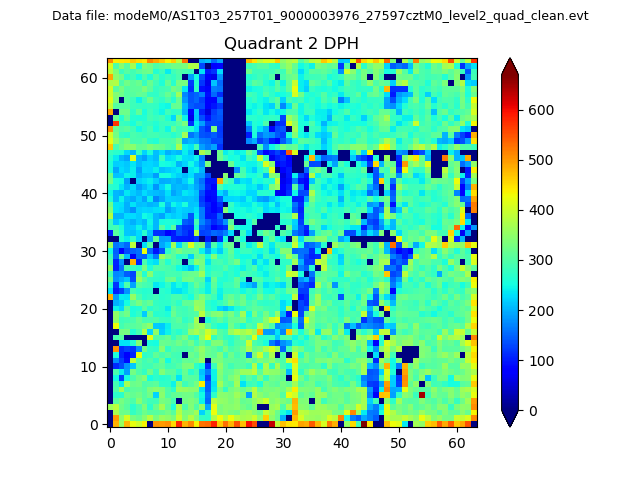
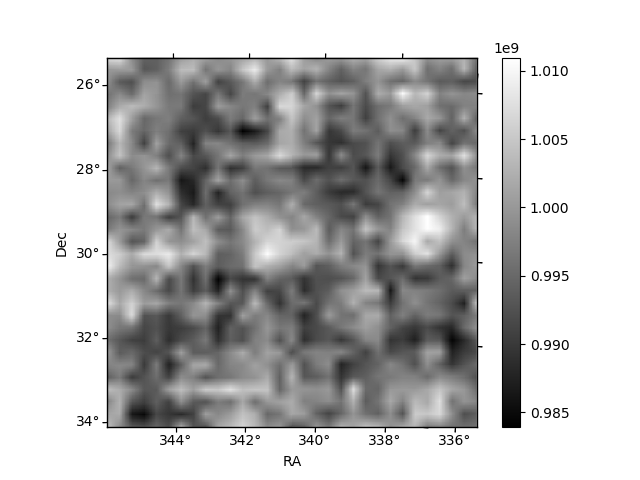
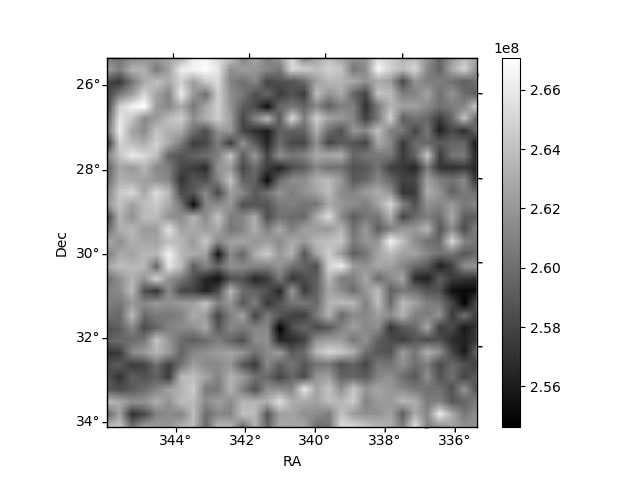
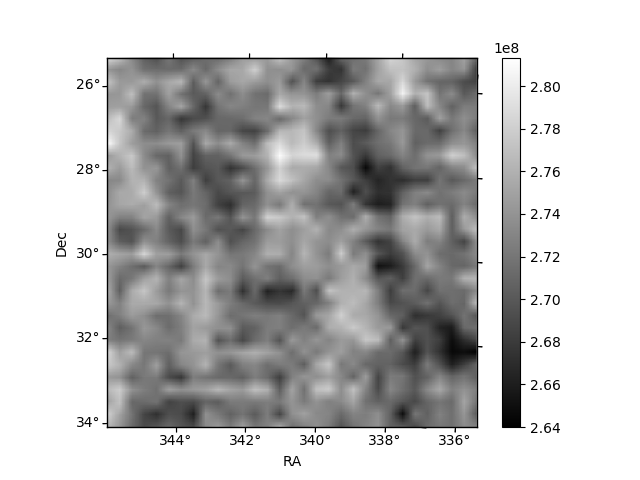
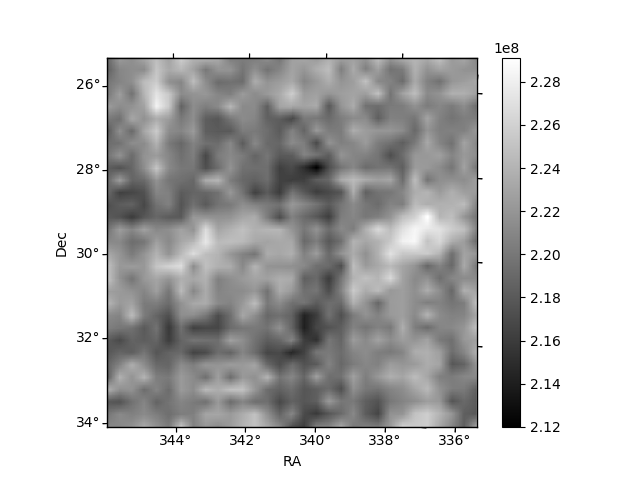
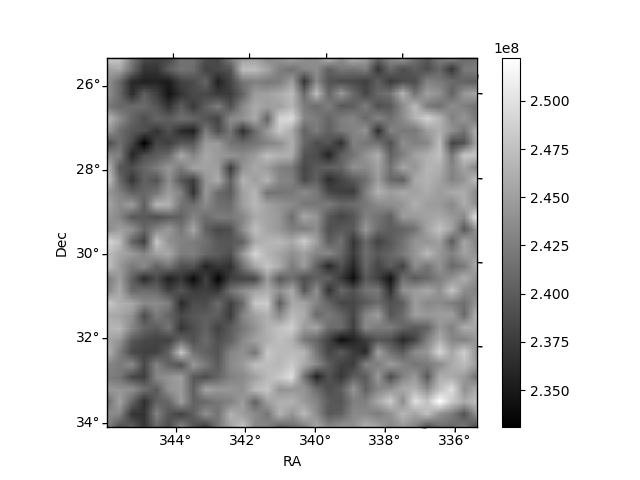
Histogram calculated using DETX and DETY for each event in the final _common_clean file
| Quadrant A | 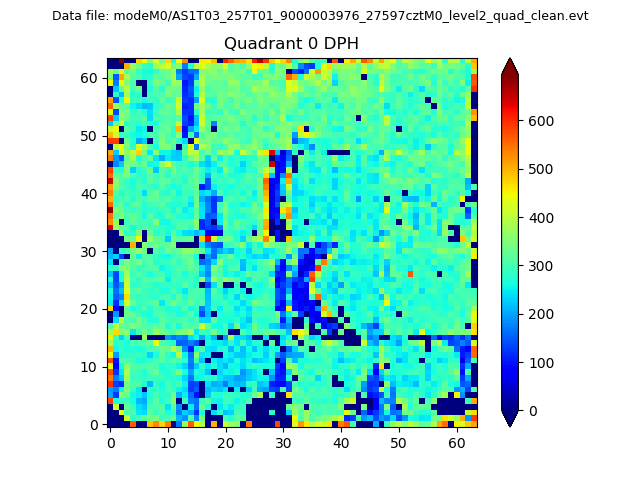 |
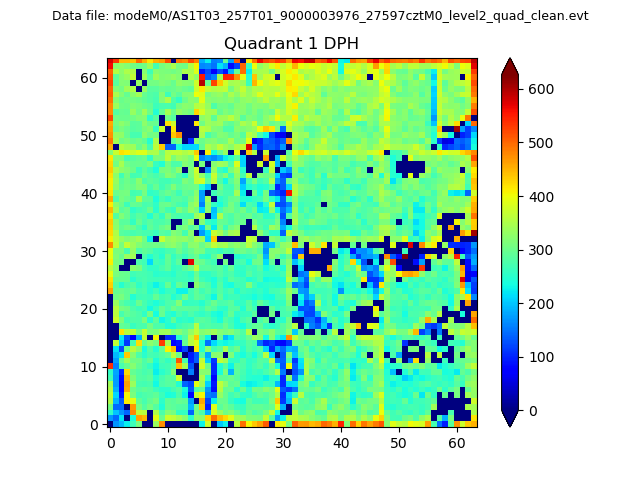 |
Quadrant B |
|---|---|---|---|
| Quadrant D | 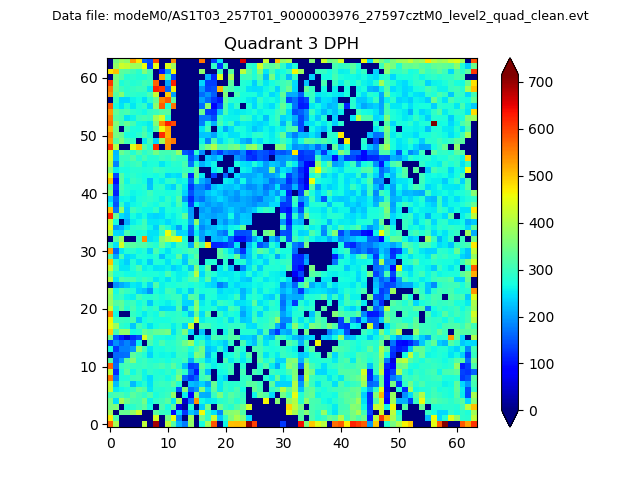 |
 |
Quadrant C |
| Plot type | Count rate plots | Images |
|---|---|---|
| Comparison with Poisson distribution Blue bars denote a histogram of data divided into 1 sec bins. Red curve is a Poisson curve with rate = median count rate of data. |
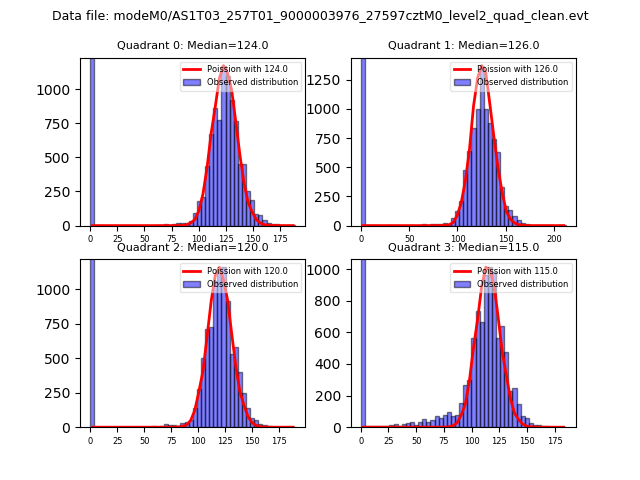 |
 |
| Quadrant-wise count rates Data is divided into 100 sec bins |
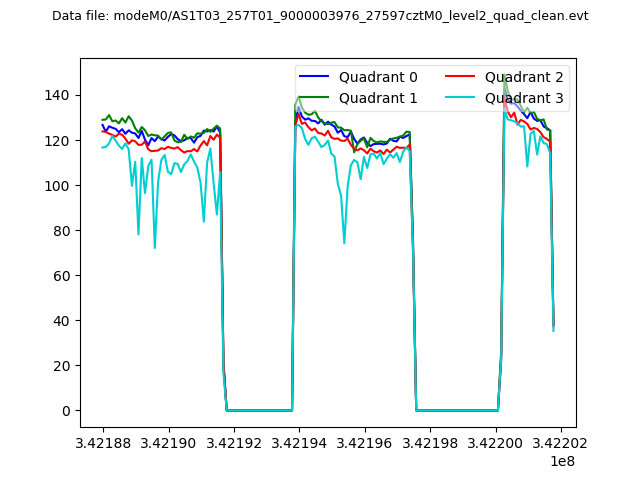 |
|
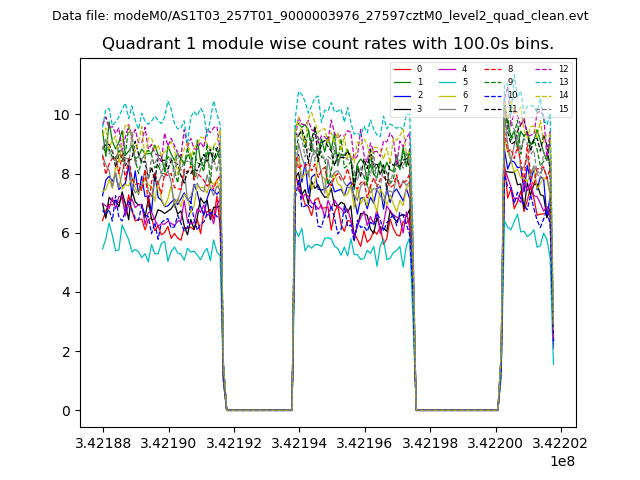
| Module-wise count rates for Quadrant A Data is divided into 100 sec bins |
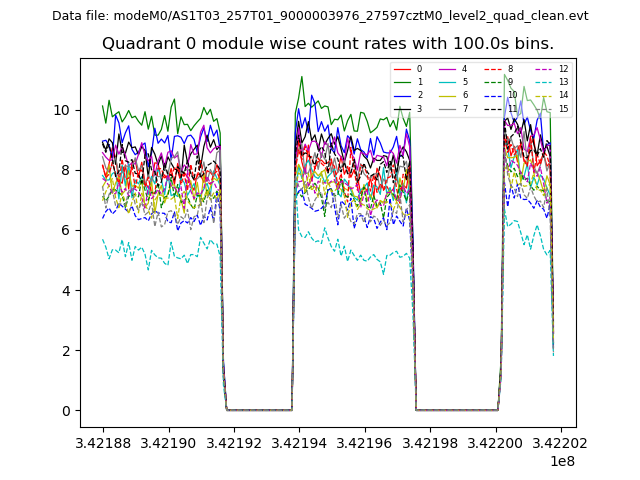 |
 |
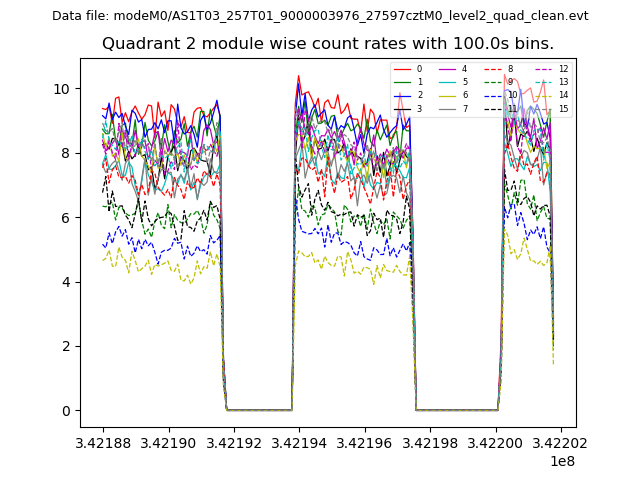
| Module-wise count rates for Quadrant B Data is divided into 100 sec bins |
 |
 |
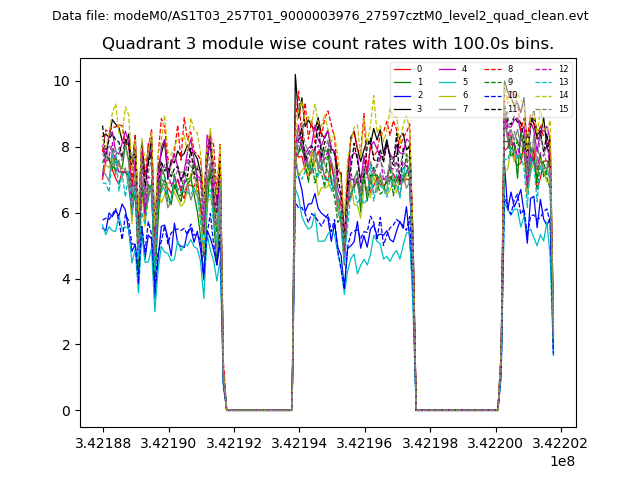
| Module-wise count rates for Quadrant C Data is divided into 100 sec bins |
 |
 |
| Module-wise count rates for Quadrant D Data is divided into 100 sec bins |
 |
 |
| Parameter | Plot |
|---|---|
| CZT HV Monitor | 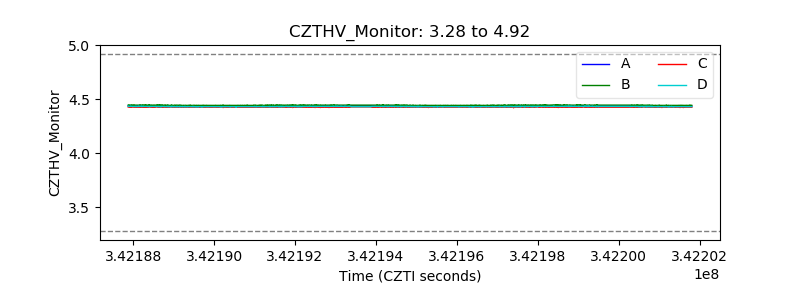 |
| D_VDD | 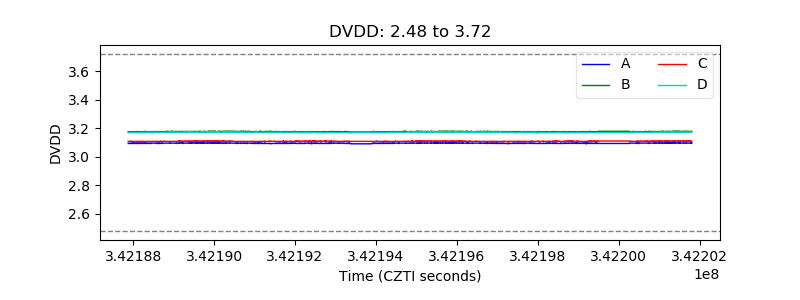 |
| Temperature 1 | 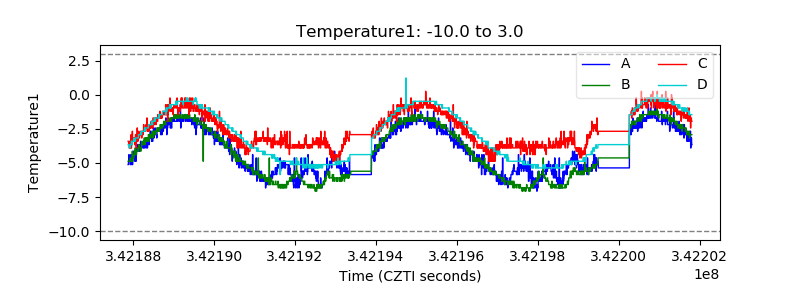 |
| Veto HV Monitor | 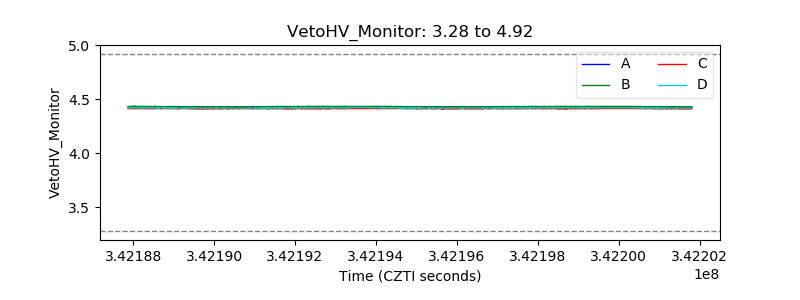 |
| Veto LLD | 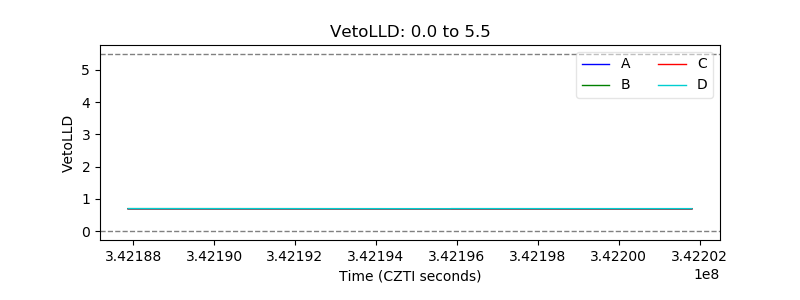 |
| Alpha Counter | 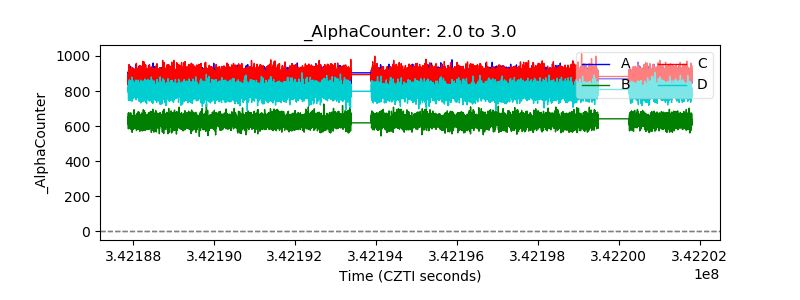 |
| _CPM_Rate | 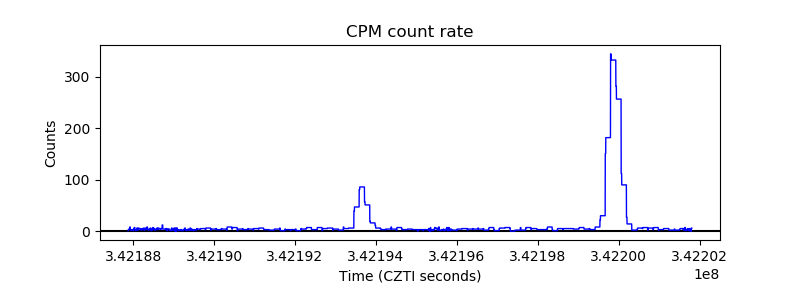 |
| CZT Counter | 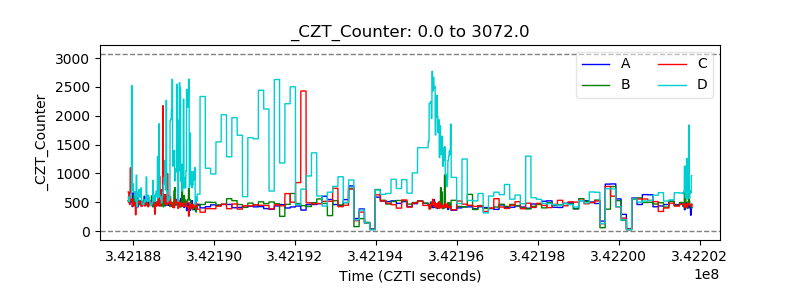 |
| +2.5 Volts monitor | 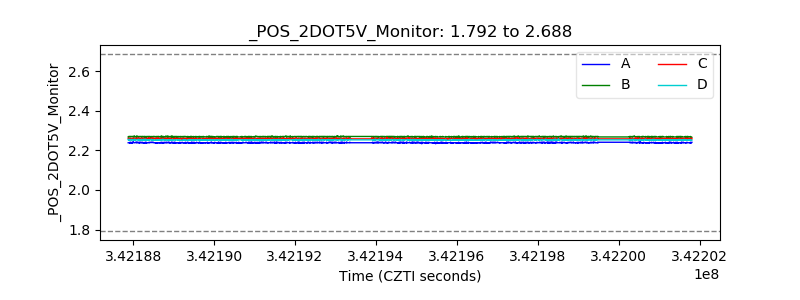 |
| +5 Volts monitor |  |
| _ROLL_ROT | 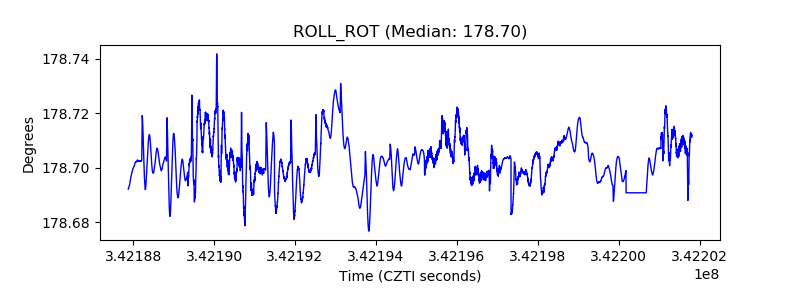 |
| _Roll_DEC | 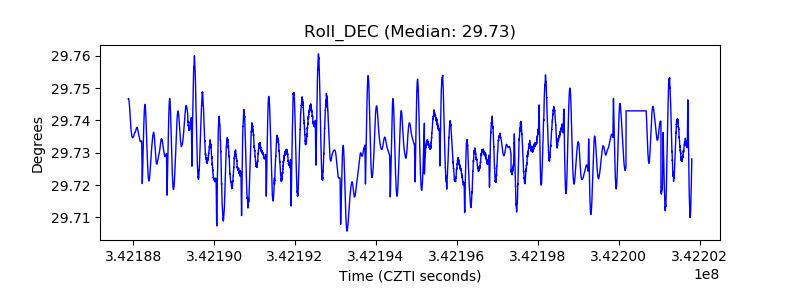 |
| _Roll_RA | 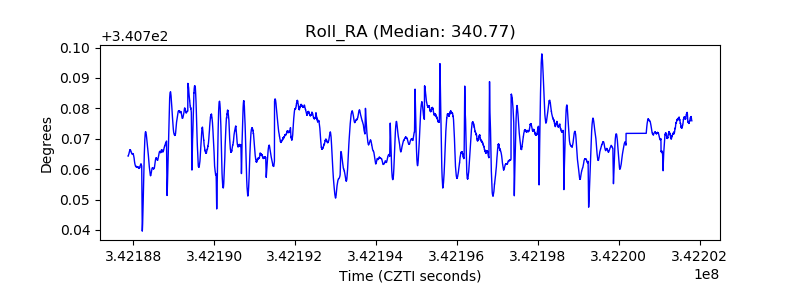 |
| Veto Counter | 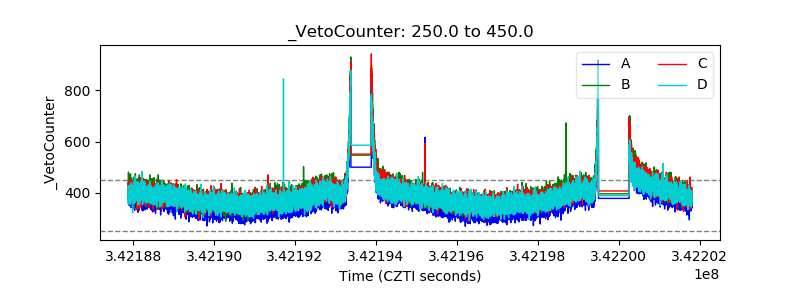 |