| Param | Original file | Final file |
|---|---|---|
| Filename | modeM0/AS1T03_257T01_9000003976_27601cztM0_level2.evt | modeM0/AS1T03_257T01_9000003976_27601cztM0_level2_quad_clean.evt |
| Size (bytes) | 518,500,800 | 93,818,880 |
| Size | 494.5 MB | 89.5 MB |
| Events in quadrant A | 3,080,692 | 611,906 |
| Events in quadrant B | 3,354,354 | 631,779 |
| Events in quadrant C | 3,319,121 | 594,372 |
| Events in quadrant D | 5,524,772 | 566,880 |
| Mode M9 | |||
|---|---|---|---|
| Quadrant | BADHDUFLAG | Total packets | Discarded packets |
| A | 0 | 23 | 0 |
| B | 0 | 23 | 0 |
| C | 0 | 23 | 0 |
| D | 0 | 23 | 0 |
| Mode M0 | |||
|---|---|---|---|
| Quadrant | BADHDUFLAG | Total packets | Discarded packets |
| A | 0 | 13219 | 0 |
| B | 0 | 14003 | 0 |
| C | 0 | 13735 | 0 |
| D | 0 | 20679 | 0 |
| Quadrant | Total seconds | Saturated seconds | Saturation percentage |
|---|---|---|---|
| A | 6245 | 48 | 0.768615% |
| B | 6246 | 66 | 1.056676% |
| C | 6246 | 82 | 1.312840% |
| D | 6246 | 675 | 10.806916% |
Noise dominated data is calculated using 1-second bins in cleaned event files. If a bin has >2000 counts, and if more than 50% of those come from <1% of pixels, then it is considered to be noise-dominated and hence unusable.
| Quadrant | # 1 sec bins | Bins with >0 counts | Bins with >2000 counts | High rate bins dominated by noise | Noise dominated (total time) | Noise dominated (detector-on time) | Marked lightcurve |
|---|---|---|---|---|---|---|---|
| A | 8530 | 6247 | 5 | 5 | 0.06% | 0.08% |  |
| B | 8531 | 6248 | 9 | 9 | 0.11% | 0.14% | 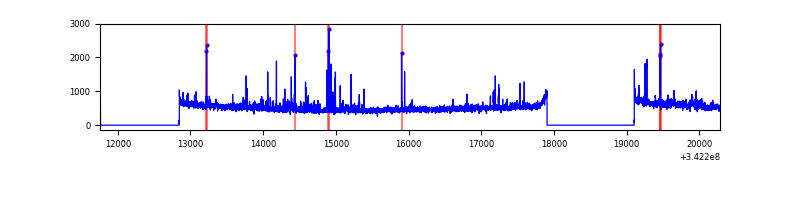 |
| C | 8531 | 6248 | 9 | 9 | 0.11% | 0.14% | 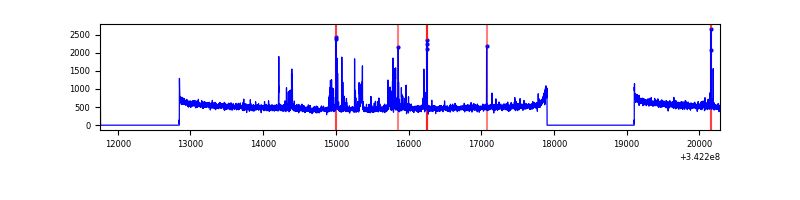 |
| D | 8531 | 6248 | 693 | 693 | 8.12% | 11.09% | 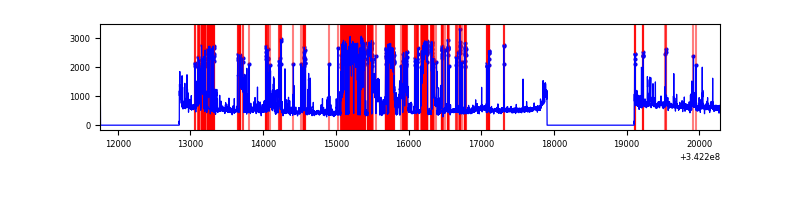 |
Top three noisy pixels from each quadrant. If the there are fewer than three noisy pixels in the level2.evt file, extra rows are filled as -1
| Pixel properties | Quadrant properties | ||||||
|---|---|---|---|---|---|---|---|
| Quadrant | DetID | PixID | Counts | Sigma | Mean | Median | Sigma |
| A | 8 | 192 | 14751 | 88.27 | 793 | 779 | 158.3 |
| A | 13 | 254 | 11291 | 66.41 | 793 | 779 | 158.3 |
| A | 3 | 137 | 7362 | 41.59 | 793 | 779 | 158.3 |
| B | 3 | 64 | 99197 | 661.62 | 797 | 778 | 148.8 |
| B | 0 | 230 | 58196 | 385.99 | 797 | 778 | 148.8 |
| B | 10 | 245 | 51159 | 338.68 | 797 | 778 | 148.8 |
| C | 2 | 16 | 179036 | 1002.41 | 766 | 770 | 177.8 |
| C | 14 | 238 | 122961 | 687.09 | 766 | 770 | 177.8 |
| C | 15 | 208 | 11297 | 59.19 | 766 | 770 | 177.8 |
| D | 1 | 52 | 2395505 | 13422.58 | 744 | 723 | 178.4 |
| D | 6 | 112 | 155737 | 868.84 | 744 | 723 | 178.4 |
| D | 2 | 250 | 72902 | 404.56 | 744 | 723 | 178.4 |
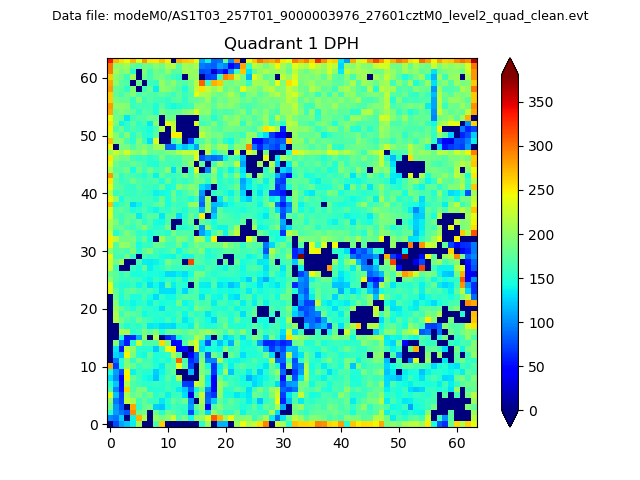
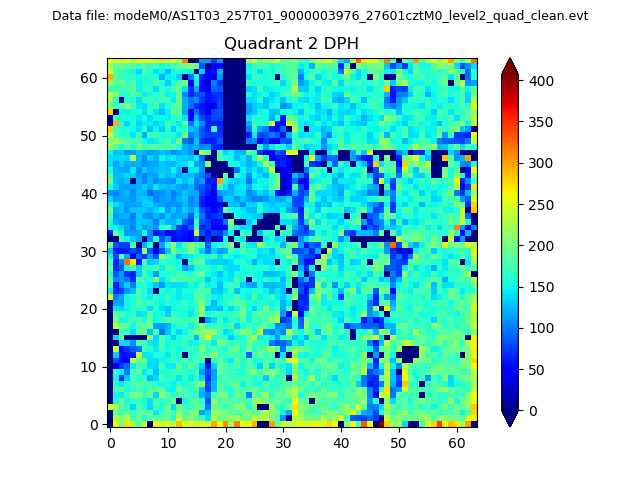
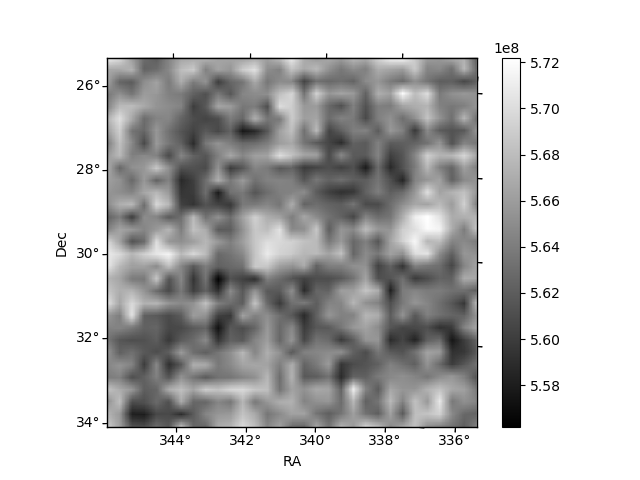
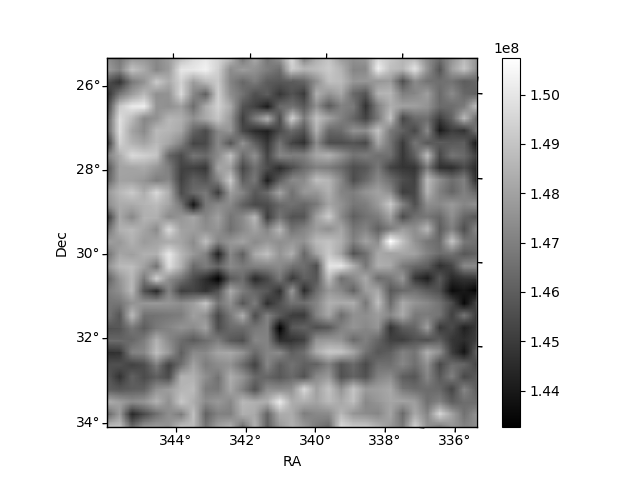
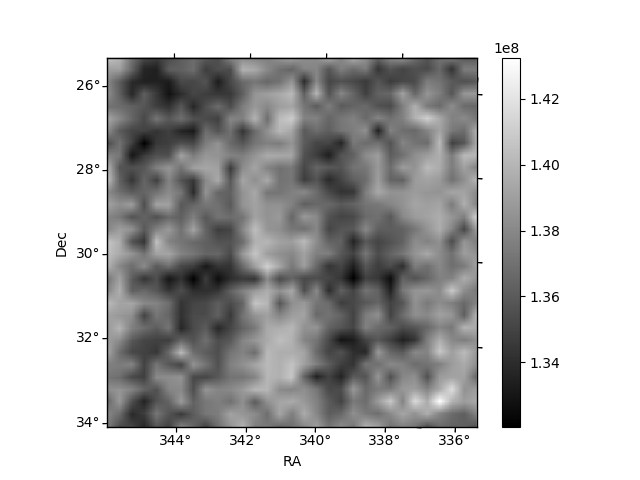
Histogram calculated using DETX and DETY for each event in the final _common_clean file
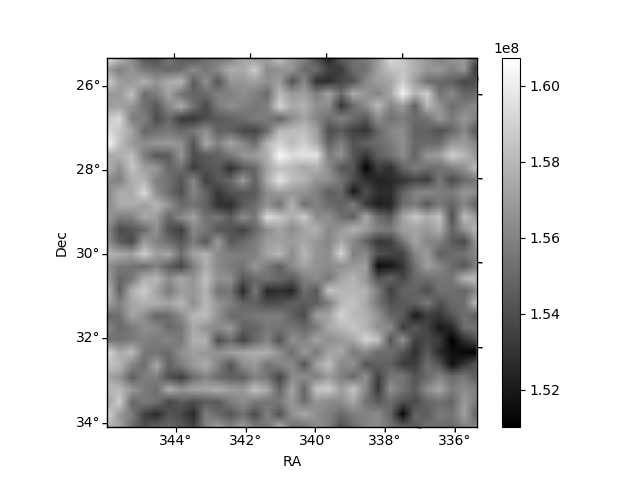
| Quadrant A | 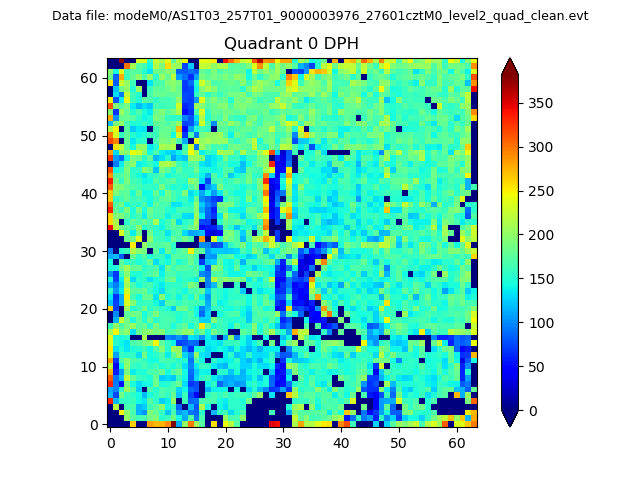 |
 |
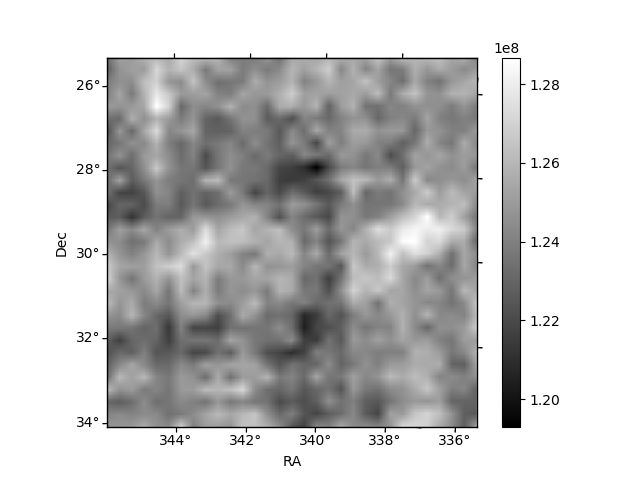
Quadrant B |
|---|---|---|---|
| Quadrant D | 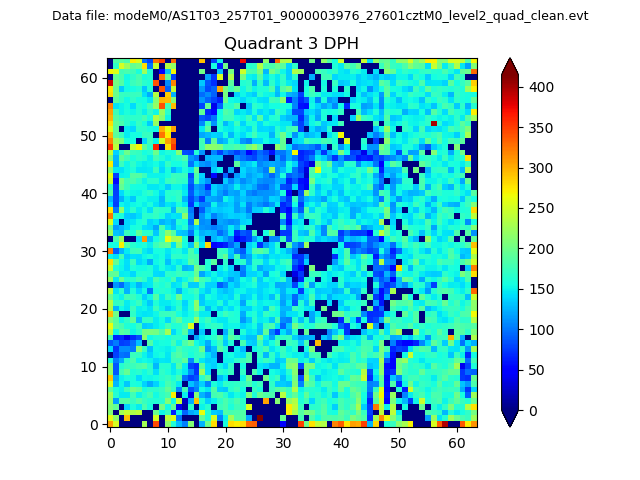 |
 |
Quadrant C |
| Plot type | Count rate plots | Images |
|---|---|---|
| Comparison with Poisson distribution Blue bars denote a histogram of data divided into 1 sec bins. Red curve is a Poisson curve with rate = median count rate of data. |
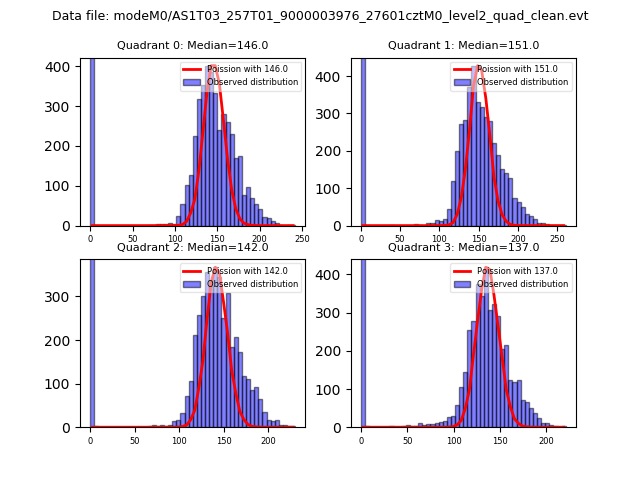 |
 |
| Quadrant-wise count rates Data is divided into 100 sec bins |
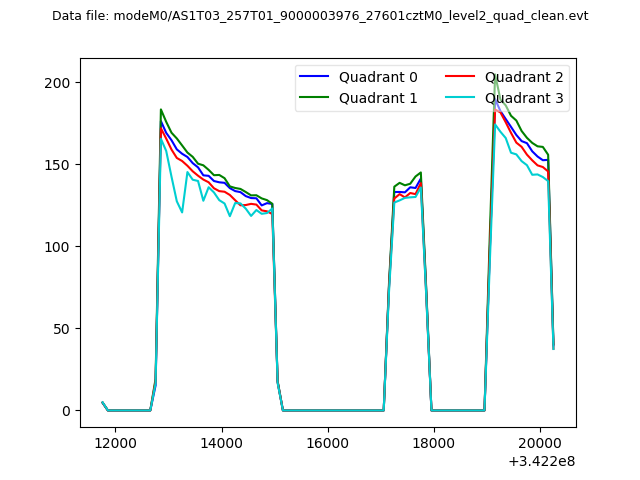 |
|
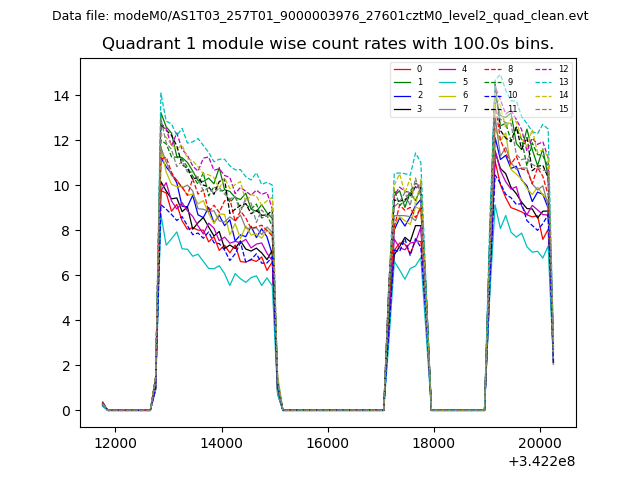
| Module-wise count rates for Quadrant A Data is divided into 100 sec bins |
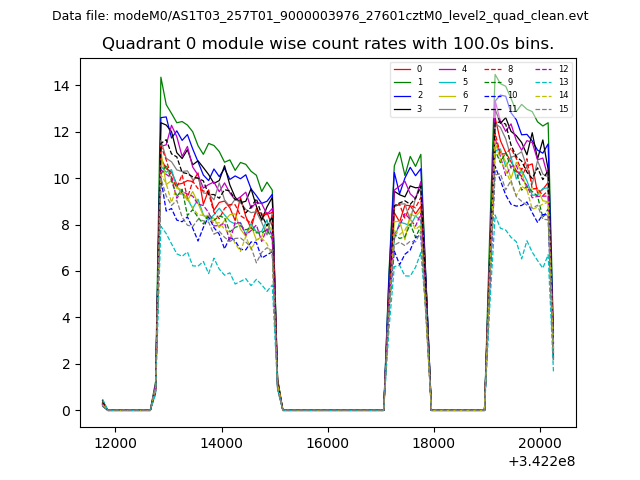 |
 |
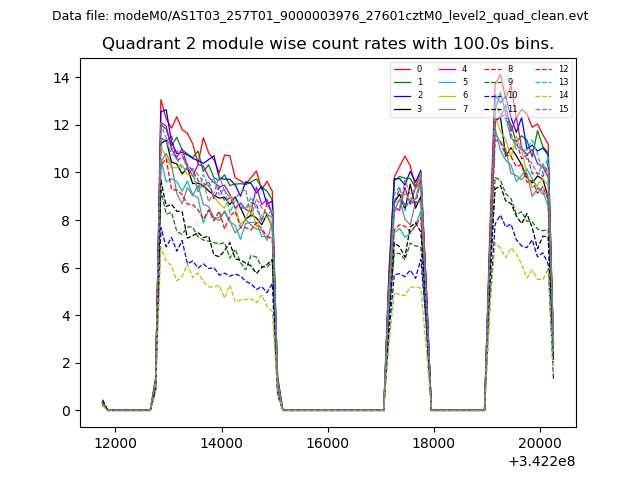
| Module-wise count rates for Quadrant B Data is divided into 100 sec bins |
 |
 |
| Module-wise count rates for Quadrant C Data is divided into 100 sec bins |
 |
 |
| Module-wise count rates for Quadrant D Data is divided into 100 sec bins |
 |
 |
| Parameter | Plot |
|---|---|
| CZT HV Monitor | 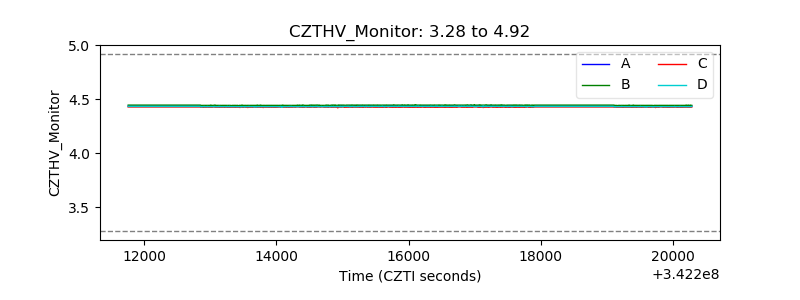 |
| D_VDD | 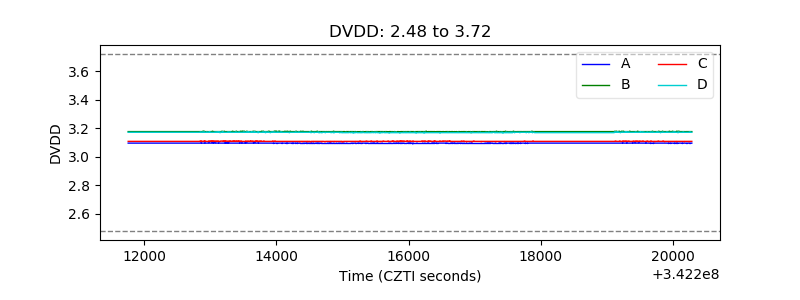 |
| Temperature 1 |  |
| Veto HV Monitor | 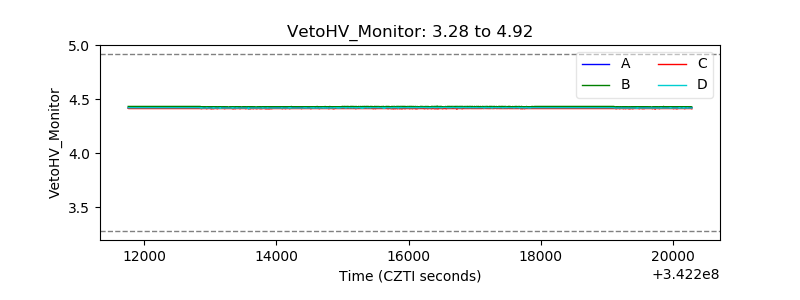 |
| Veto LLD | 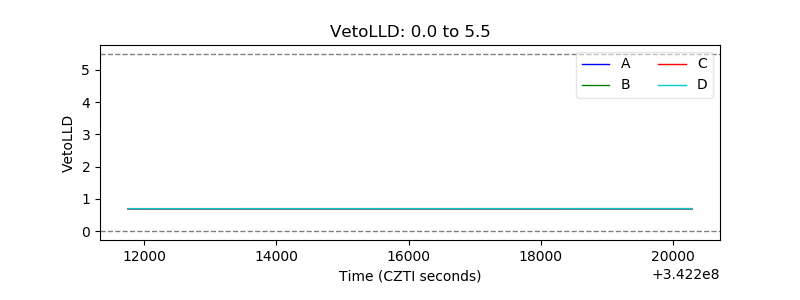 |
| Alpha Counter | 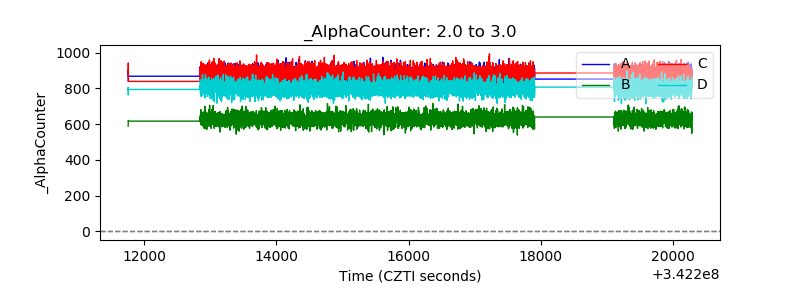 |
| _CPM_Rate | 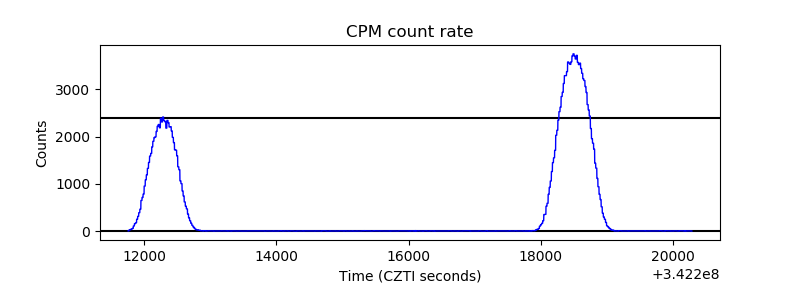 |
| CZT Counter |  |
| +2.5 Volts monitor |  |
| +5 Volts monitor | 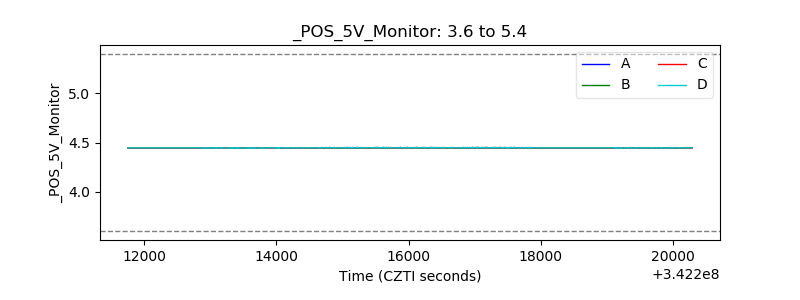 |
| _ROLL_ROT | 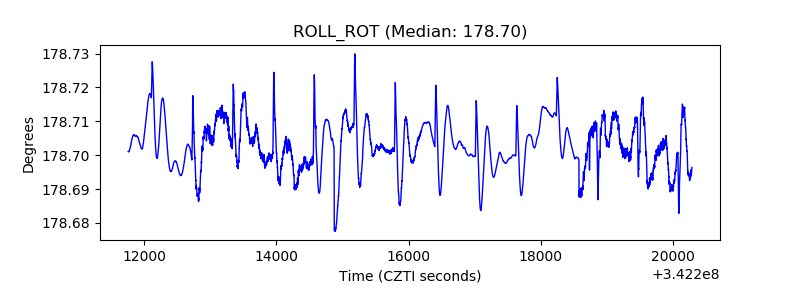 |
| _Roll_DEC | 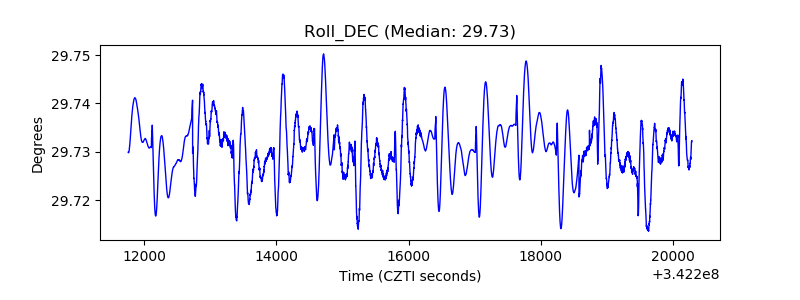 |
| _Roll_RA |  |
| Veto Counter | 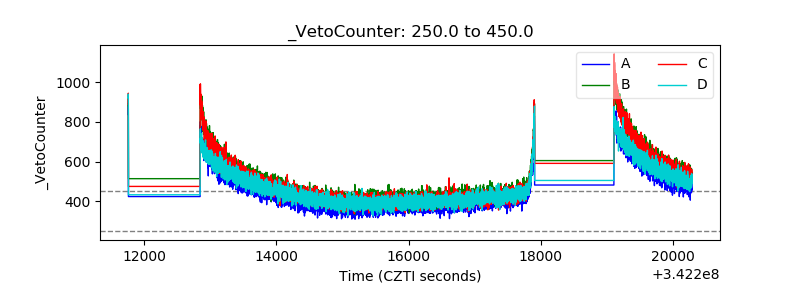 |