| Param | Original file | Final file |
|---|---|---|
| Filename | modeM0/AS1T03_257T01_9000003976_27602cztM0_level2.evt | modeM0/AS1T03_257T01_9000003976_27602cztM0_level2_quad_clean.evt |
| Size (bytes) | 472,265,280 | 98,784,000 |
| Size | 450.4 MB | 94.2 MB |
| Events in quadrant A | 3,163,937 | 650,010 |
| Events in quadrant B | 3,434,934 | 675,812 |
| Events in quadrant C | 3,273,274 | 631,635 |
| Events in quadrant D | 4,009,284 | 600,990 |
| Mode M9 | |||
|---|---|---|---|
| Quadrant | BADHDUFLAG | Total packets | Discarded packets |
| A | 0 | 18 | 0 |
| B | 0 | 19 | 0 |
| C | 0 | 19 | 0 |
| D | 0 | 19 | 0 |
| Mode M0 | |||
|---|---|---|---|
| Quadrant | BADHDUFLAG | Total packets | Discarded packets |
| A | 0 | 13246 | 0 |
| B | 0 | 14225 | 0 |
| C | 0 | 13590 | 0 |
| D | 0 | 16066 | 0 |
| Quadrant | Total seconds | Saturated seconds | Saturation percentage |
|---|---|---|---|
| A | 6207 | 33 | 0.531658% |
| B | 6207 | 58 | 0.934429% |
| C | 6207 | 80 | 1.288867% |
| D | 6207 | 97 | 1.562752% |
Noise dominated data is calculated using 1-second bins in cleaned event files. If a bin has >2000 counts, and if more than 50% of those come from <1% of pixels, then it is considered to be noise-dominated and hence unusable.
| Quadrant | # 1 sec bins | Bins with >0 counts | Bins with >2000 counts | High rate bins dominated by noise | Noise dominated (total time) | Noise dominated (detector-on time) | Marked lightcurve |
|---|---|---|---|---|---|---|---|
| A | 7502 | 6208 | 5 | 5 | 0.07% | 0.08% | 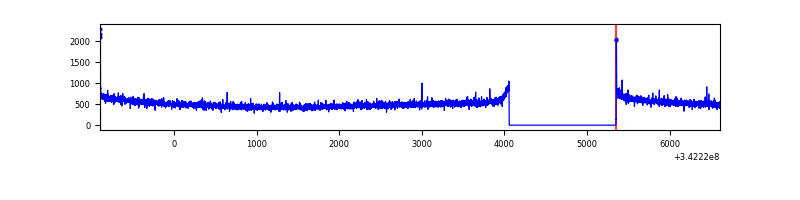 |
| B | 7502 | 6208 | 9 | 9 | 0.12% | 0.14% | 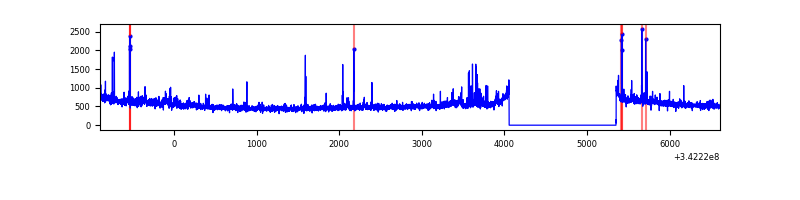 |
| C | 7502 | 6208 | 2 | 2 | 0.03% | 0.03% | 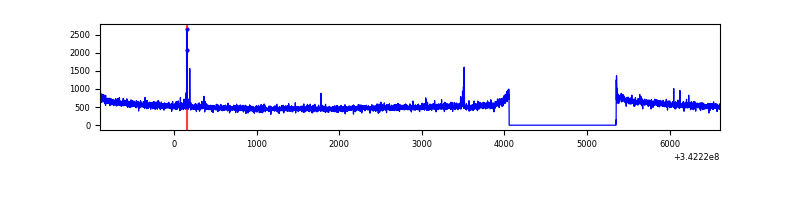 |
| D | 7502 | 6208 | 83 | 83 | 1.11% | 1.34% | 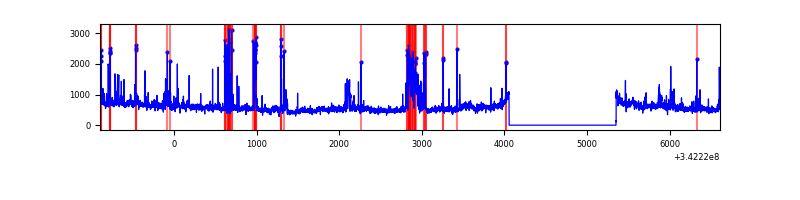 |
Top three noisy pixels from each quadrant. If the there are fewer than three noisy pixels in the level2.evt file, extra rows are filled as -1
| Pixel properties | Quadrant properties | ||||||
|---|---|---|---|---|---|---|---|
| Quadrant | DetID | PixID | Counts | Sigma | Mean | Median | Sigma |
| A | 8 | 192 | 14816 | 85.9 | 816 | 799 | 163.2 |
| A | 13 | 254 | 10961 | 62.28 | 816 | 799 | 163.2 |
| A | 3 | 137 | 7506 | 41.1 | 816 | 799 | 163.2 |
| B | 10 | 245 | 67717 | 436.72 | 823 | 805 | 153.2 |
| B | 0 | 230 | 49508 | 317.87 | 823 | 805 | 153.2 |
| B | 3 | 64 | 45949 | 294.65 | 823 | 805 | 153.2 |
| C | 14 | 238 | 128527 | 693.4 | 793 | 800 | 184.2 |
| C | 2 | 16 | 15585 | 80.26 | 793 | 800 | 184.2 |
| C | 1 | 16 | 14859 | 76.32 | 793 | 800 | 184.2 |
| D | 1 | 52 | 647924 | 3433.01 | 785 | 765 | 188.5 |
| D | 6 | 112 | 199757 | 1055.6 | 785 | 765 | 188.5 |
| D | 7 | 80 | 85462 | 449.3 | 785 | 765 | 188.5 |
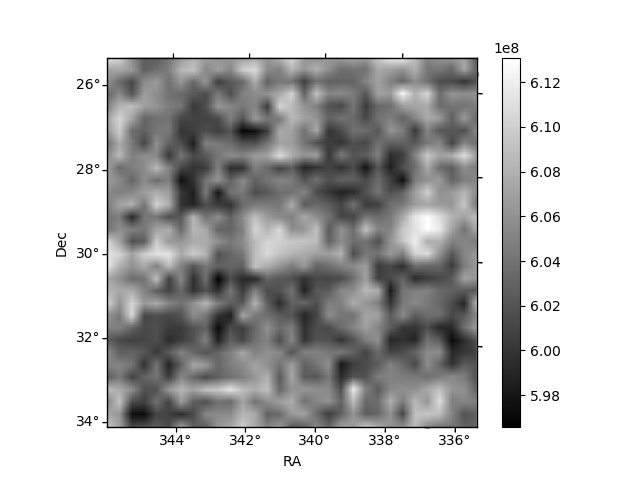
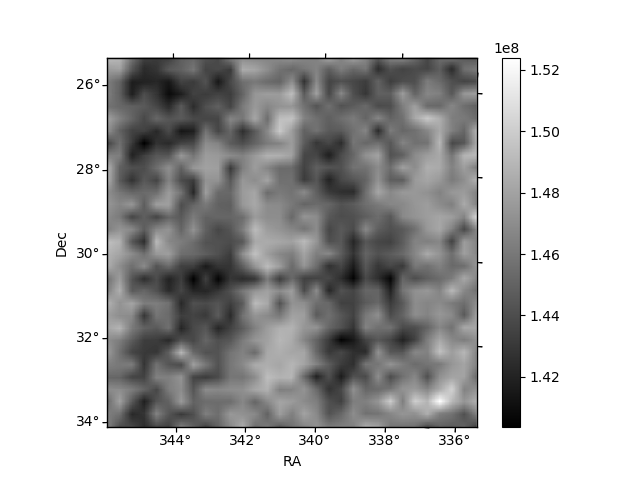
Histogram calculated using DETX and DETY for each event in the final _common_clean file
| Quadrant A | 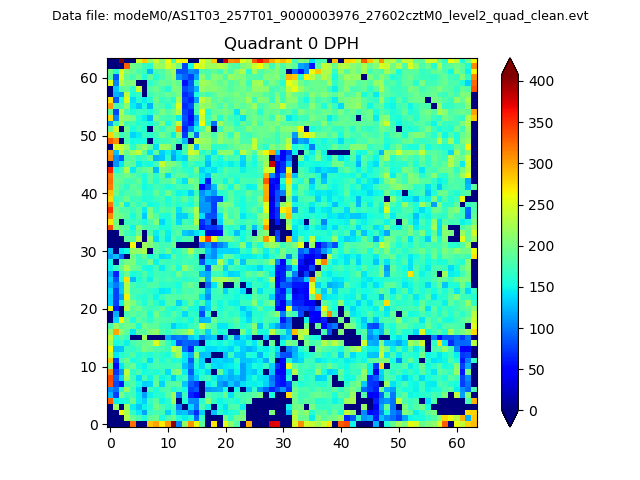 |
 |
Quadrant B |
|---|---|---|---|
| Quadrant D | 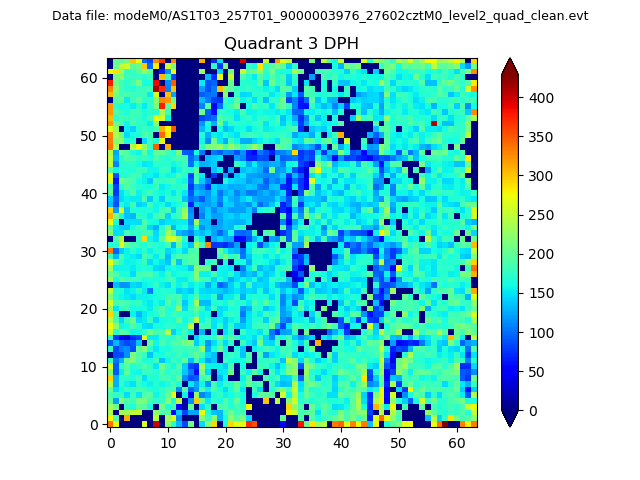 |
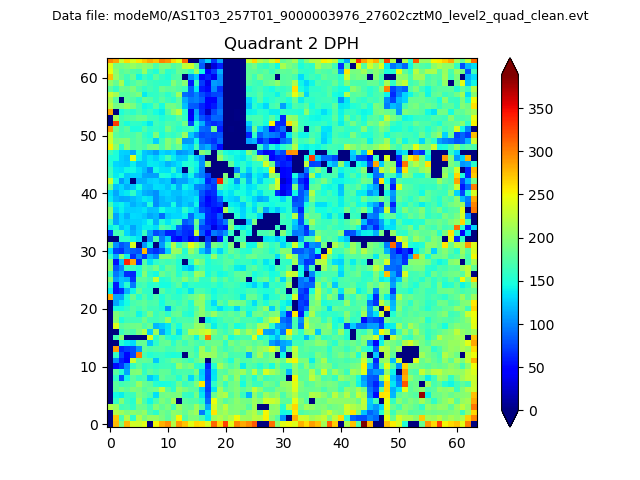 |
Quadrant C |
| Plot type | Count rate plots | Images |
|---|---|---|
| Comparison with Poisson distribution Blue bars denote a histogram of data divided into 1 sec bins. Red curve is a Poisson curve with rate = median count rate of data. |
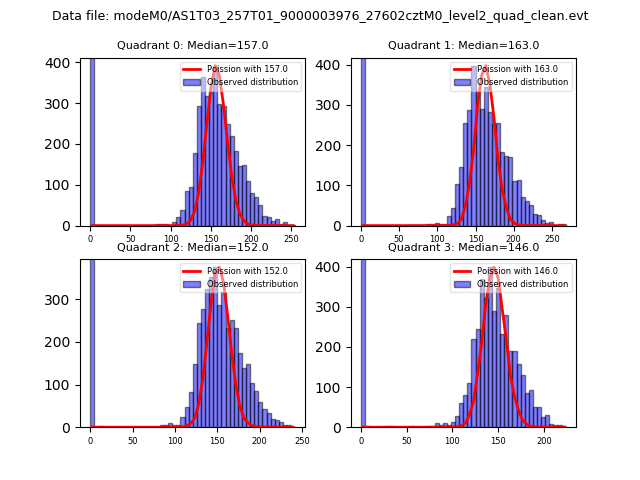 |
 |
| Quadrant-wise count rates Data is divided into 100 sec bins |
 |
|
| Module-wise count rates for Quadrant A Data is divided into 100 sec bins |
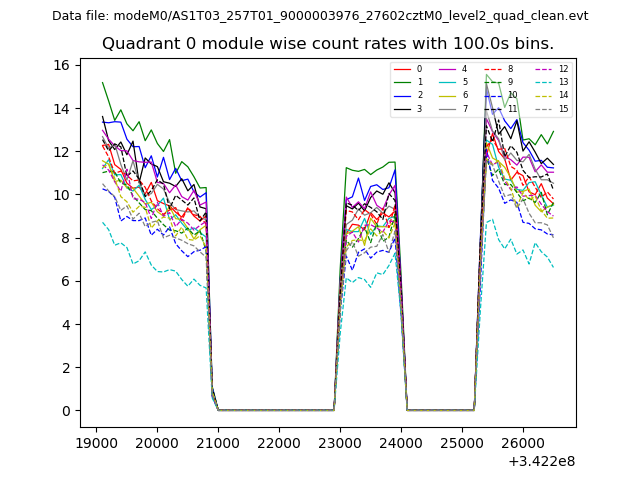 |
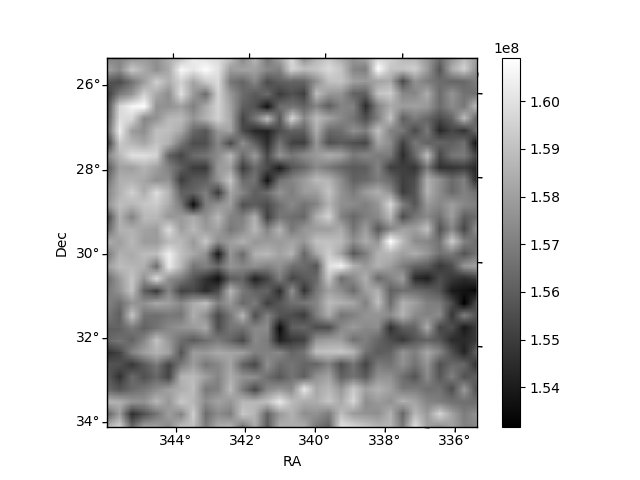 |
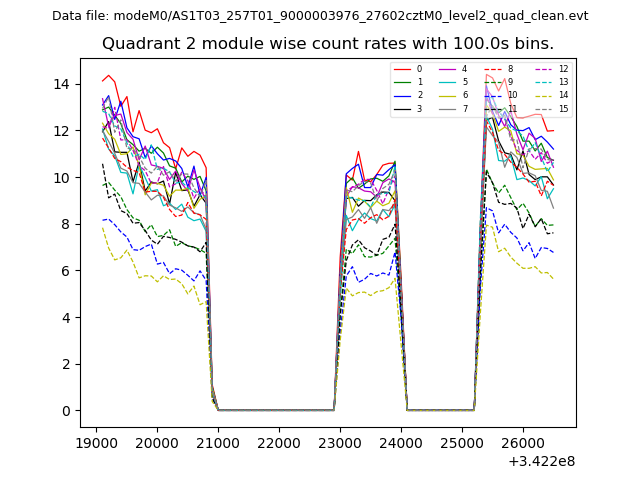
| Module-wise count rates for Quadrant B Data is divided into 100 sec bins |
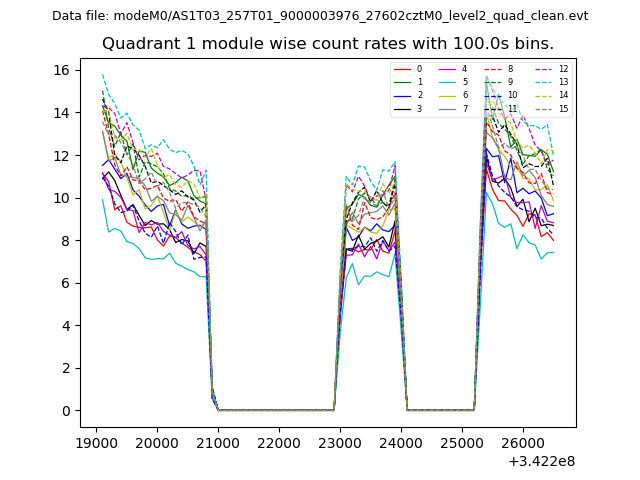 |
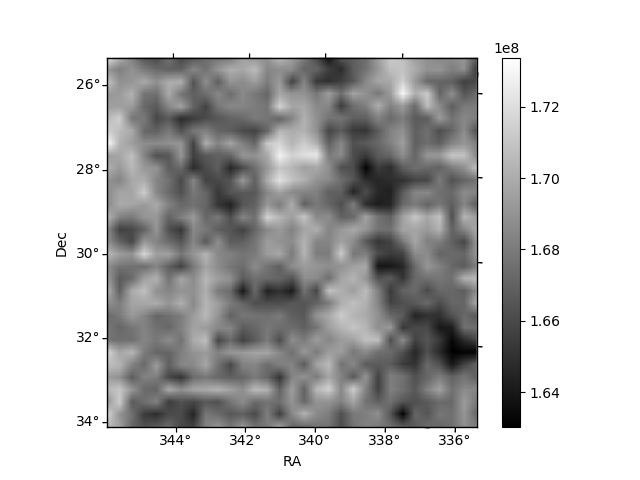 |
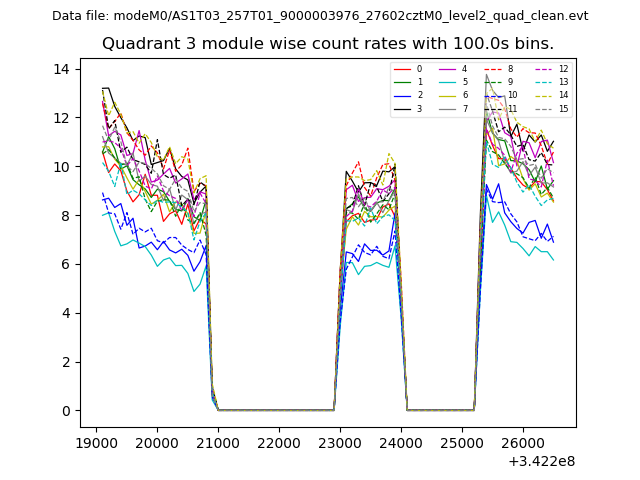
| Module-wise count rates for Quadrant C Data is divided into 100 sec bins |
 |
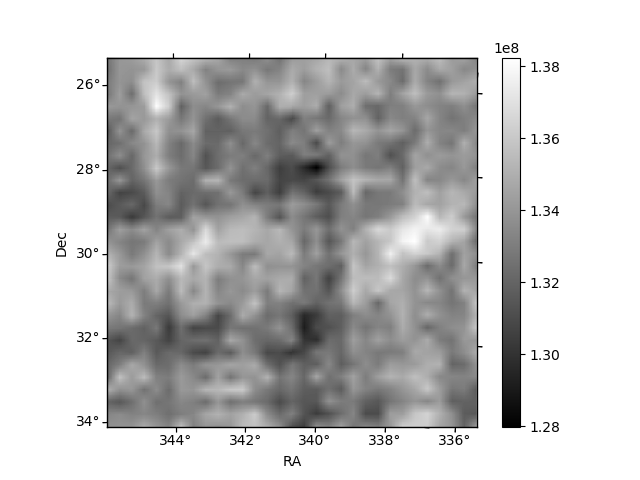 |
| Module-wise count rates for Quadrant D Data is divided into 100 sec bins |
 |
 |
| Parameter | Plot |
|---|---|
| CZT HV Monitor | 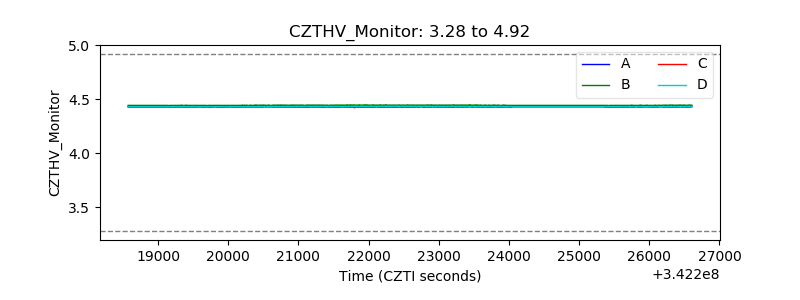 |
| D_VDD | 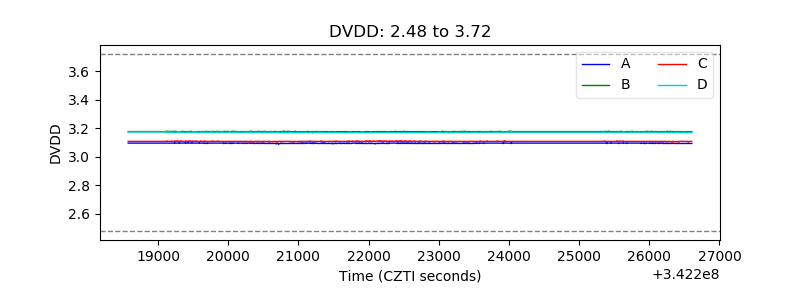 |
| Temperature 1 | 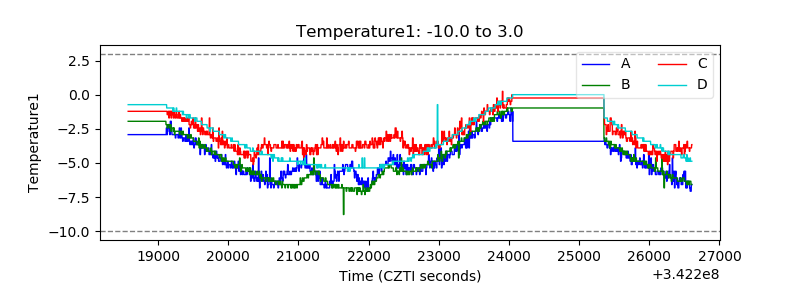 |
| Veto HV Monitor |  |
| Veto LLD | 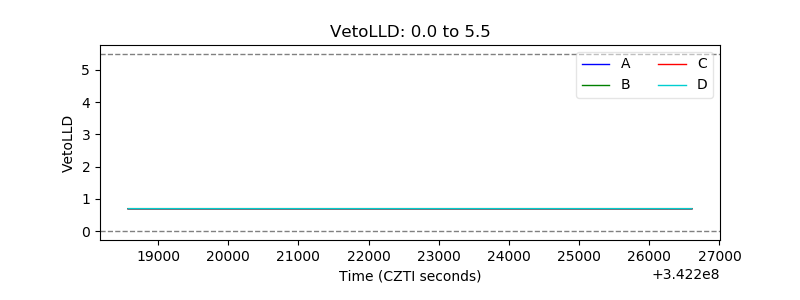 |
| Alpha Counter | 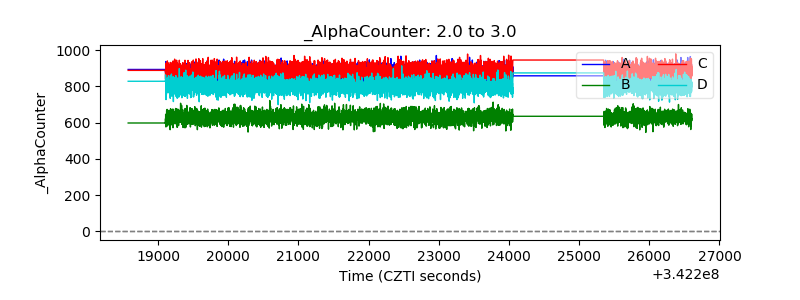 |
| _CPM_Rate | 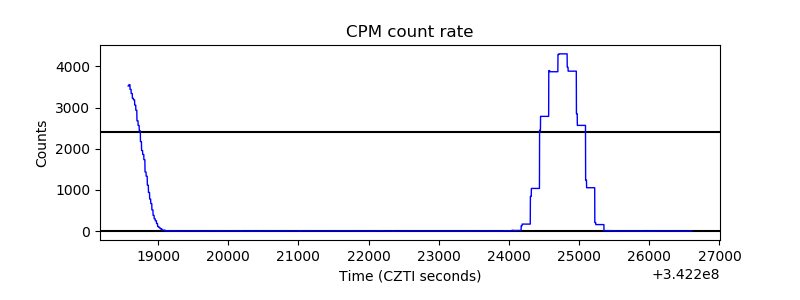 |
| CZT Counter | 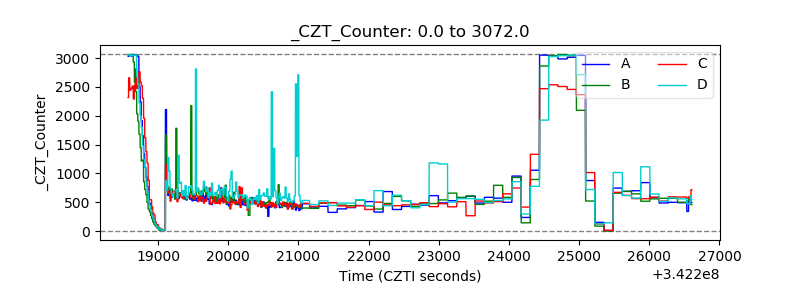 |
| +2.5 Volts monitor |  |
| +5 Volts monitor | 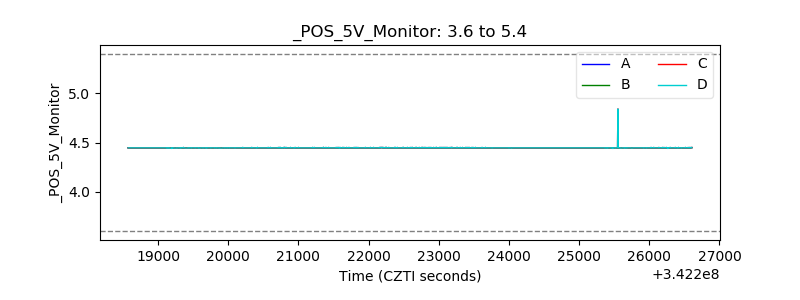 |
| _ROLL_ROT | 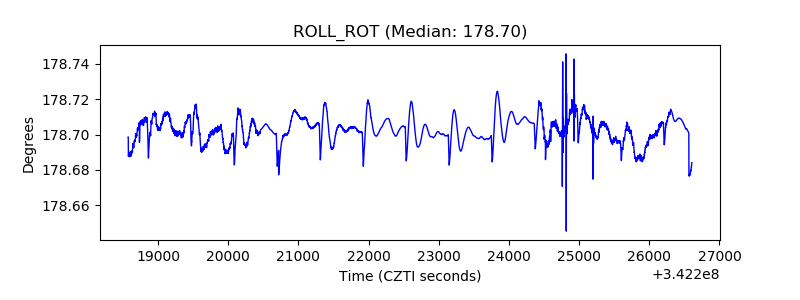 |
| _Roll_DEC | 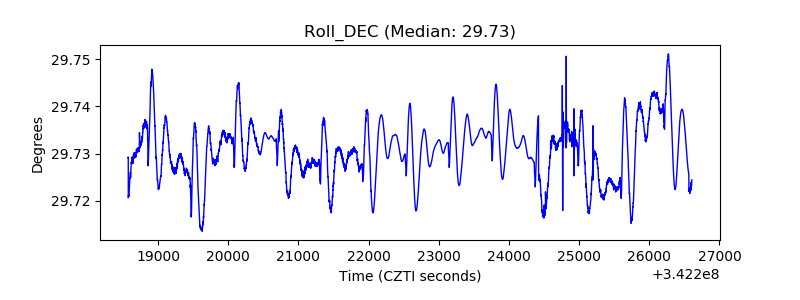 |
| _Roll_RA | 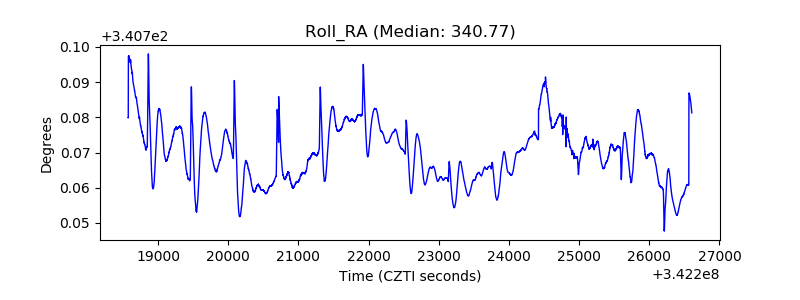 |
| Veto Counter | 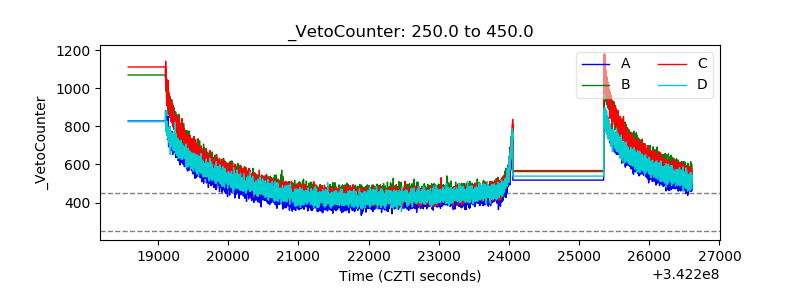 |