| Param | Original file | Final file |
|---|---|---|
| Filename | modeM0/AS1T03_257T01_9000003976_27603cztM0_level2.evt | modeM0/AS1T03_257T01_9000003976_27603cztM0_level2_quad_clean.evt |
| Size (bytes) | 488,240,640 | 92,917,440 |
| Size | 465.6 MB | 88.6 MB |
| Events in quadrant A | 3,146,944 | 611,233 |
| Events in quadrant B | 3,470,760 | 637,706 |
| Events in quadrant C | 3,225,175 | 592,745 |
| Events in quadrant D | 4,533,530 | 550,130 |
| Mode M9 | |||
|---|---|---|---|
| Quadrant | BADHDUFLAG | Total packets | Discarded packets |
| A | 0 | 24 | 0 |
| B | 0 | 25 | 0 |
| C | 0 | 25 | 0 |
| D | 0 | 25 | 0 |
| Mode M0 | |||
|---|---|---|---|
| Quadrant | BADHDUFLAG | Total packets | Discarded packets |
| A | 0 | 12974 | 0 |
| B | 0 | 14060 | 0 |
| C | 0 | 13228 | 0 |
| D | 0 | 17565 | 0 |
| Quadrant | Total seconds | Saturated seconds | Saturation percentage |
|---|---|---|---|
| A | 6040 | 24 | 0.397351% |
| B | 6040 | 86 | 1.423841% |
| C | 6040 | 73 | 1.208609% |
| D | 6039 | 347 | 5.745984% |
Noise dominated data is calculated using 1-second bins in cleaned event files. If a bin has >2000 counts, and if more than 50% of those come from <1% of pixels, then it is considered to be noise-dominated and hence unusable.
| Quadrant | # 1 sec bins | Bins with >0 counts | Bins with >2000 counts | High rate bins dominated by noise | Noise dominated (total time) | Noise dominated (detector-on time) | Marked lightcurve |
|---|---|---|---|---|---|---|---|
| A | 7445 | 6041 | 4 | 4 | 0.05% | 0.07% | 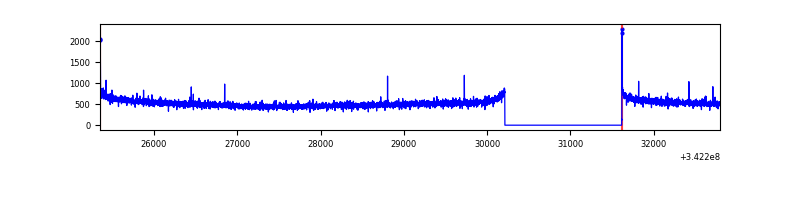 |
| B | 7445 | 6041 | 51 | 51 | 0.69% | 0.84% | 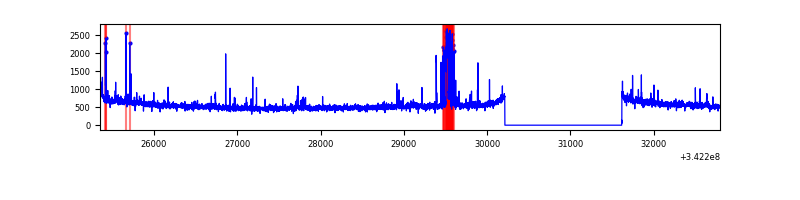 |
| C | 7445 | 6041 | 0 | 0 | 0.00% | 0.00% | 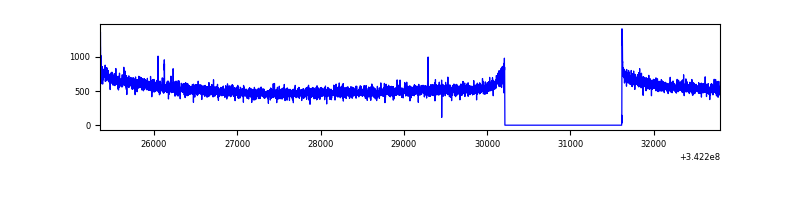 |
| D | 7444 | 6040 | 323 | 323 | 4.34% | 5.35% | 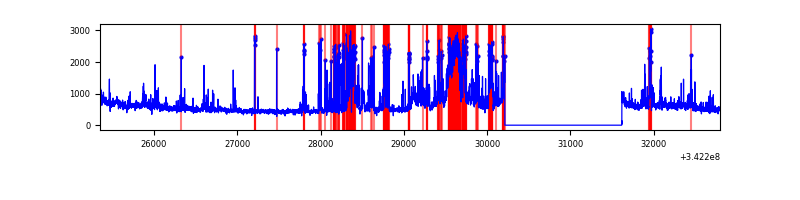 |
Top three noisy pixels from each quadrant. If the there are fewer than three noisy pixels in the level2.evt file, extra rows are filled as -1
| Pixel properties | Quadrant properties | ||||||
|---|---|---|---|---|---|---|---|
| Quadrant | DetID | PixID | Counts | Sigma | Mean | Median | Sigma |
| A | 8 | 192 | 14057 | 82.04 | 811 | 797 | 161.6 |
| A | 13 | 254 | 10238 | 58.41 | 811 | 797 | 161.6 |
| A | 3 | 137 | 7164 | 39.39 | 811 | 797 | 161.6 |
| B | 10 | 245 | 170027 | 1121.77 | 818 | 801 | 150.9 |
| B | 0 | 230 | 40147 | 260.81 | 818 | 801 | 150.9 |
| B | 3 | 64 | 22112 | 141.26 | 818 | 801 | 150.9 |
| C | 14 | 238 | 129016 | 700.95 | 785 | 793 | 182.9 |
| C | 1 | 16 | 14347 | 74.09 | 785 | 793 | 182.9 |
| C | 9 | 15 | 13503 | 69.48 | 785 | 793 | 182.9 |
| D | 7 | 80 | 1230404 | 6771.85 | 762 | 743 | 181.6 |
| D | 1 | 52 | 239504 | 1314.88 | 762 | 743 | 181.6 |
| D | 2 | 250 | 106738 | 583.72 | 762 | 743 | 181.6 |
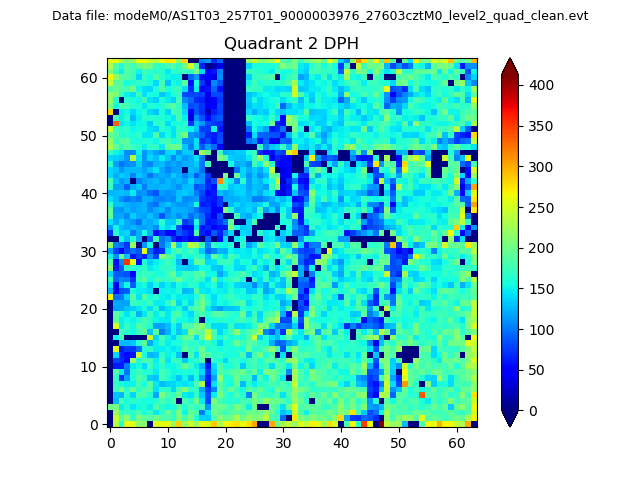
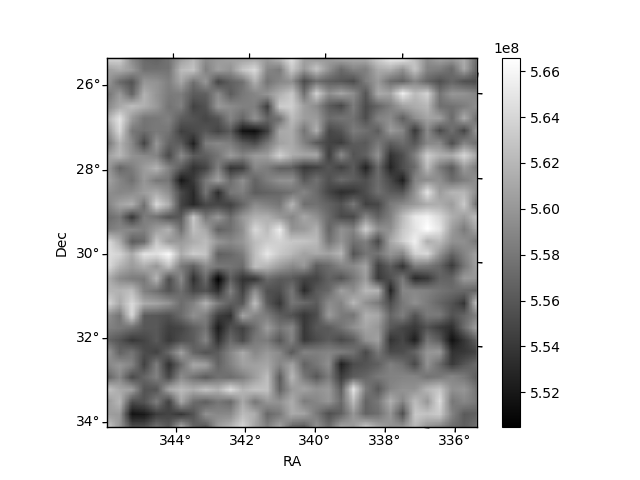
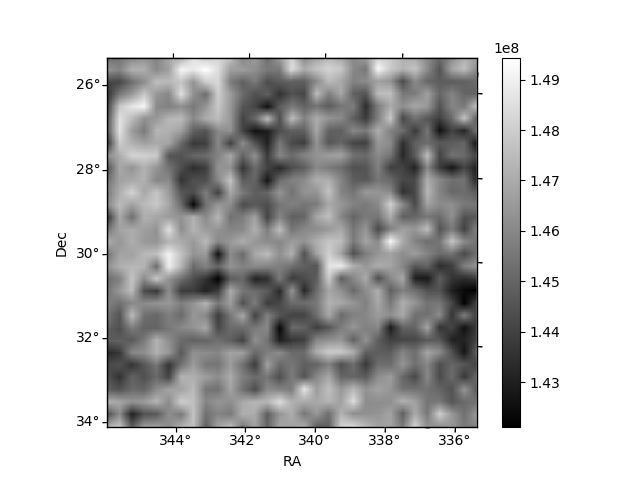
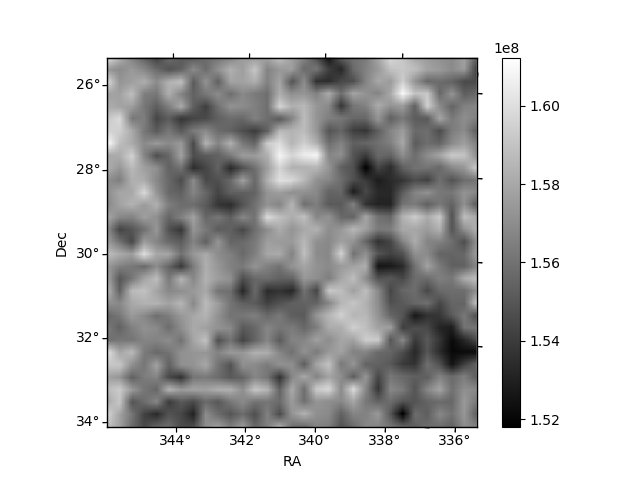
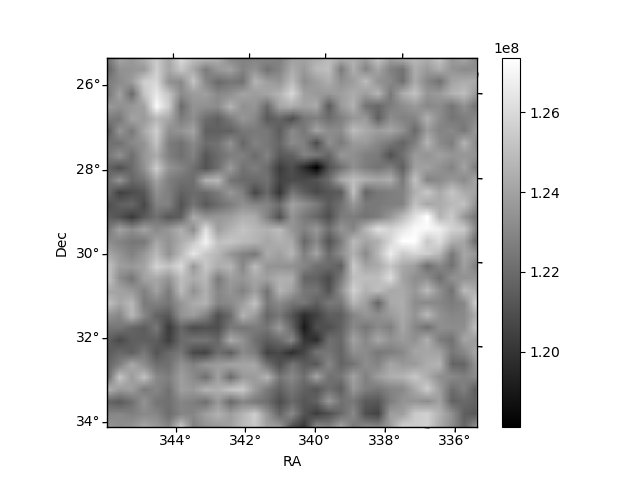
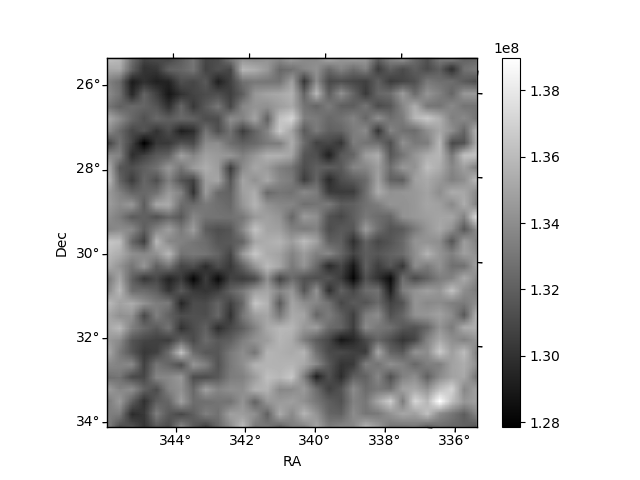
Histogram calculated using DETX and DETY for each event in the final _common_clean file
| Quadrant A | 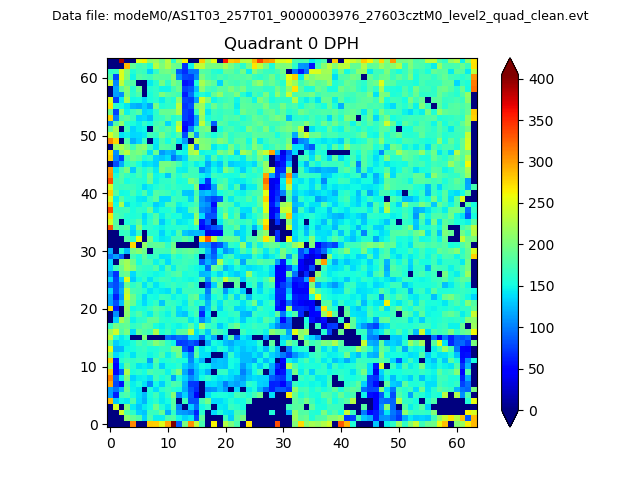 |
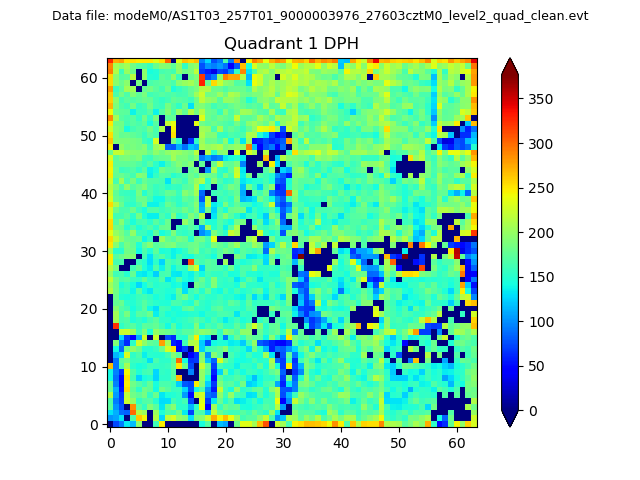 |
Quadrant B |
|---|---|---|---|
| Quadrant D | 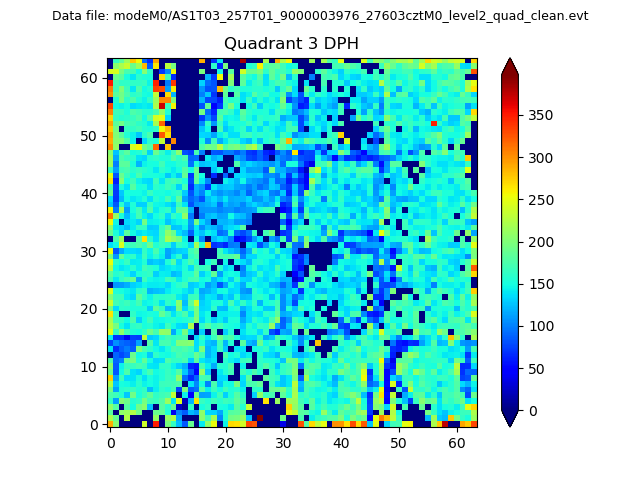 |
 |
Quadrant C |
| Plot type | Count rate plots | Images |
|---|---|---|
| Comparison with Poisson distribution Blue bars denote a histogram of data divided into 1 sec bins. Red curve is a Poisson curve with rate = median count rate of data. |
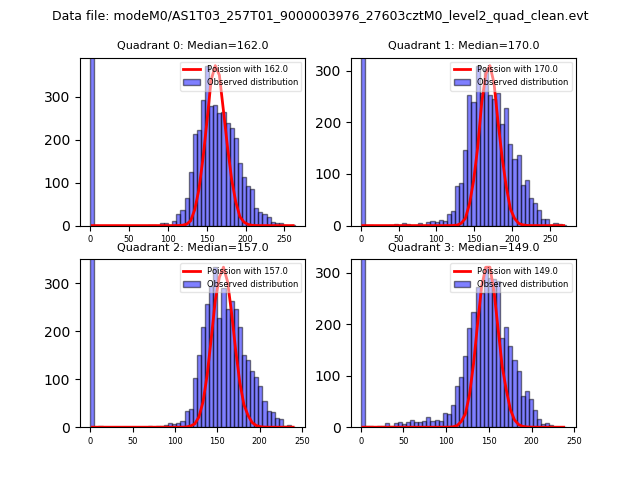 |
 |
| Quadrant-wise count rates Data is divided into 100 sec bins |
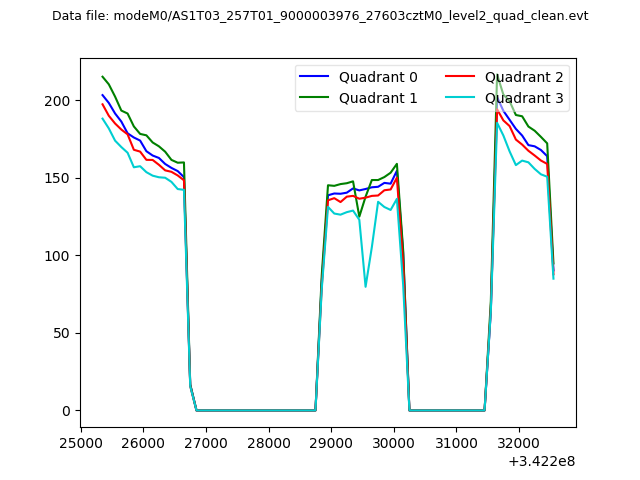 |
|
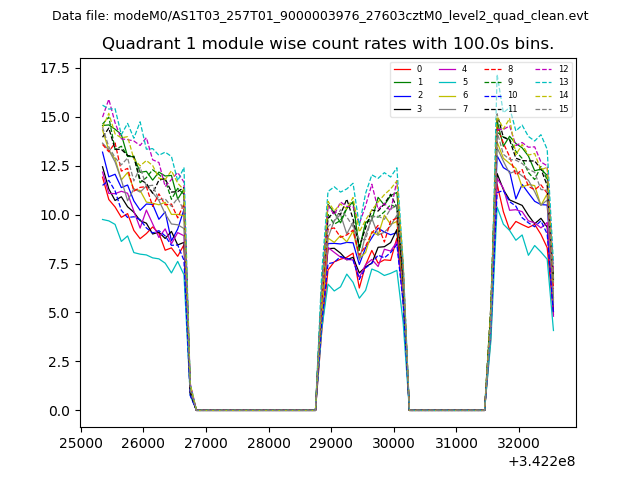
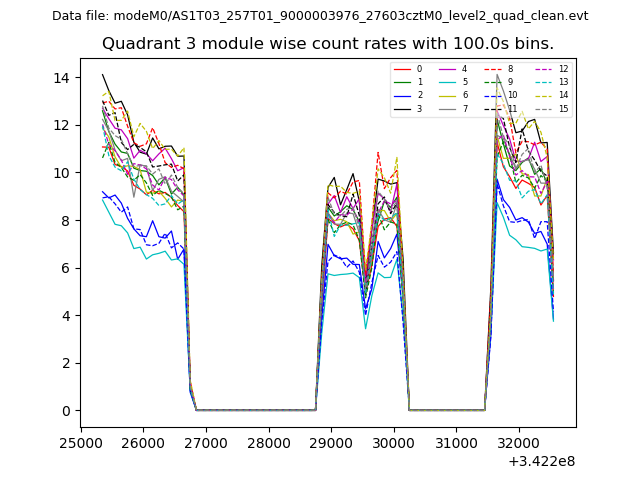
| Module-wise count rates for Quadrant A Data is divided into 100 sec bins |
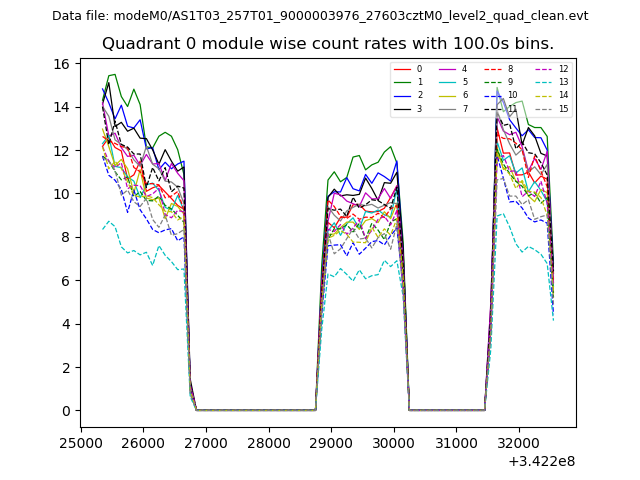 |
 |
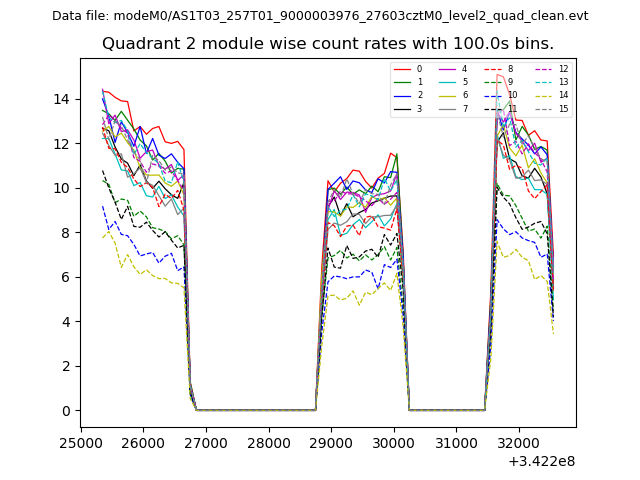
| Module-wise count rates for Quadrant B Data is divided into 100 sec bins |
 |
 |
| Module-wise count rates for Quadrant C Data is divided into 100 sec bins |
 |
 |
| Module-wise count rates for Quadrant D Data is divided into 100 sec bins |
 |
 |
| Parameter | Plot |
|---|---|
| CZT HV Monitor | 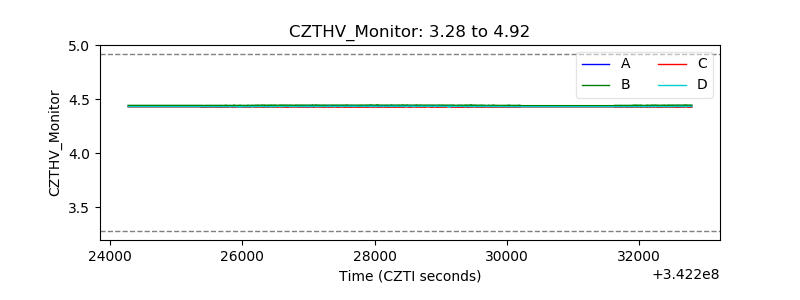 |
| D_VDD | 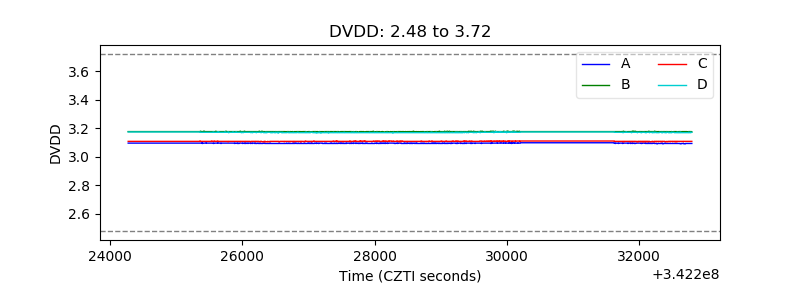 |
| Temperature 1 | 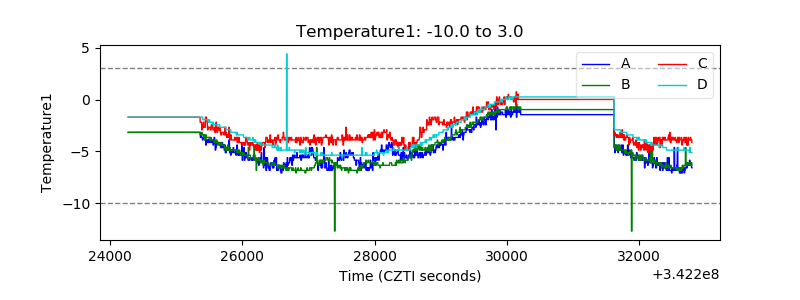 |
| Veto HV Monitor |  |
| Veto LLD | 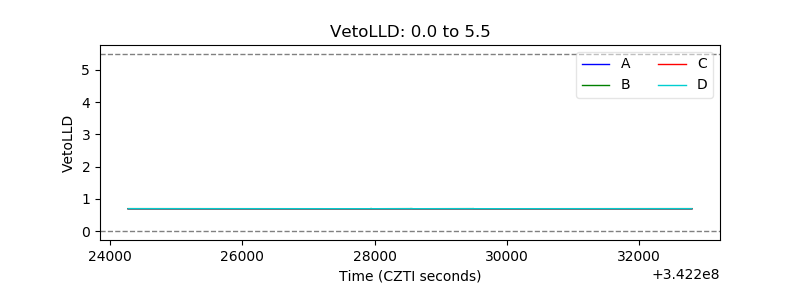 |
| Alpha Counter |  |
| _CPM_Rate | 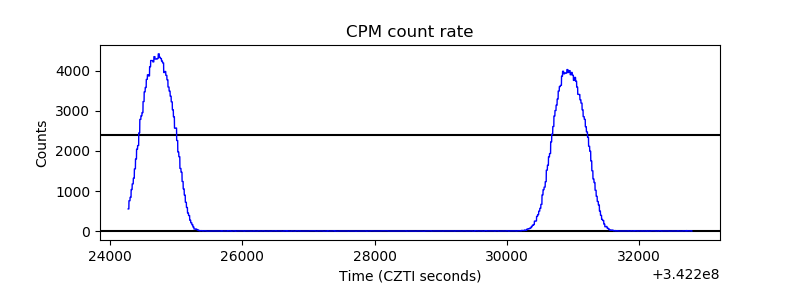 |
| CZT Counter | 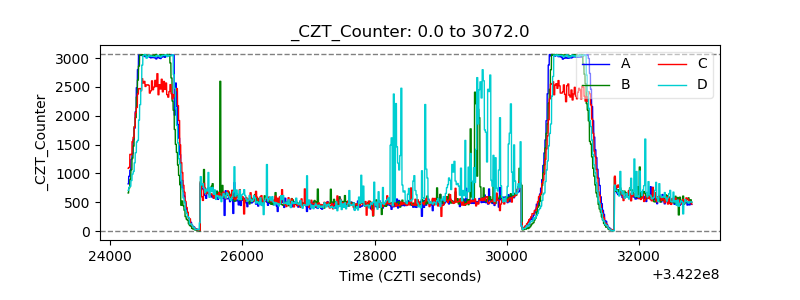 |
| +2.5 Volts monitor |  |
| +5 Volts monitor |  |
| _ROLL_ROT | 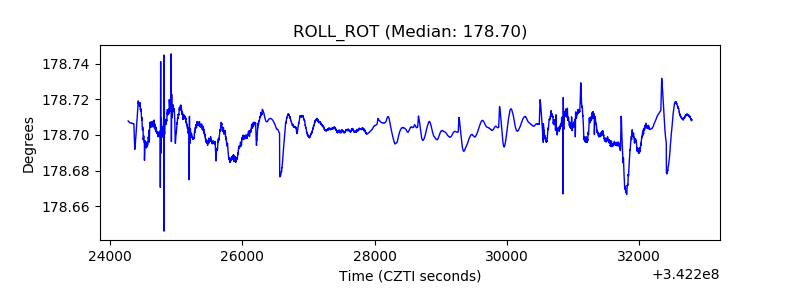 |
| _Roll_DEC | 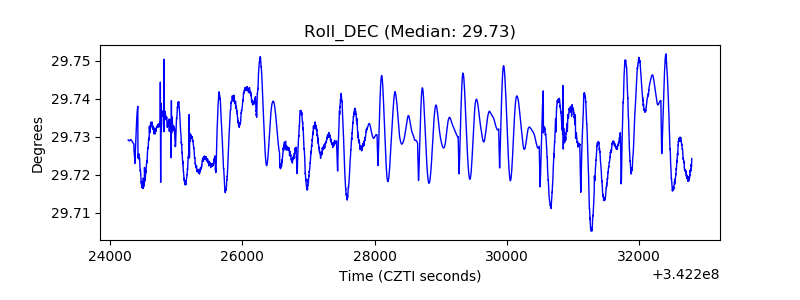 |
| _Roll_RA | 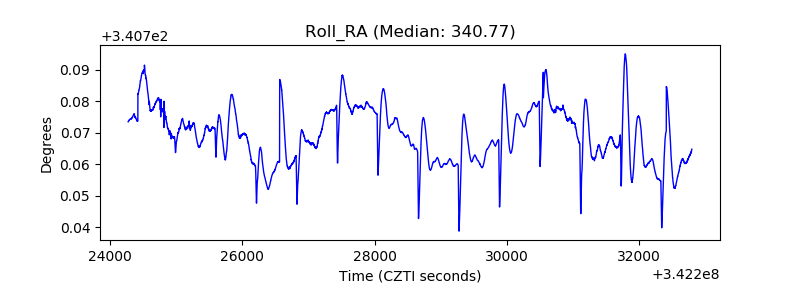 |
| Veto Counter | 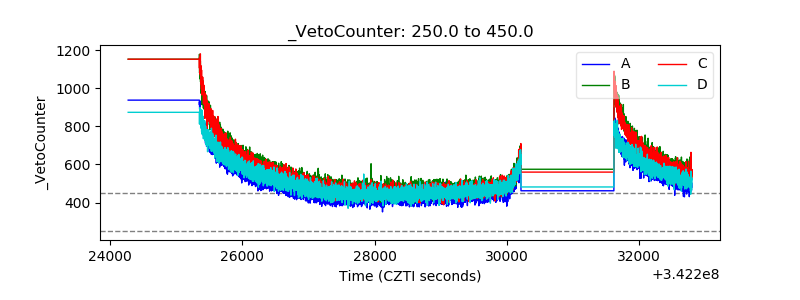 |