| Param | Original file | Final file |
|---|---|---|
| Filename | modeM0/AS1T03_257T01_9000003976_27606cztM0_level2.evt | modeM0/AS1T03_257T01_9000003976_27606cztM0_level2_quad_clean.evt |
| Size (bytes) | 460,782,720 | 68,135,040 |
| Size | 439.4 MB | 65.0 MB |
| Events in quadrant A | 3,273,215 | 408,244 |
| Events in quadrant B | 3,476,177 | 413,310 |
| Events in quadrant C | 3,399,686 | 393,016 |
| Events in quadrant D | 3,353,765 | 384,765 |
| Mode M9 | |||
|---|---|---|---|
| Quadrant | BADHDUFLAG | Total packets | Discarded packets |
| A | 0 | 9 | 0 |
| B | 0 | 9 | 0 |
| C | 0 | 9 | 0 |
| D | 0 | 9 | 0 |
| Mode M0 | |||
|---|---|---|---|
| Quadrant | BADHDUFLAG | Total packets | Discarded packets |
| A | 0 | 13751 | 0 |
| B | 0 | 14201 | 0 |
| C | 0 | 14085 | 0 |
| D | 0 | 14415 | 0 |
| Quadrant | Total seconds | Saturated seconds | Saturation percentage |
|---|---|---|---|
| A | 6647 | 97 | 1.459305% |
| B | 6648 | 130 | 1.955475% |
| C | 6647 | 145 | 2.181435% |
| D | 6647 | 82 | 1.233639% |
Noise dominated data is calculated using 1-second bins in cleaned event files. If a bin has >2000 counts, and if more than 50% of those come from <1% of pixels, then it is considered to be noise-dominated and hence unusable.
| Quadrant | # 1 sec bins | Bins with >0 counts | Bins with >2000 counts | High rate bins dominated by noise | Noise dominated (total time) | Noise dominated (detector-on time) | Marked lightcurve |
|---|---|---|---|---|---|---|---|
| A | 7537 | 6648 | 1 | 1 | 0.01% | 0.02% | 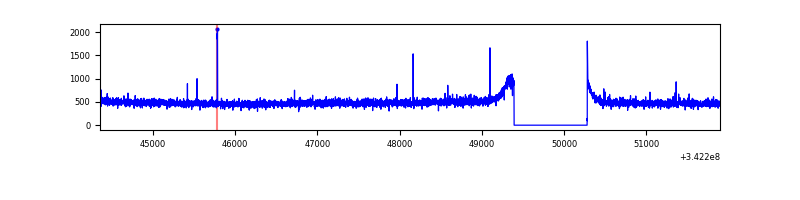 |
| B | 7538 | 6649 | 1 | 1 | 0.01% | 0.02% | 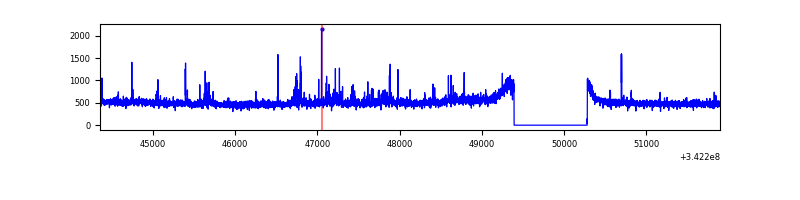 |
| C | 7537 | 6648 | 12 | 12 | 0.16% | 0.18% | 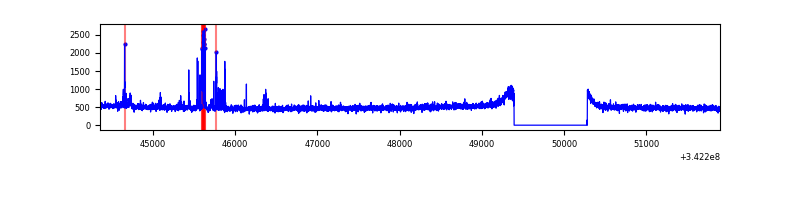 |
| D | 7537 | 6648 | 15 | 15 | 0.20% | 0.23% | 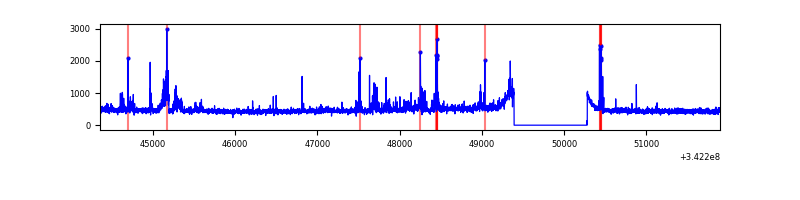 |
Top three noisy pixels from each quadrant. If the there are fewer than three noisy pixels in the level2.evt file, extra rows are filled as -1
| Pixel properties | Quadrant properties | ||||||
|---|---|---|---|---|---|---|---|
| Quadrant | DetID | PixID | Counts | Sigma | Mean | Median | Sigma |
| A | 6 | 16 | 15668 | 87.76 | 843 | 824 | 169.1 |
| A | 13 | 254 | 10775 | 58.83 | 843 | 824 | 169.1 |
| A | 3 | 137 | 8020 | 42.54 | 843 | 824 | 169.1 |
| B | 0 | 230 | 53206 | 325.36 | 842 | 822 | 161.0 |
| B | 3 | 64 | 49122 | 300.0 | 842 | 822 | 161.0 |
| B | 0 | 190 | 25090 | 150.73 | 842 | 822 | 161.0 |
| C | 14 | 238 | 128995 | 671.48 | 808 | 816 | 190.9 |
| C | 2 | 16 | 112126 | 583.11 | 808 | 816 | 190.9 |
| C | 1 | 16 | 10210 | 49.21 | 808 | 816 | 190.9 |
| D | 6 | 112 | 104267 | 536.91 | 809 | 788 | 192.7 |
| D | 7 | 80 | 79672 | 409.3 | 809 | 788 | 192.7 |
| D | 2 | 250 | 53796 | 275.04 | 809 | 788 | 192.7 |
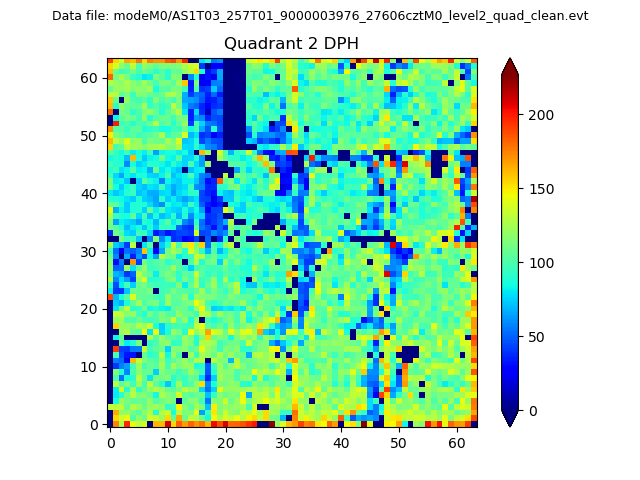
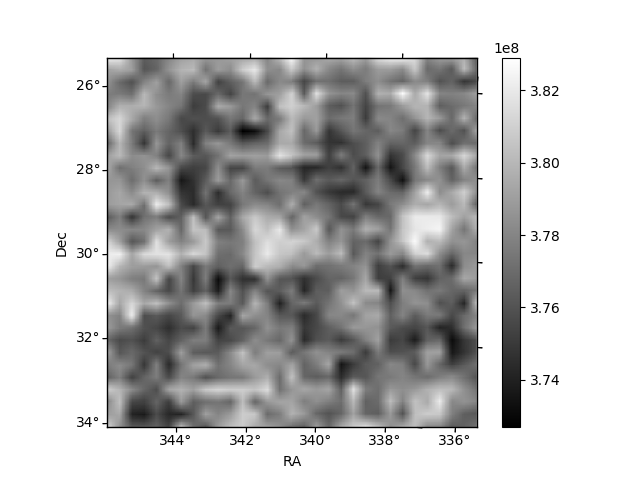
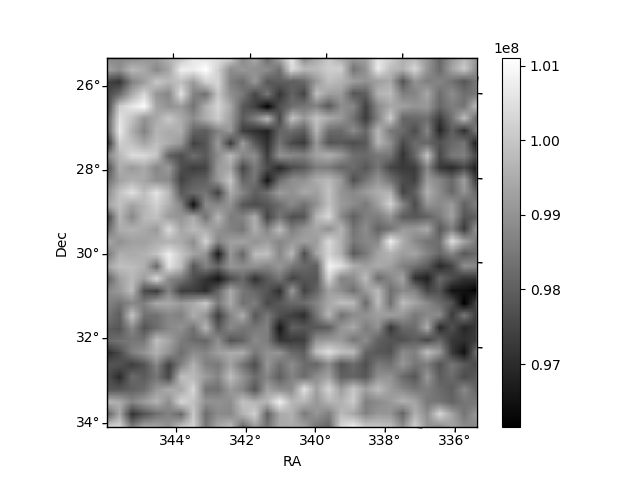
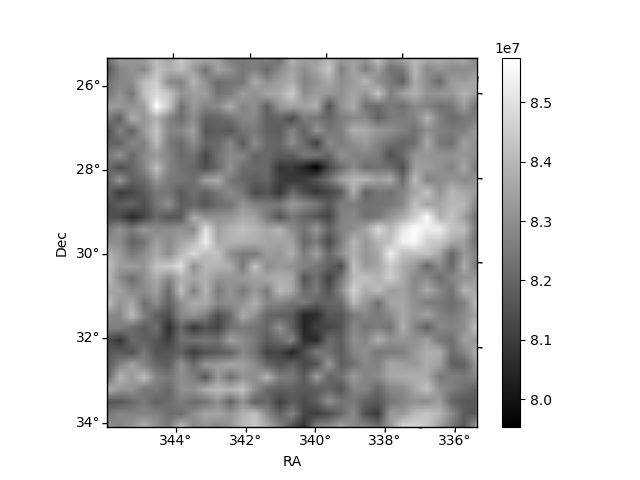
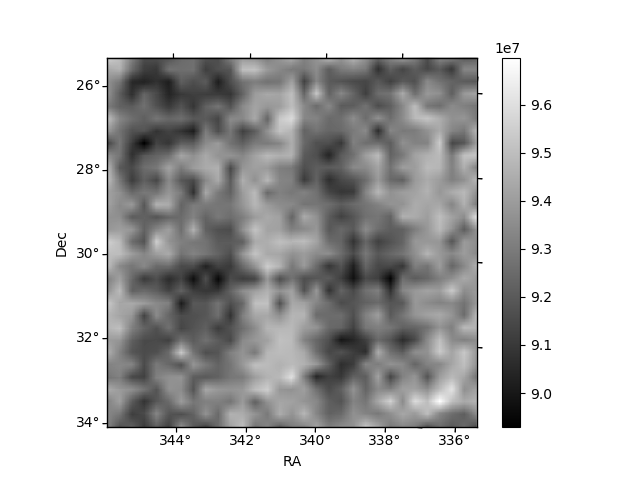
Histogram calculated using DETX and DETY for each event in the final _common_clean file
| Quadrant A | 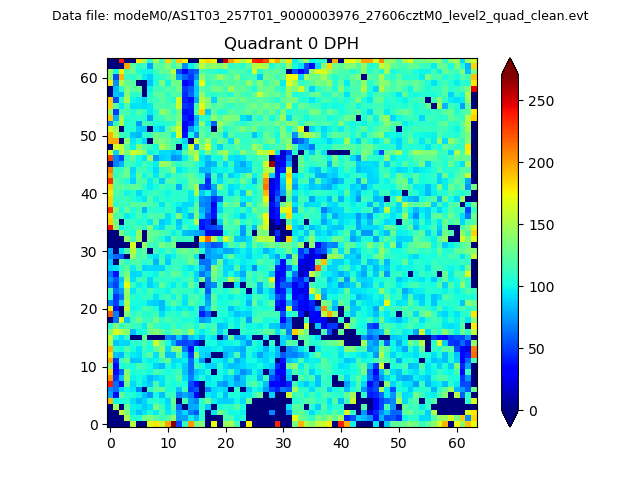 |
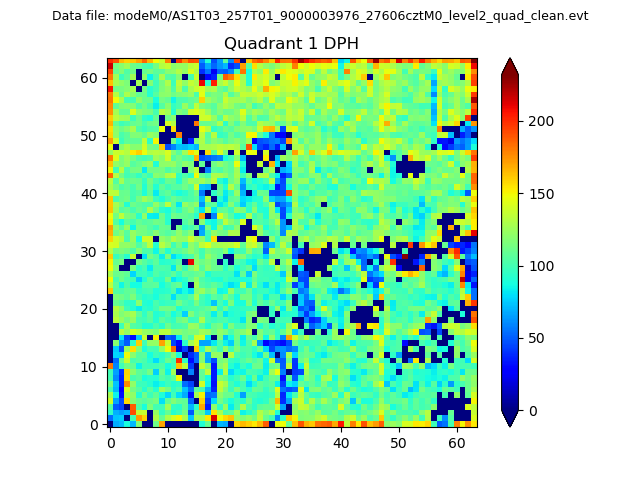 |
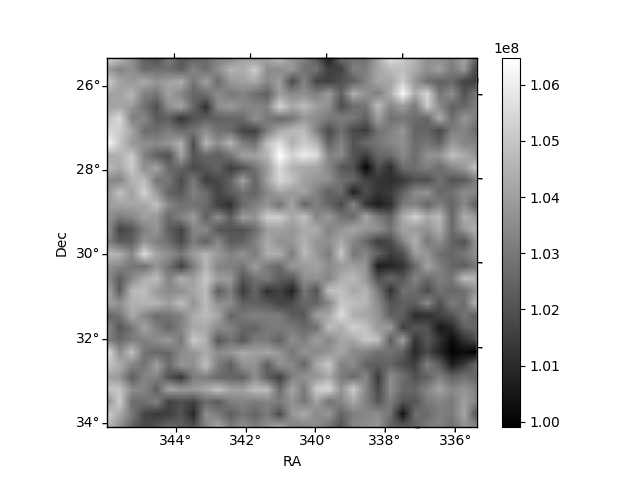
Quadrant B |
|---|---|---|---|
| Quadrant D | 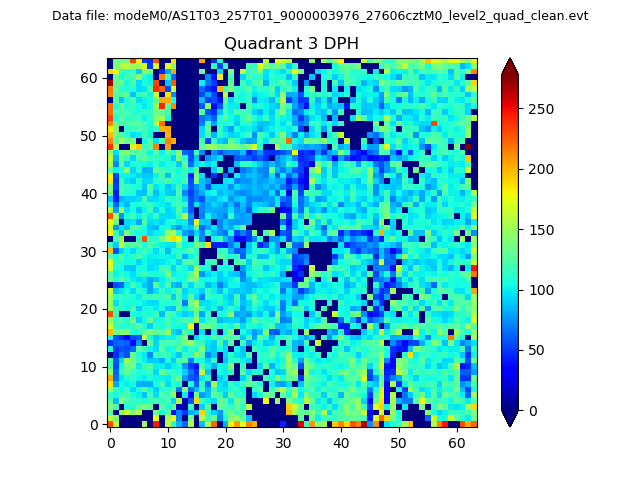 |
 |
Quadrant C |
| Plot type | Count rate plots | Images |
|---|---|---|
| Comparison with Poisson distribution Blue bars denote a histogram of data divided into 1 sec bins. Red curve is a Poisson curve with rate = median count rate of data. |
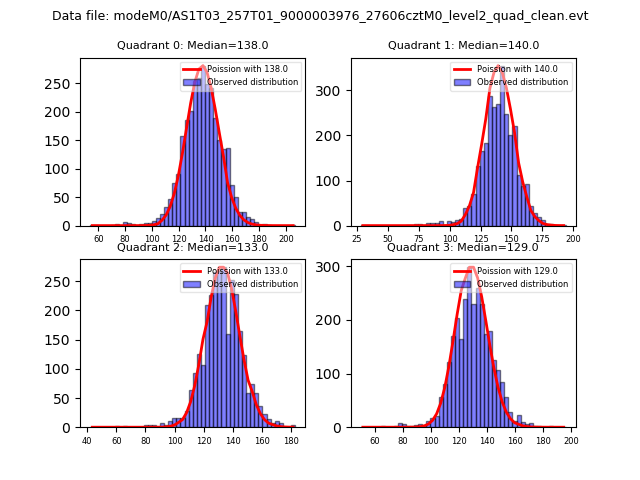 |
 |
| Quadrant-wise count rates Data is divided into 100 sec bins |
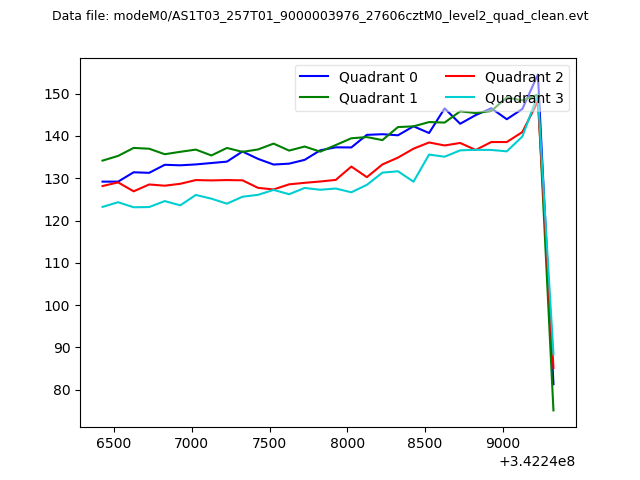 |
|
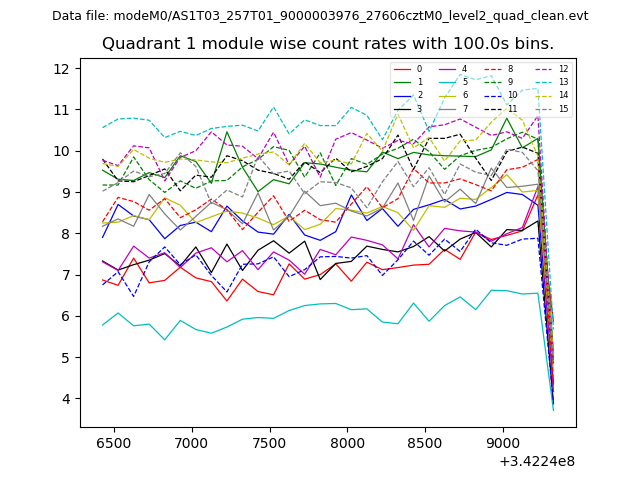
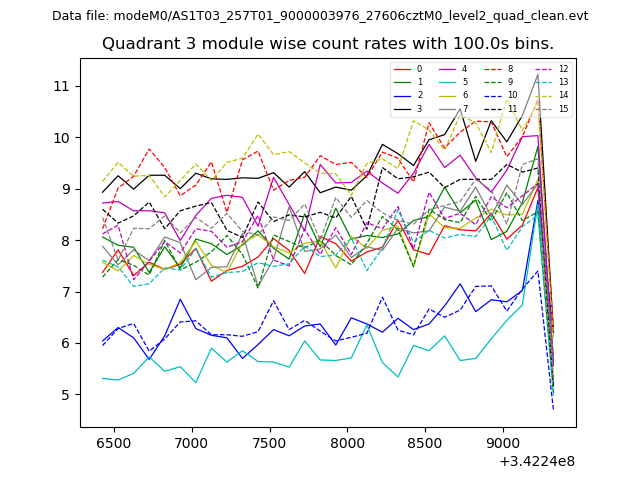
| Module-wise count rates for Quadrant A Data is divided into 100 sec bins |
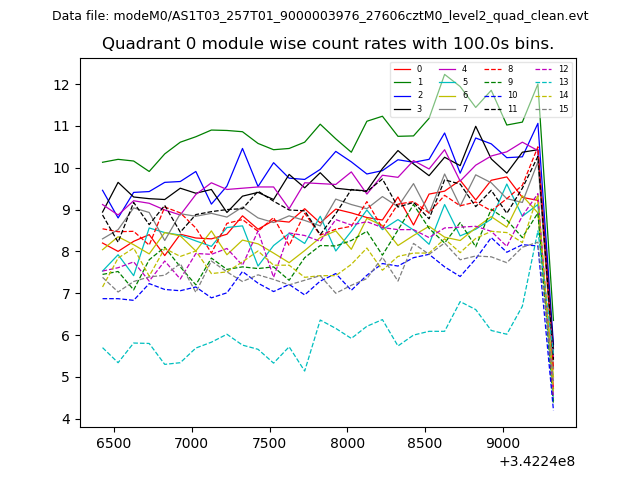 |
 |
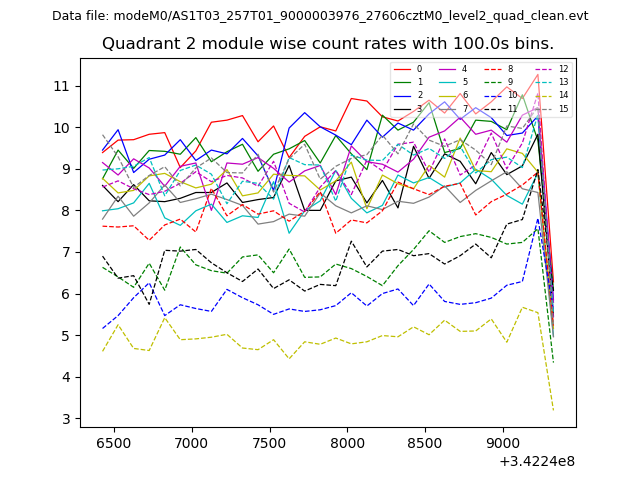
| Module-wise count rates for Quadrant B Data is divided into 100 sec bins |
 |
 |
| Module-wise count rates for Quadrant C Data is divided into 100 sec bins |
 |
 |
| Module-wise count rates for Quadrant D Data is divided into 100 sec bins |
 |
 |
| Parameter | Plot |
|---|---|
| CZT HV Monitor | 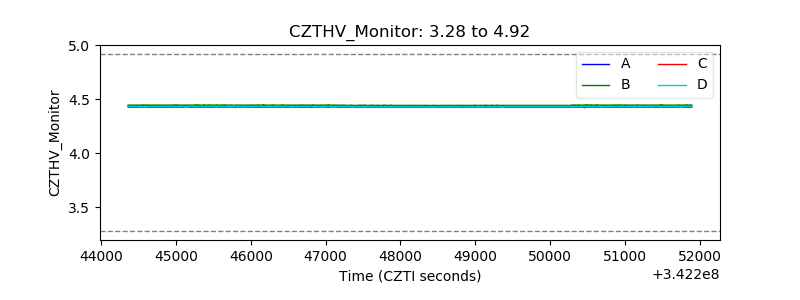 |
| D_VDD | 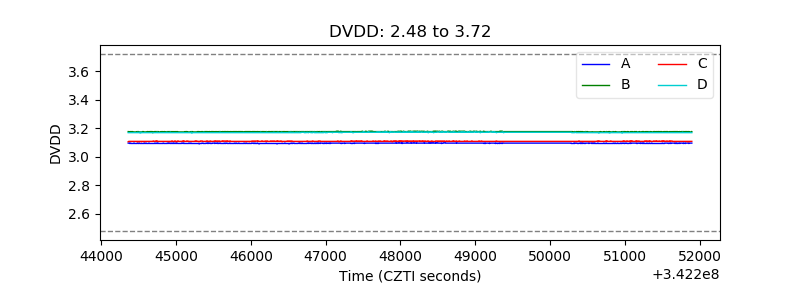 |
| Temperature 1 | 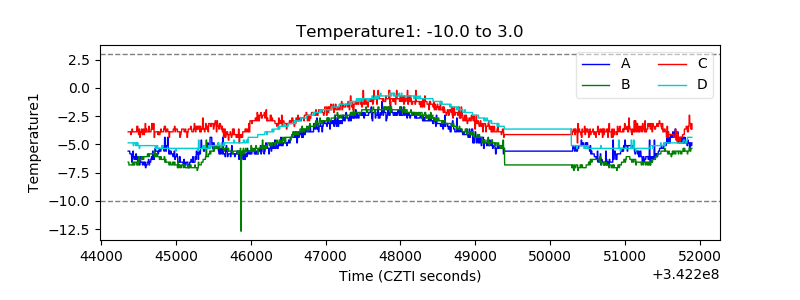 |
| Veto HV Monitor | 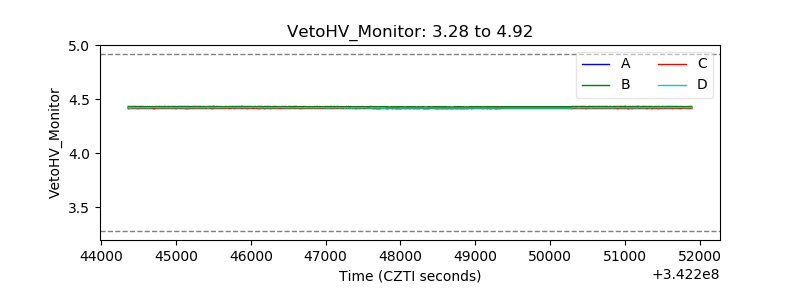 |
| Veto LLD | 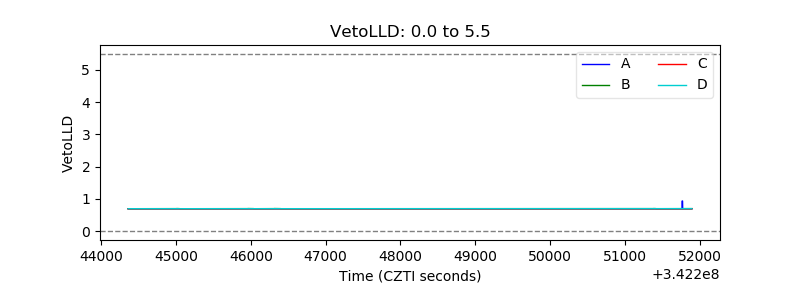 |
| Alpha Counter | 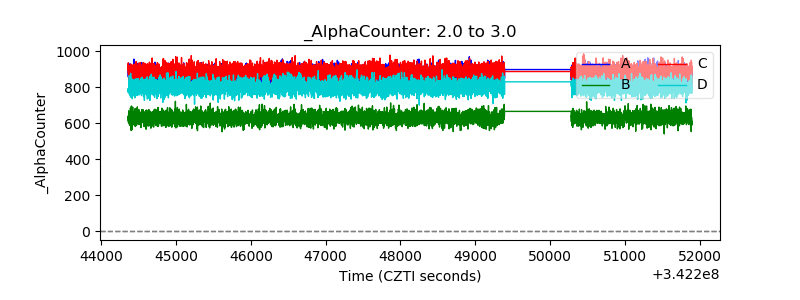 |
| _CPM_Rate | 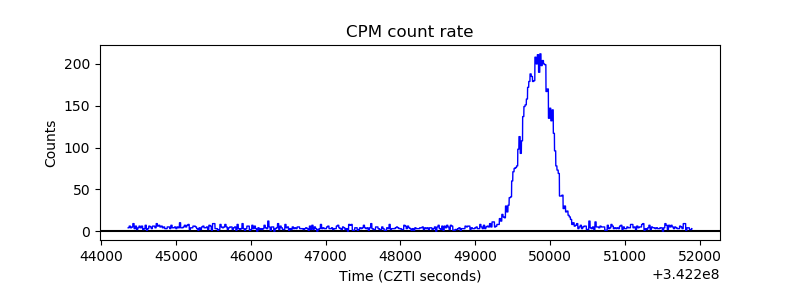 |
| CZT Counter | 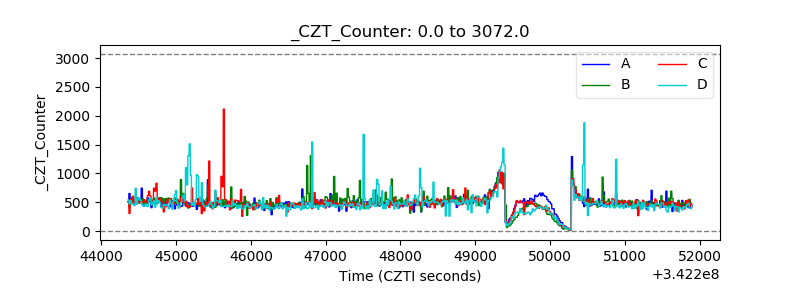 |
| +2.5 Volts monitor |  |
| +5 Volts monitor | 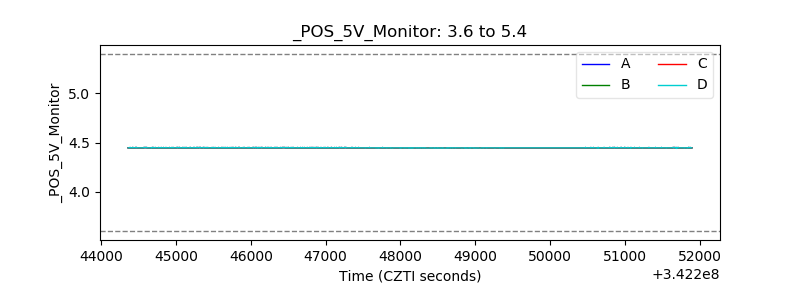 |
| _ROLL_ROT | 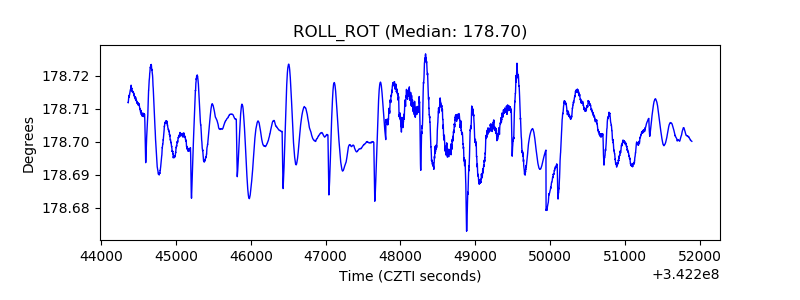 |
| _Roll_DEC | 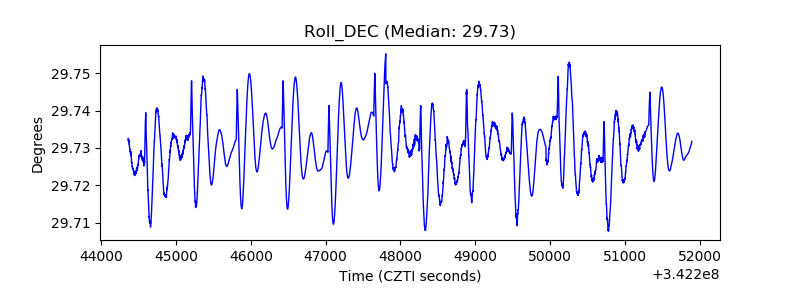 |
| _Roll_RA | 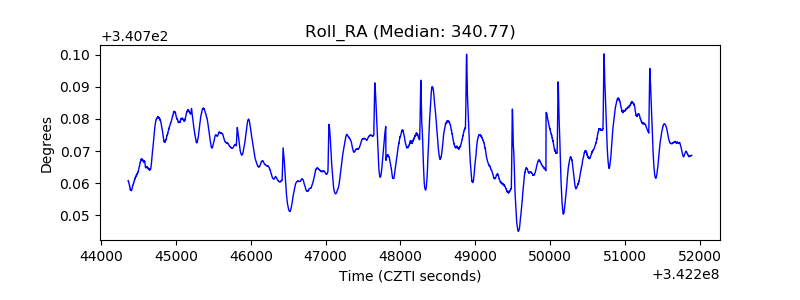 |
| Veto Counter | 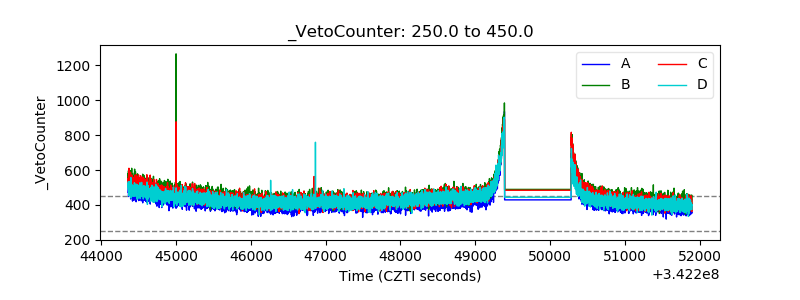 |