| Param | Original file | Final file |
|---|---|---|
| Filename | modeM0/AS1T03_257T01_9000003976_27608cztM0_level2.evt | modeM0/AS1T03_257T01_9000003976_27608cztM0_level2_quad_clean.evt |
| Size (bytes) | 606,257,280 | 85,233,600 |
| Size | 578.2 MB | 81.3 MB |
| Events in quadrant A | 3,829,038 | 521,374 |
| Events in quadrant B | 4,331,034 | 526,074 |
| Events in quadrant C | 3,975,877 | 505,412 |
| Events in quadrant D | 5,687,459 | 477,715 |
| Mode M9 | |||
|---|---|---|---|
| Quadrant | BADHDUFLAG | Total packets | Discarded packets |
| A | 1 | 140277741226888 | 46 |
| B | 1 | -1 | -1 |
| C | 1 | -1 | -1 |
| D | 1 | -1 | -1 |
| Mode M0 | |||
|---|---|---|---|
| Quadrant | BADHDUFLAG | Total packets | Discarded packets |
| A | 0 | 16478 | 0 |
| B | 0 | 17795 | 0 |
| C | 0 | 16814 | 0 |
| D | 0 | 22242 | 0 |
| Quadrant | Total seconds | Saturated seconds | Saturation percentage |
|---|---|---|---|
| A | 7917 | 282 | 3.561955% |
| B | 7916 | 421 | 5.318343% |
| C | 7916 | 334 | 4.219303% |
| D | 7916 | 656 | 8.287014% |
Noise dominated data is calculated using 1-second bins in cleaned event files. If a bin has >2000 counts, and if more than 50% of those come from <1% of pixels, then it is considered to be noise-dominated and hence unusable.
| Quadrant | # 1 sec bins | Bins with >0 counts | Bins with >2000 counts | High rate bins dominated by noise | Noise dominated (total time) | Noise dominated (detector-on time) | Marked lightcurve |
|---|---|---|---|---|---|---|---|
| A | 7917 | 7917 | 0 | 0 | 0.00% | 0.00% | 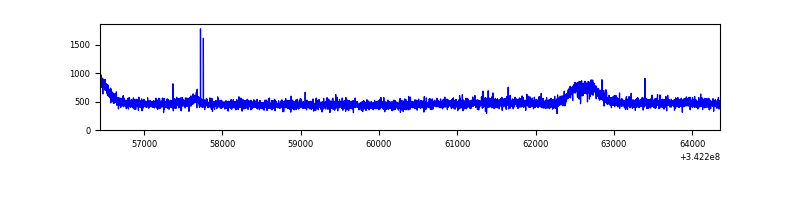 |
| B | 7916 | 7916 | 47 | 47 | 0.59% | 0.59% | 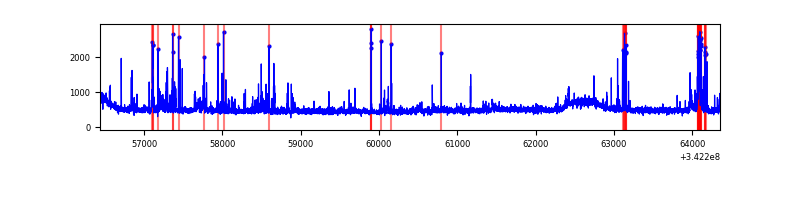 |
| C | 7916 | 7916 | 8 | 8 | 0.10% | 0.10% | 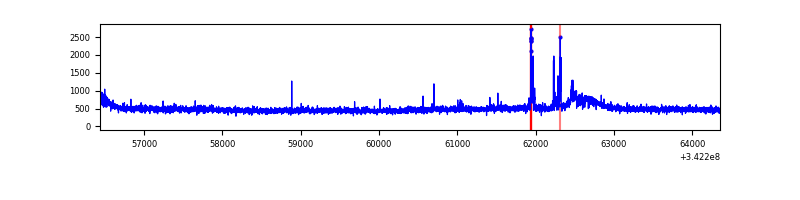 |
| D | 7916 | 7916 | 479 | 479 | 6.05% | 6.05% | 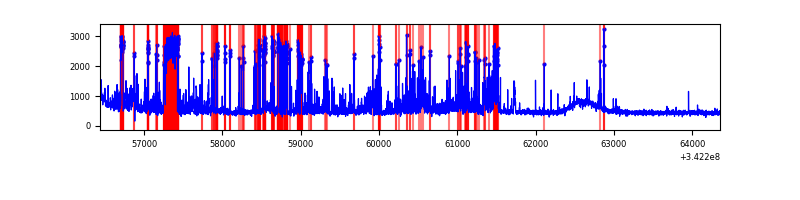 |
Top three noisy pixels from each quadrant. If the there are fewer than three noisy pixels in the level2.evt file, extra rows are filled as -1
| Pixel properties | Quadrant properties | ||||||
|---|---|---|---|---|---|---|---|
| Quadrant | DetID | PixID | Counts | Sigma | Mean | Median | Sigma |
| A | 15 | 174 | 15757 | 73.52 | 987 | 964 | 201.2 |
| A | 13 | 254 | 11988 | 54.79 | 987 | 964 | 201.2 |
| A | 3 | 137 | 9918 | 44.5 | 987 | 964 | 201.2 |
| B | 10 | 245 | 379545 | 2015.98 | 978 | 952 | 187.8 |
| B | 0 | 230 | 24923 | 127.64 | 978 | 952 | 187.8 |
| B | 12 | 111 | 24199 | 123.79 | 978 | 952 | 187.8 |
| C | 14 | 238 | 150967 | 668.0 | 949 | 952 | 224.6 |
| C | 2 | 16 | 113295 | 500.25 | 949 | 952 | 224.6 |
| C | 8 | 208 | 10671 | 43.28 | 949 | 952 | 224.6 |
| D | 1 | 52 | 1988546 | 8991.05 | 927 | 901 | 221.1 |
| D | 2 | 250 | 158491 | 712.85 | 927 | 901 | 221.1 |
| D | 2 | 234 | 29191 | 127.97 | 927 | 901 | 221.1 |
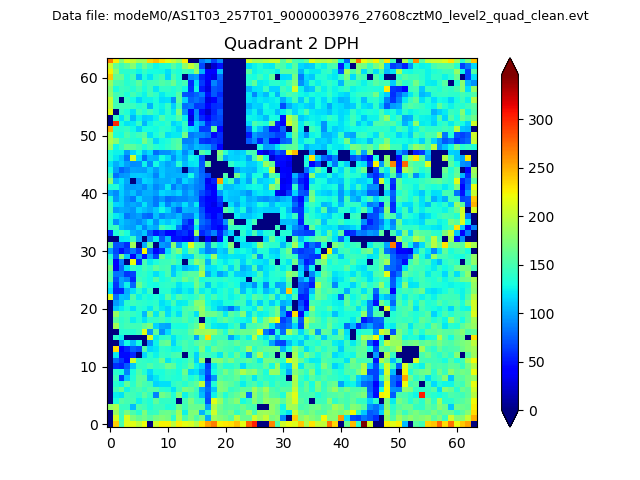
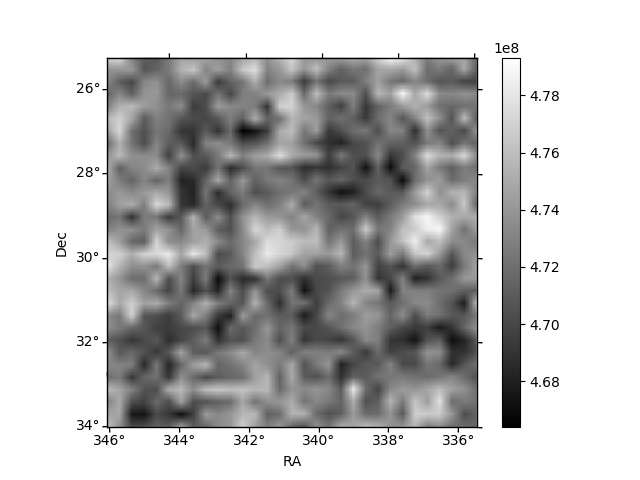
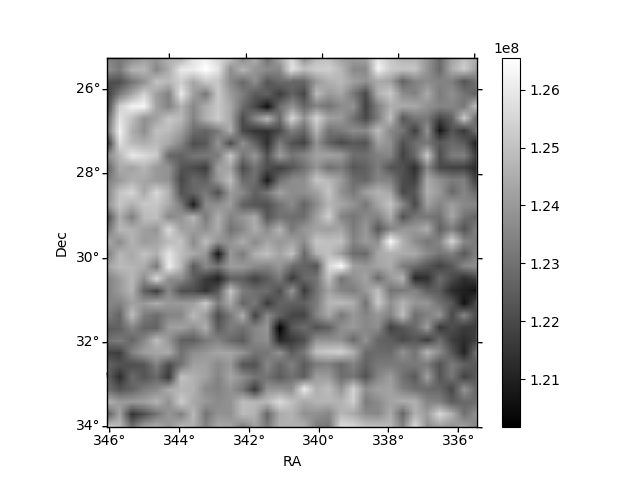
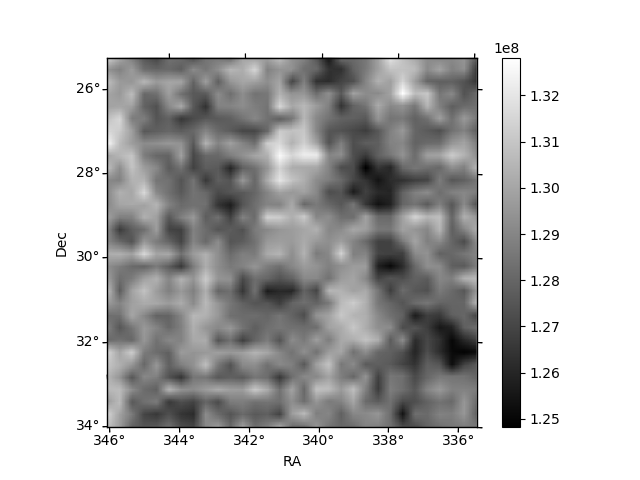
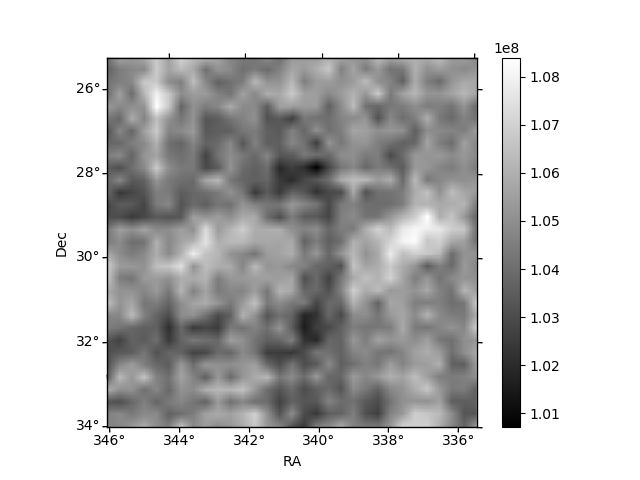
Histogram calculated using DETX and DETY for each event in the final _common_clean file
| Quadrant A | 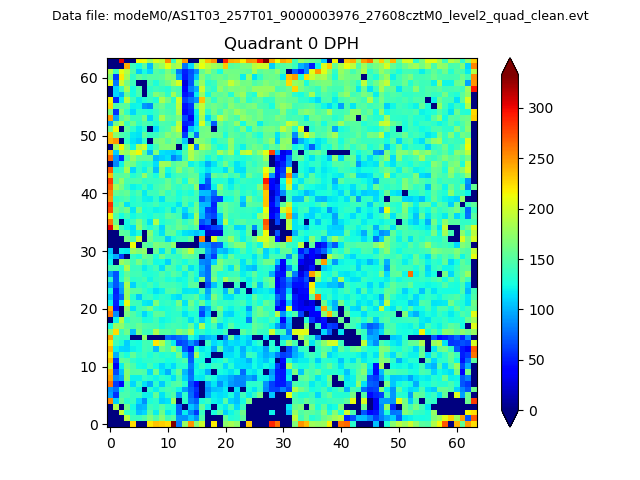 |
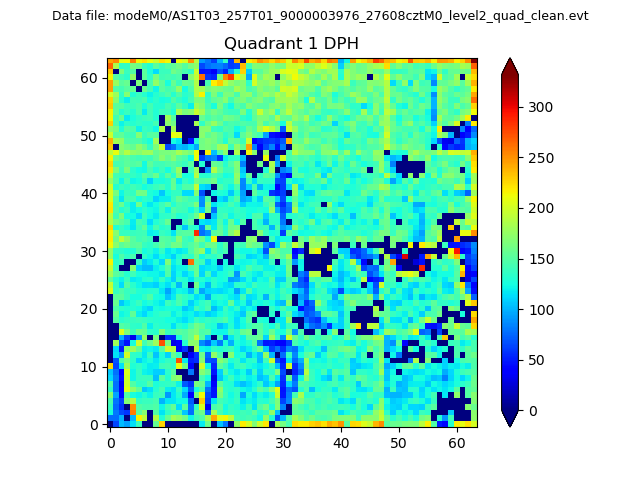 |
Quadrant B |
|---|---|---|---|
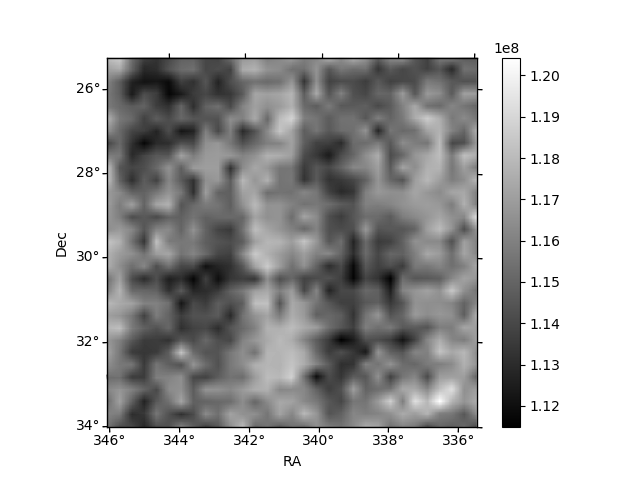
| Quadrant D | 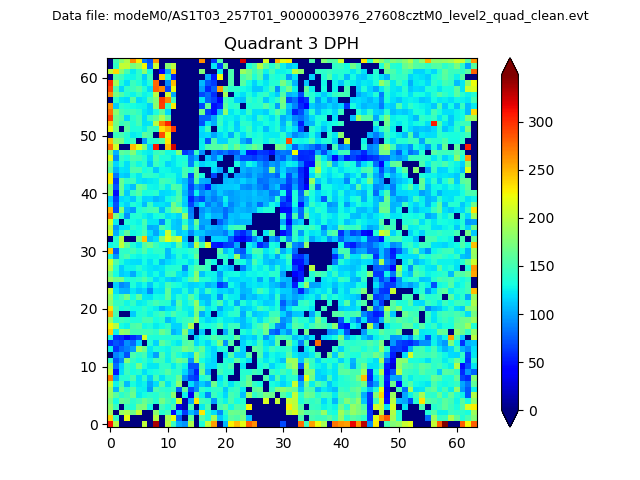 |
 |
Quadrant C |
| Plot type | Count rate plots | Images |
|---|---|---|
| Comparison with Poisson distribution Blue bars denote a histogram of data divided into 1 sec bins. Red curve is a Poisson curve with rate = median count rate of data. |
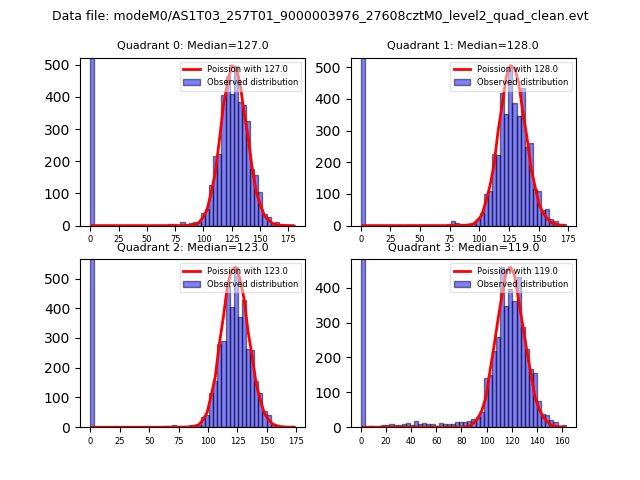 |
 |
| Quadrant-wise count rates Data is divided into 100 sec bins |
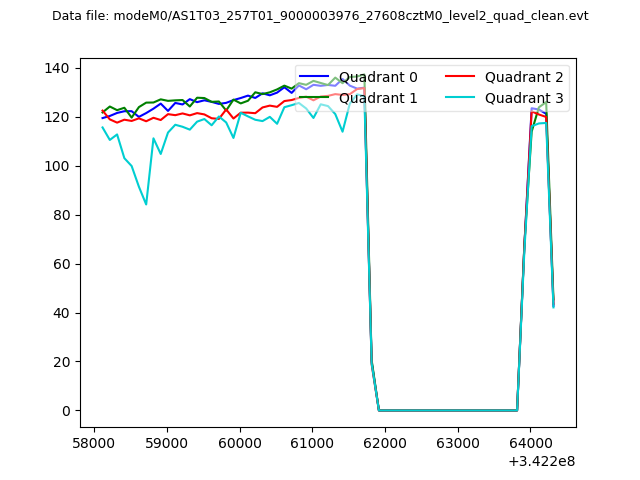 |
|
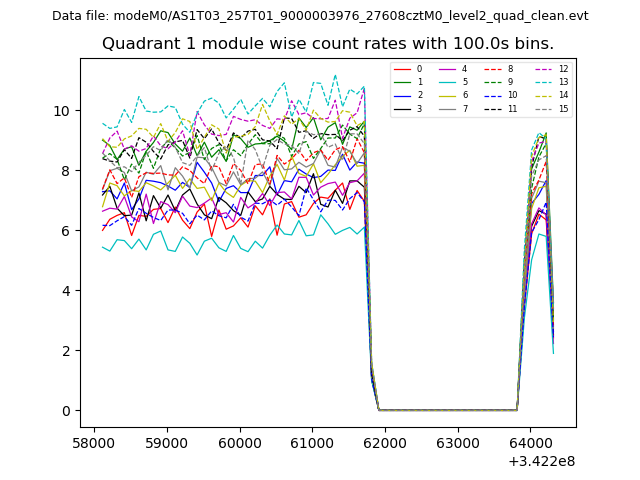
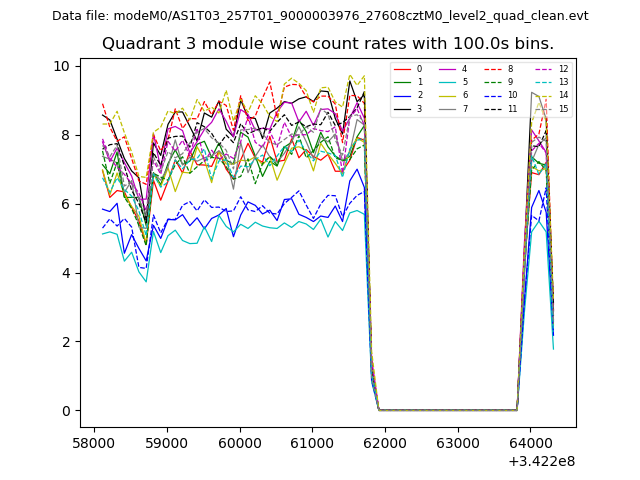
| Module-wise count rates for Quadrant A Data is divided into 100 sec bins |
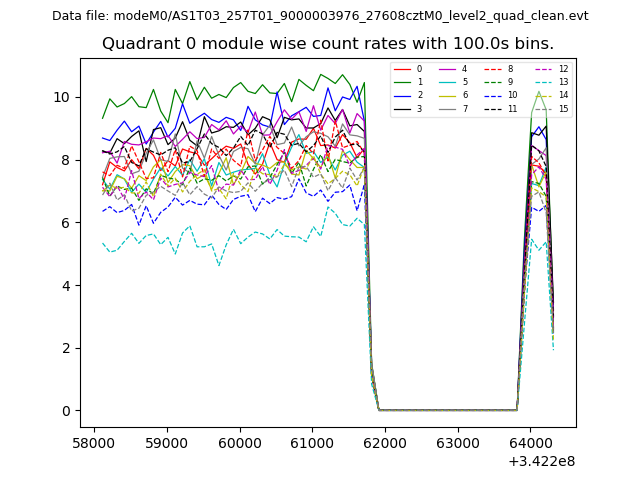 |
 |
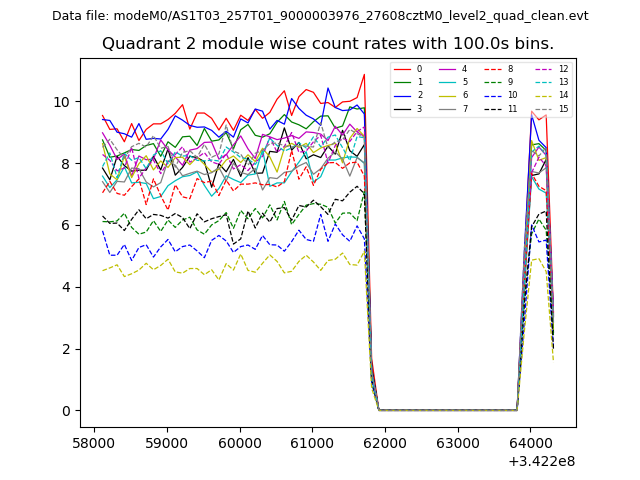
| Module-wise count rates for Quadrant B Data is divided into 100 sec bins |
 |
 |
| Module-wise count rates for Quadrant C Data is divided into 100 sec bins |
 |
 |
| Module-wise count rates for Quadrant D Data is divided into 100 sec bins |
 |
 |
| Parameter | Plot |
|---|---|
| CZT HV Monitor | 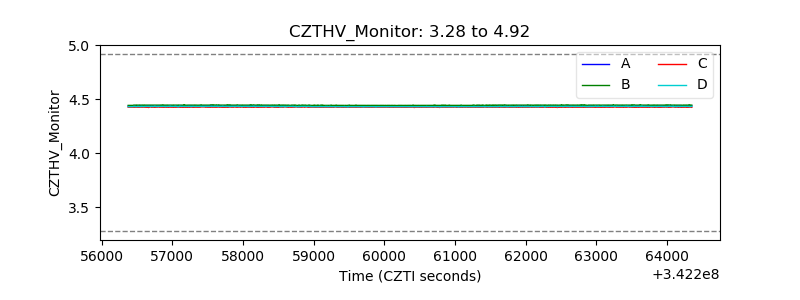 |
| D_VDD | 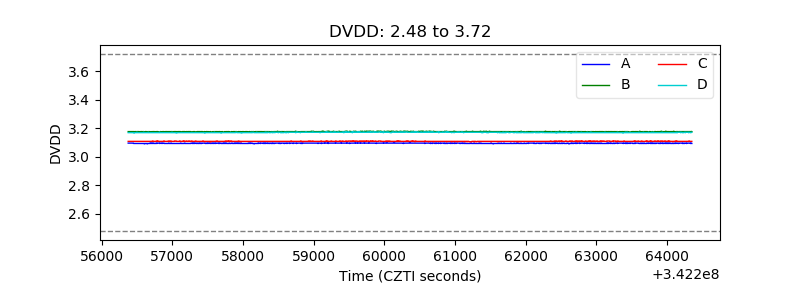 |
| Temperature 1 | 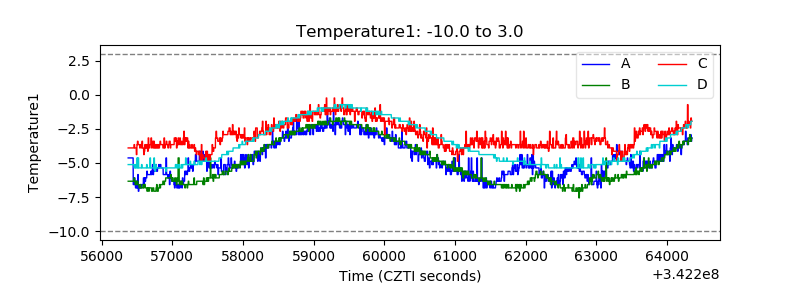 |
| Veto HV Monitor | 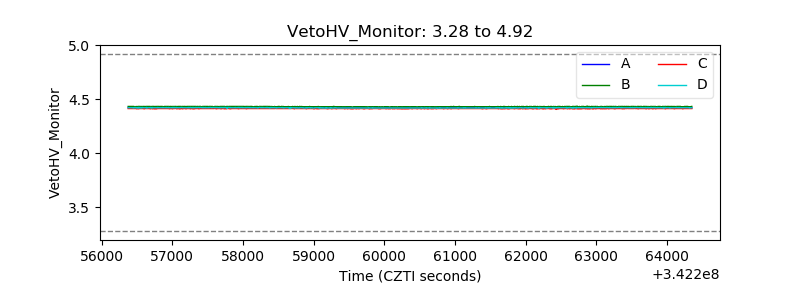 |
| Veto LLD | 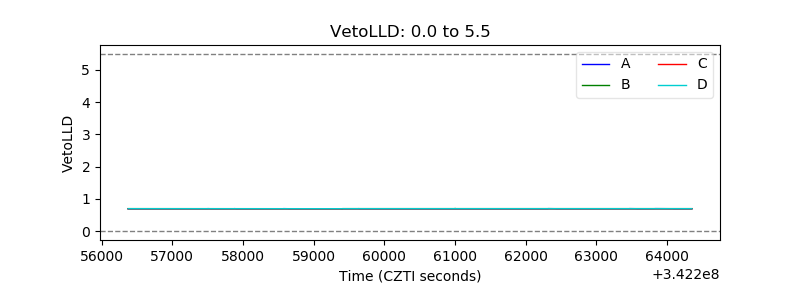 |
| Alpha Counter | 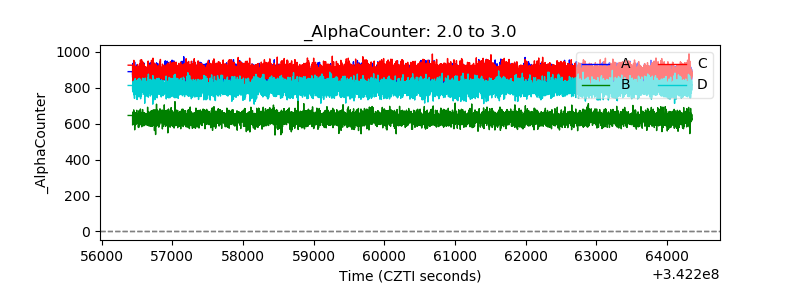 |
| _CPM_Rate | 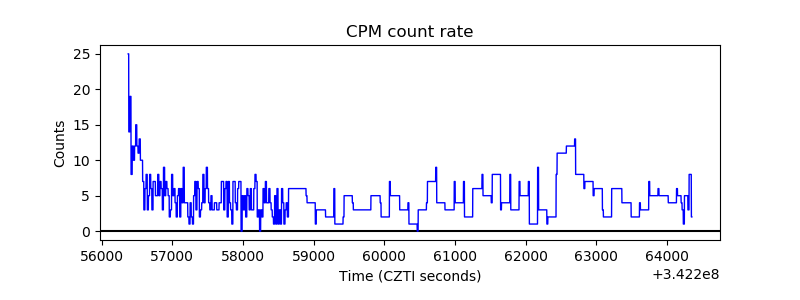 |
| CZT Counter | 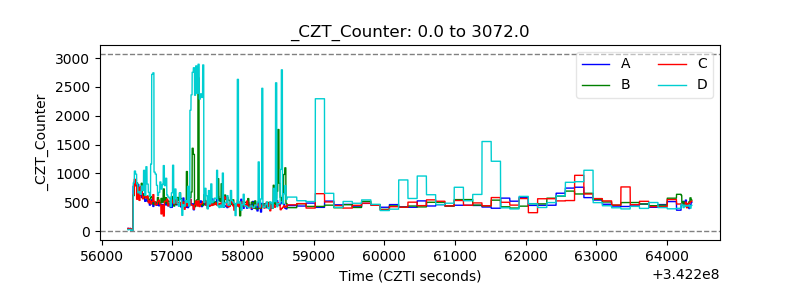 |
| +2.5 Volts monitor | 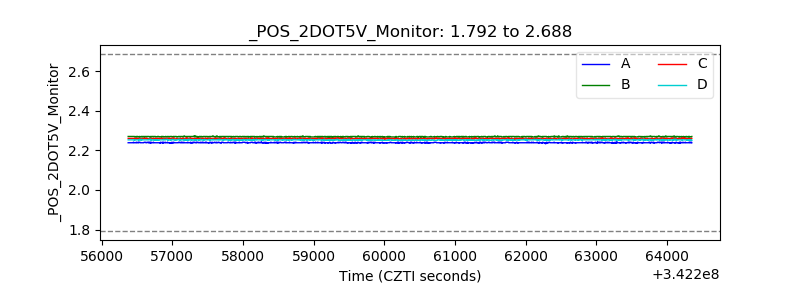 |
| +5 Volts monitor | 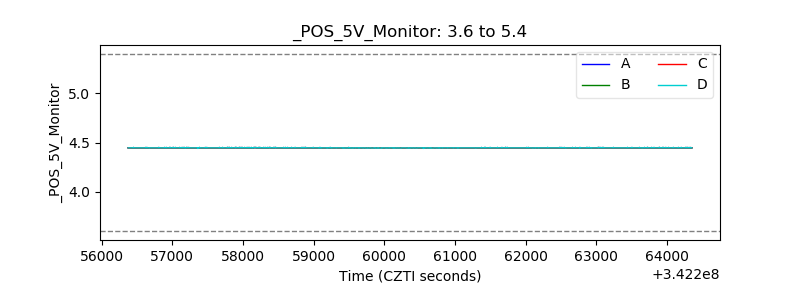 |
| _ROLL_ROT | 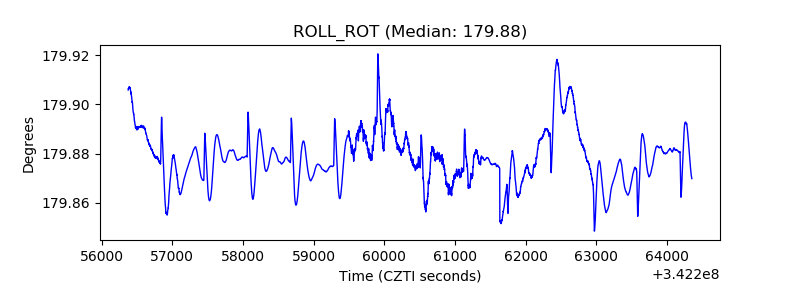 |
| _Roll_DEC |  |
| _Roll_RA | 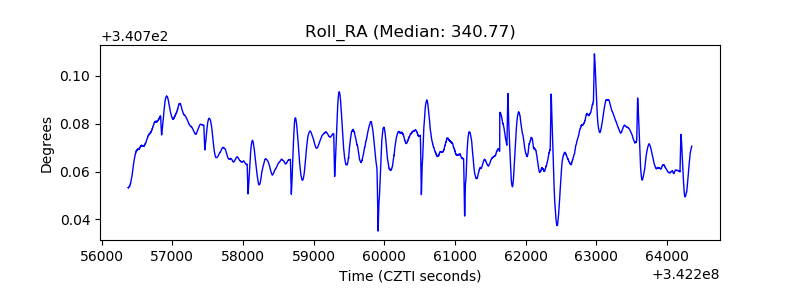 |
| Veto Counter | 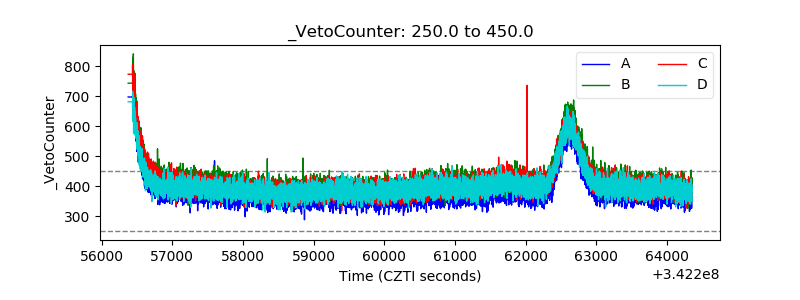 |