| Param | Original file | Final file |
|---|---|---|
| Filename | modeM0/AS1T03_257T01_9000003976_27609cztM0_level2.evt | modeM0/AS1T03_257T01_9000003976_27609cztM0_level2_quad_clean.evt |
| Size (bytes) | 552,732,480 | 90,622,080 |
| Size | 527.1 MB | 86.4 MB |
| Events in quadrant A | 3,566,096 | 572,278 |
| Events in quadrant B | 4,327,419 | 577,398 |
| Events in quadrant C | 4,515,474 | 526,833 |
| Events in quadrant D | 3,818,111 | 542,726 |
| Mode M9 | |||
|---|---|---|---|
| Quadrant | BADHDUFLAG | Total packets | Discarded packets |
| A | 0 | 2 | 0 |
| B | 0 | 2 | 0 |
| C | 0 | 2 | 0 |
| D | 0 | 2 | 0 |
| Mode M0 | |||
|---|---|---|---|
| Quadrant | BADHDUFLAG | Total packets | Discarded packets |
| A | 0 | 15474 | 0 |
| B | 0 | 17605 | 0 |
| C | 0 | 18175 | 0 |
| D | 0 | 16444 | 0 |
| Quadrant | Total seconds | Saturated seconds | Saturation percentage |
|---|---|---|---|
| A | 7546 | 166 | 2.199841% |
| B | 7547 | 337 | 4.465350% |
| C | 7547 | 594 | 7.870677% |
| D | 7547 | 172 | 2.279051% |
Noise dominated data is calculated using 1-second bins in cleaned event files. If a bin has >2000 counts, and if more than 50% of those come from <1% of pixels, then it is considered to be noise-dominated and hence unusable.
| Quadrant | # 1 sec bins | Bins with >0 counts | Bins with >2000 counts | High rate bins dominated by noise | Noise dominated (total time) | Noise dominated (detector-on time) | Marked lightcurve |
|---|---|---|---|---|---|---|---|
| A | 7696 | 7548 | 0 | 0 | 0.00% | 0.00% | 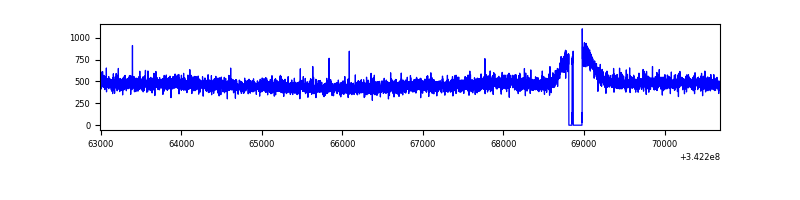 |
| B | 7697 | 7549 | 80 | 80 | 1.04% | 1.06% | 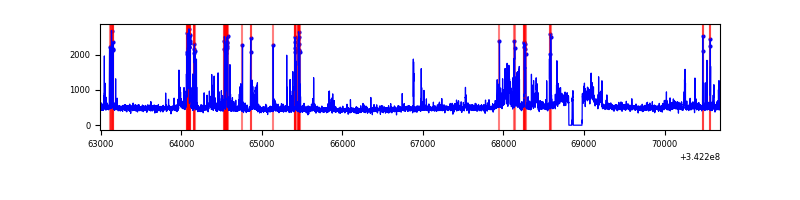 |
| C | 7697 | 7549 | 383 | 383 | 4.98% | 5.07% | 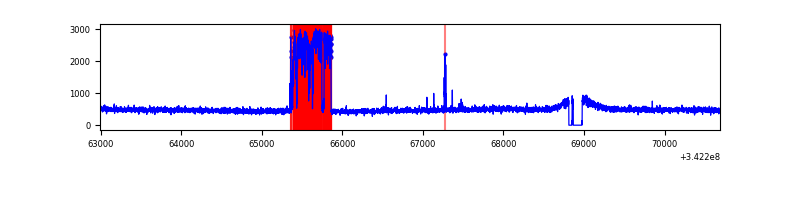 |
| D | 7697 | 7549 | 51 | 51 | 0.66% | 0.68% | 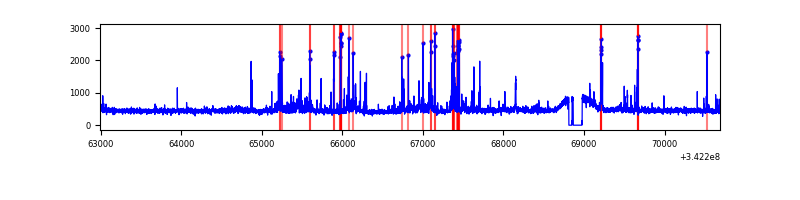 |
Top three noisy pixels from each quadrant. If the there are fewer than three noisy pixels in the level2.evt file, extra rows are filled as -1
| Pixel properties | Quadrant properties | ||||||
|---|---|---|---|---|---|---|---|
| Quadrant | DetID | PixID | Counts | Sigma | Mean | Median | Sigma |
| A | 13 | 254 | 10996 | 54.05 | 923 | 899 | 186.8 |
| A | 3 | 137 | 9209 | 44.48 | 923 | 899 | 186.8 |
| A | 0 | 226 | 7894 | 37.44 | 923 | 899 | 186.8 |
| B | 10 | 245 | 594344 | 3358.72 | 911 | 884 | 176.7 |
| B | 3 | 64 | 82330 | 460.95 | 911 | 884 | 176.7 |
| B | 0 | 190 | 36618 | 202.24 | 911 | 884 | 176.7 |
| C | 15 | 208 | 982365 | 4795.75 | 863 | 868 | 204.7 |
| C | 14 | 238 | 137641 | 668.29 | 863 | 868 | 204.7 |
| C | 2 | 16 | 26261 | 124.07 | 863 | 868 | 204.7 |
| D | 7 | 80 | 241591 | 1124.62 | 893 | 866 | 214.0 |
| D | 2 | 250 | 113444 | 525.94 | 893 | 866 | 214.0 |
| D | 2 | 234 | 31423 | 142.76 | 893 | 866 | 214.0 |
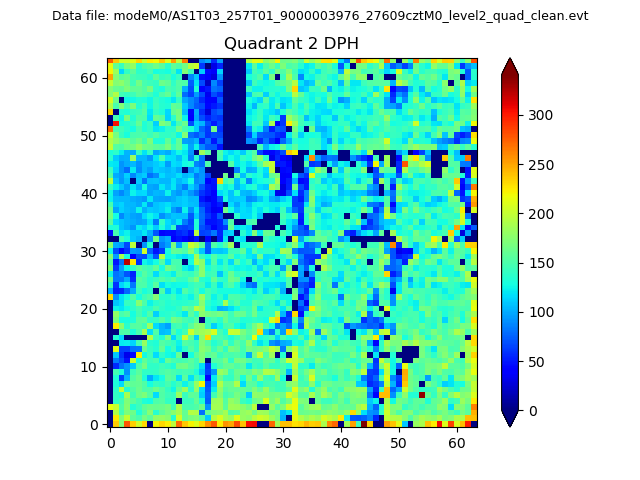
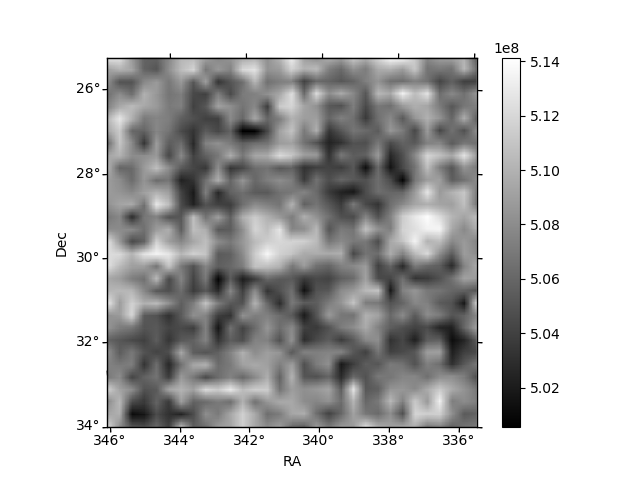
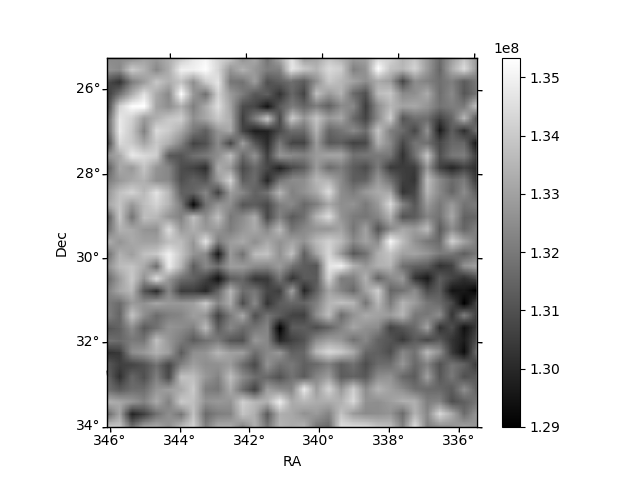
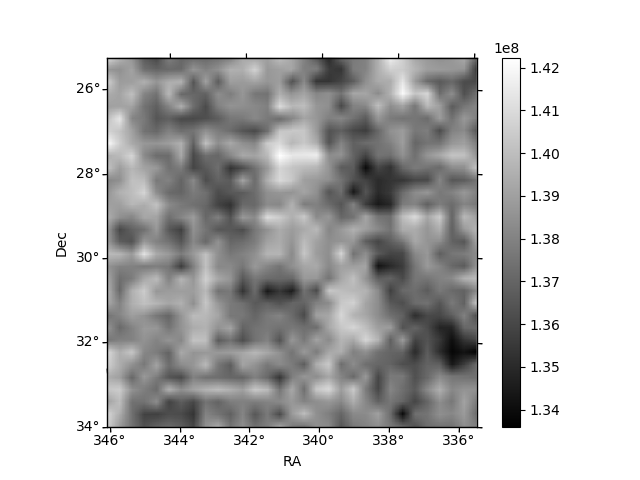
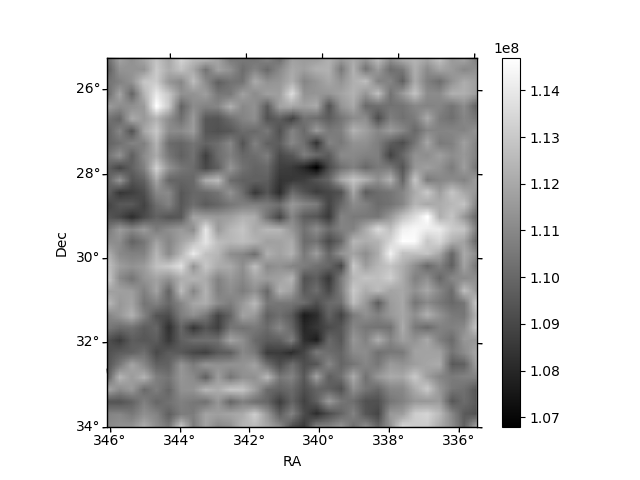
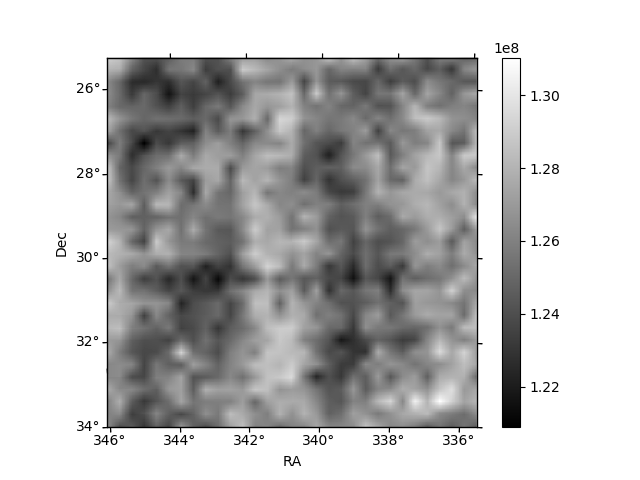
Histogram calculated using DETX and DETY for each event in the final _common_clean file
| Quadrant A | 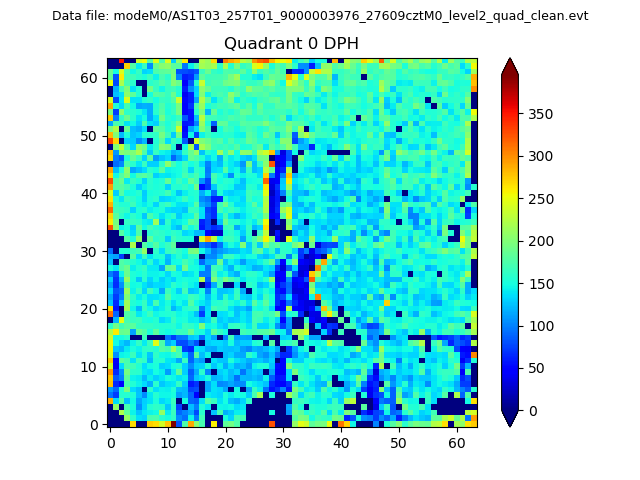 |
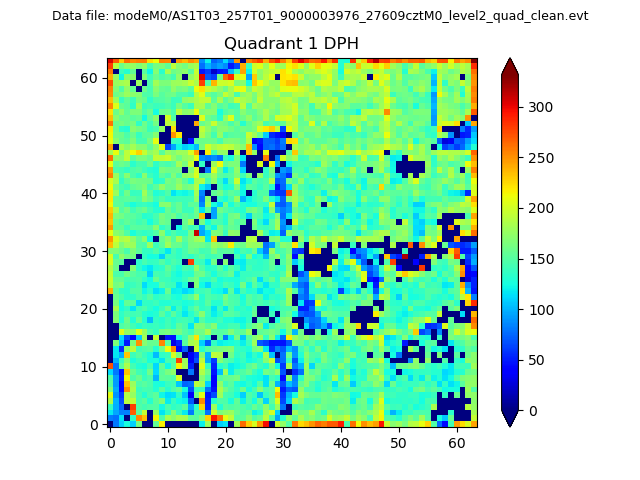 |
Quadrant B |
|---|---|---|---|
| Quadrant D | 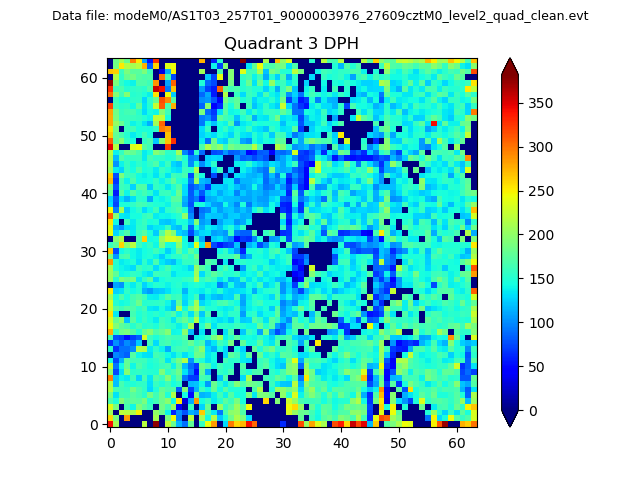 |
 |
Quadrant C |
| Plot type | Count rate plots | Images |
|---|---|---|
| Comparison with Poisson distribution Blue bars denote a histogram of data divided into 1 sec bins. Red curve is a Poisson curve with rate = median count rate of data. |
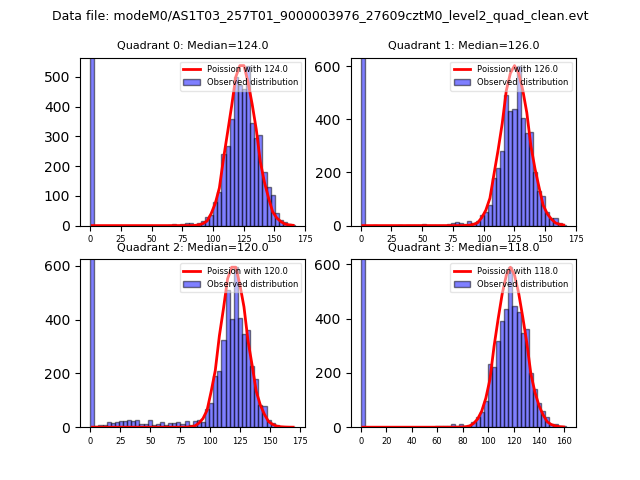 |
 |
| Quadrant-wise count rates Data is divided into 100 sec bins |
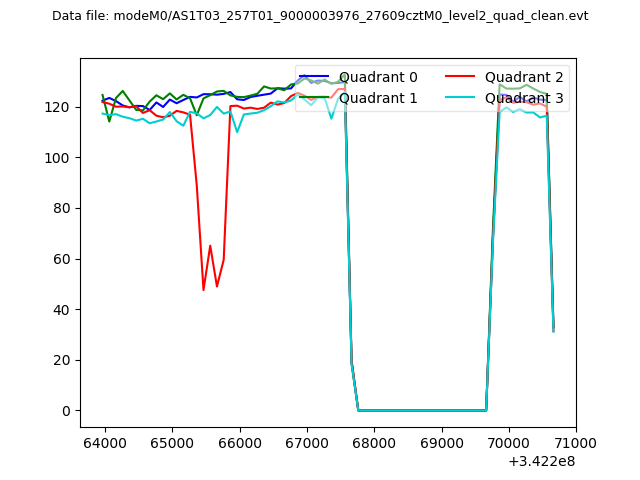 |
|
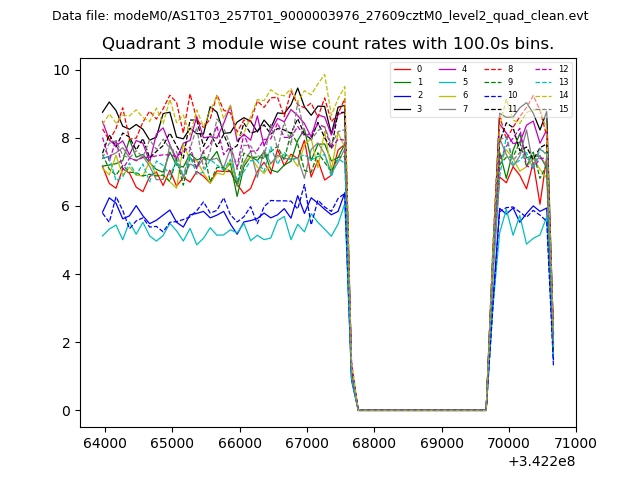
| Module-wise count rates for Quadrant A Data is divided into 100 sec bins |
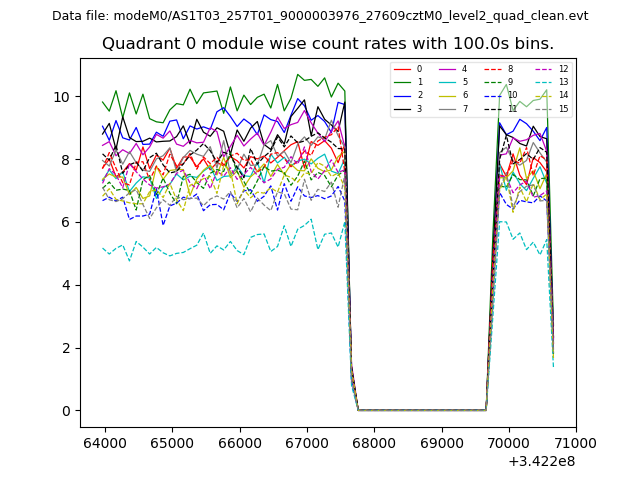 |
 |
| Module-wise count rates for Quadrant B Data is divided into 100 sec bins |
 |
 |
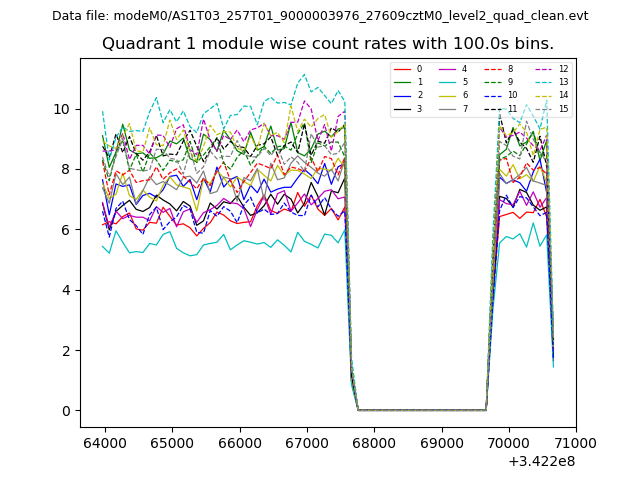
| Module-wise count rates for Quadrant C Data is divided into 100 sec bins |
 |
 |
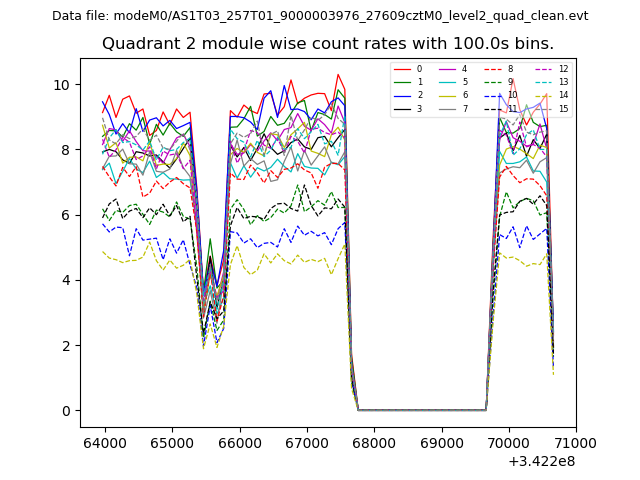
| Module-wise count rates for Quadrant D Data is divided into 100 sec bins |
 |
 |
| Parameter | Plot |
|---|---|
| CZT HV Monitor | 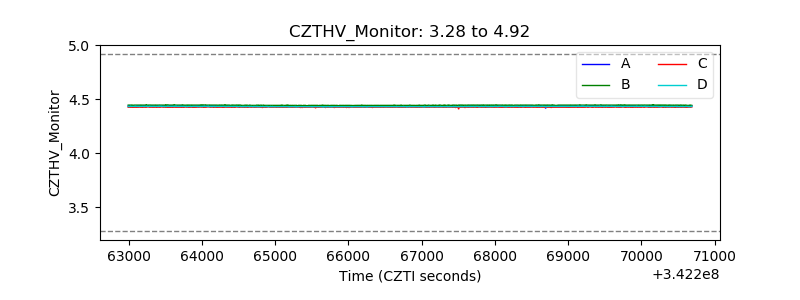 |
| D_VDD | 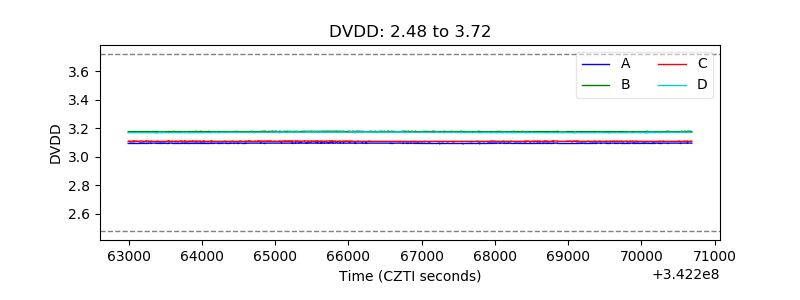 |
| Temperature 1 | 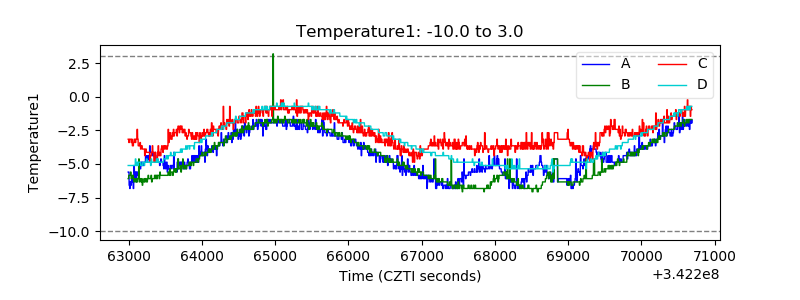 |
| Veto HV Monitor | 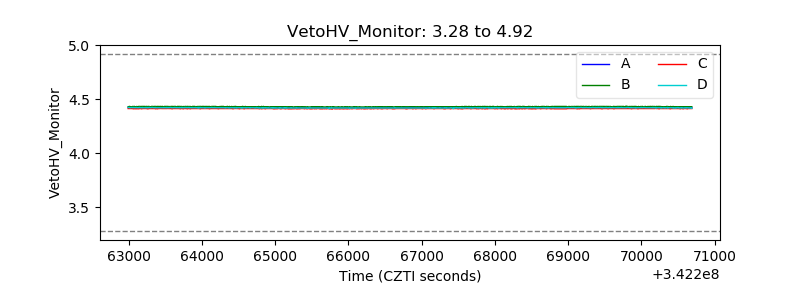 |
| Veto LLD | 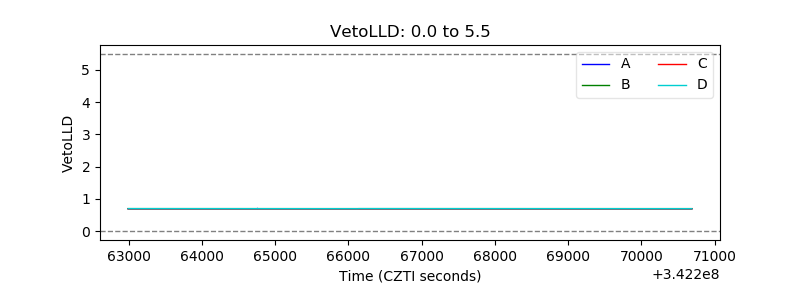 |
| Alpha Counter | 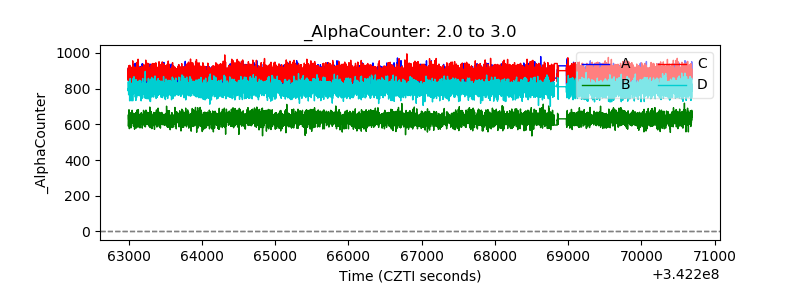 |
| _CPM_Rate |  |
| CZT Counter | 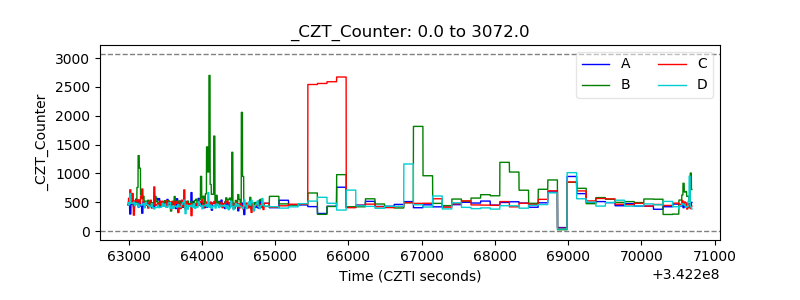 |
| +2.5 Volts monitor |  |
| +5 Volts monitor |  |
| _ROLL_ROT | 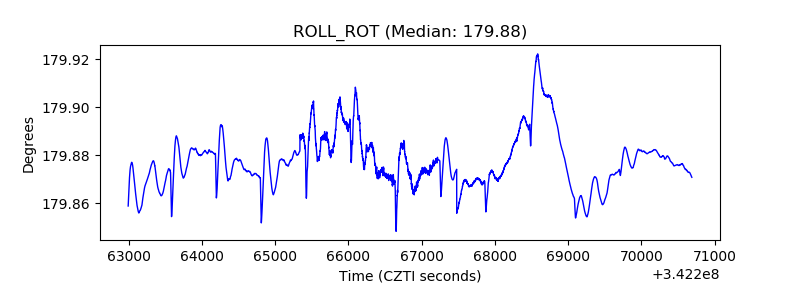 |
| _Roll_DEC | 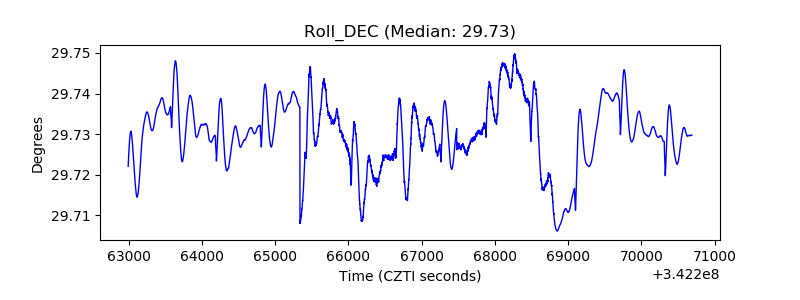 |
| _Roll_RA | 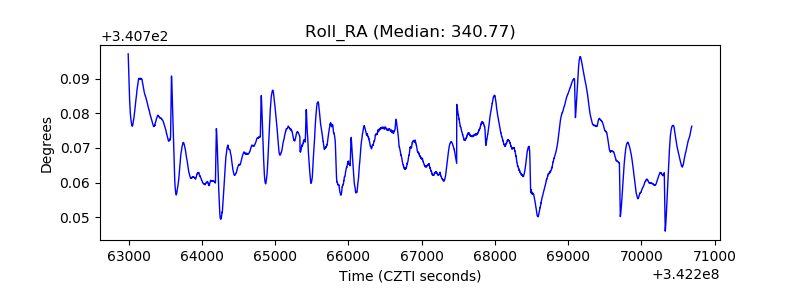 |
| Veto Counter | 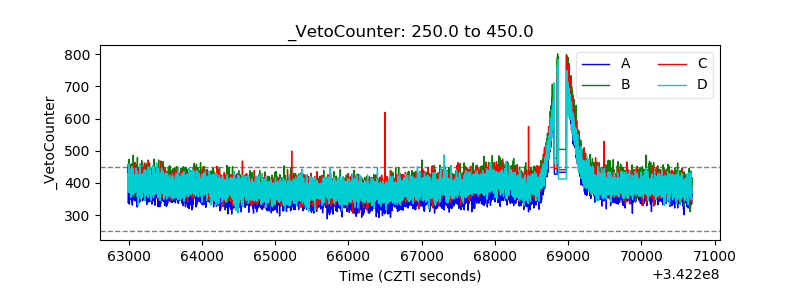 |