| Param | Original file | Final file |
|---|---|---|
| Filename | modeM0/AS1T03_257T01_9000003976_27612cztM0_level2.evt | modeM0/AS1T03_257T01_9000003976_27612cztM0_level2_quad_clean.evt |
| Size (bytes) | 1,310,146,560 | 240,163,200 |
| Size | 1.2 GB | 229.0 MB |
| Events in quadrant A | 8,220,469 | 1,553,914 |
| Events in quadrant B | 11,420,048 | 1,538,353 |
| Events in quadrant C | 8,381,721 | 1,499,613 |
| Events in quadrant D | 10,455,341 | 1,457,472 |
| Mode M9 | |||
|---|---|---|---|
| Quadrant | BADHDUFLAG | Total packets | Discarded packets |
| A | 0 | 20 | 0 |
| B | 0 | 20 | 0 |
| C | 0 | 20 | 0 |
| D | 0 | 20 | 0 |
| Mode M0 | |||
|---|---|---|---|
| Quadrant | BADHDUFLAG | Total packets | Discarded packets |
| A | 0 | 36233 | 0 |
| B | 0 | 45380 | 0 |
| C | 0 | 36363 | 0 |
| D | 0 | 43166 | 0 |
| Quadrant | Total seconds | Saturated seconds | Saturation percentage |
|---|---|---|---|
| A | 17764 | 127 | 0.714929% |
| B | 17763 | 895 | 5.038563% |
| C | 17763 | 178 | 1.002083% |
| D | 17764 | 360 | 2.026571% |
Noise dominated data is calculated using 1-second bins in cleaned event files. If a bin has >2000 counts, and if more than 50% of those come from <1% of pixels, then it is considered to be noise-dominated and hence unusable.
| Quadrant | # 1 sec bins | Bins with >0 counts | Bins with >2000 counts | High rate bins dominated by noise | Noise dominated (total time) | Noise dominated (detector-on time) | Marked lightcurve |
|---|---|---|---|---|---|---|---|
| A | 19709 | 17767 | 0 | 0 | 0.00% | 0.00% |  |
| B | 19708 | 17766 | 465 | 465 | 2.36% | 2.62% | 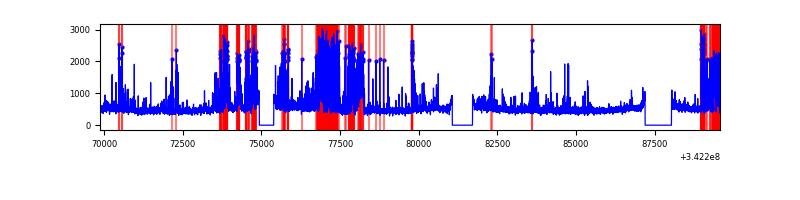 |
| C | 19708 | 17766 | 0 | 0 | 0.00% | 0.00% | 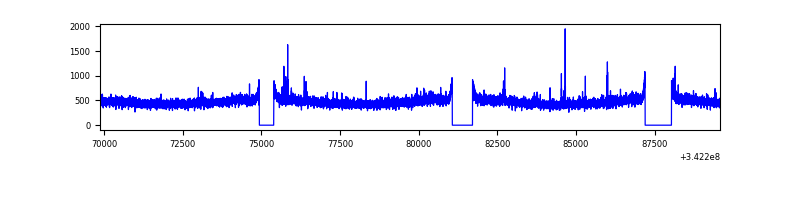 |
| D | 19709 | 17767 | 263 | 263 | 1.33% | 1.48% | 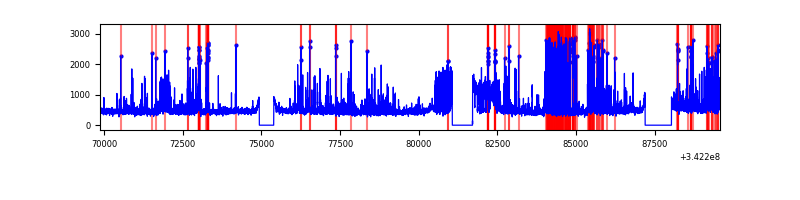 |
Top three noisy pixels from each quadrant. If the there are fewer than three noisy pixels in the level2.evt file, extra rows are filled as -1
| Pixel properties | Quadrant properties | ||||||
|---|---|---|---|---|---|---|---|
| Quadrant | DetID | PixID | Counts | Sigma | Mean | Median | Sigma |
| A | 13 | 254 | 27864 | 60.09 | 2126 | 2075 | 429.2 |
| A | 3 | 137 | 20676 | 43.34 | 2126 | 2075 | 429.2 |
| A | 0 | 226 | 18137 | 37.42 | 2126 | 2075 | 429.2 |
| B | 3 | 64 | 2010174 | 5049.29 | 2084 | 2028 | 397.7 |
| B | 10 | 245 | 819909 | 2056.48 | 2084 | 2028 | 397.7 |
| B | 0 | 230 | 134327 | 332.65 | 2084 | 2028 | 397.7 |
| C | 14 | 238 | 324191 | 673.17 | 2041 | 2053 | 478.5 |
| C | 15 | 208 | 33145 | 64.97 | 2041 | 2053 | 478.5 |
| C | 2 | 16 | 30955 | 60.4 | 2041 | 2053 | 478.5 |
| D | 1 | 52 | 1378513 | 2795.97 | 2054 | 1998 | 492.3 |
| D | 2 | 250 | 678099 | 1373.29 | 2054 | 1998 | 492.3 |
| D | 7 | 80 | 371185 | 749.89 | 2054 | 1998 | 492.3 |
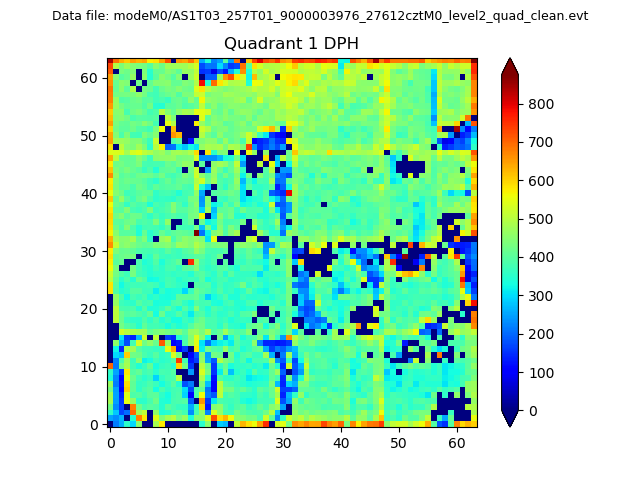
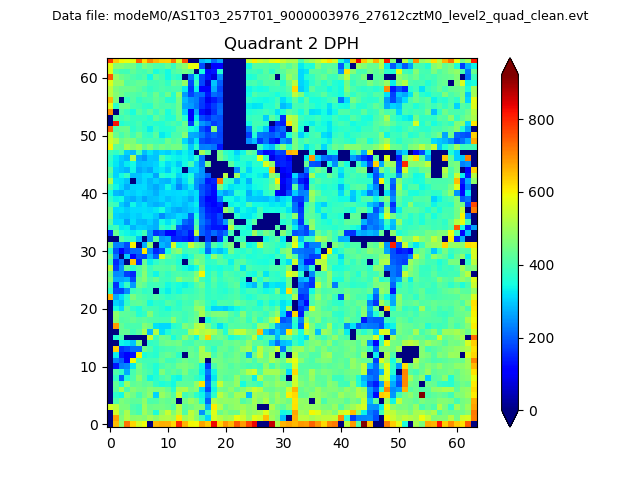
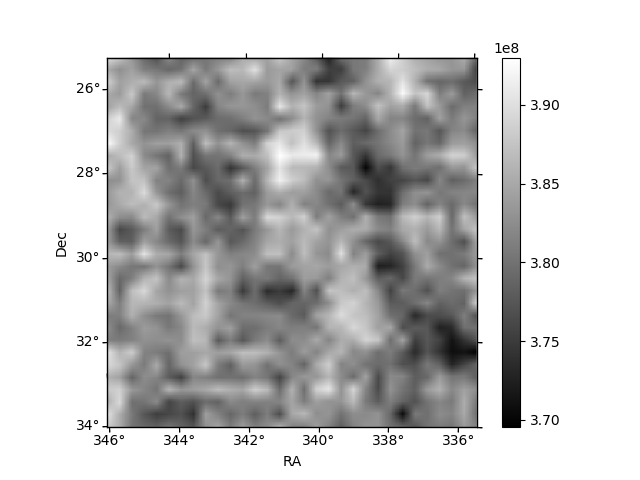
Histogram calculated using DETX and DETY for each event in the final _common_clean file
| Quadrant A |  |
 |
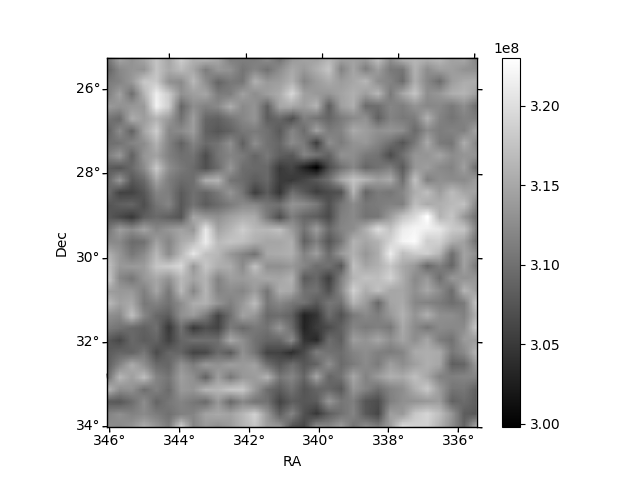
Quadrant B |
|---|---|---|---|
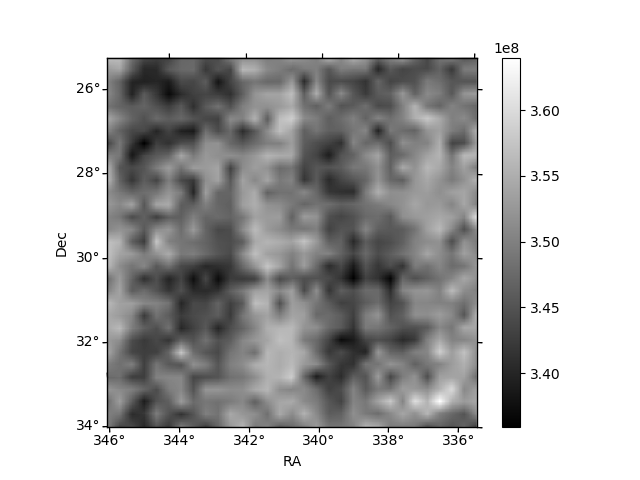
| Quadrant D | 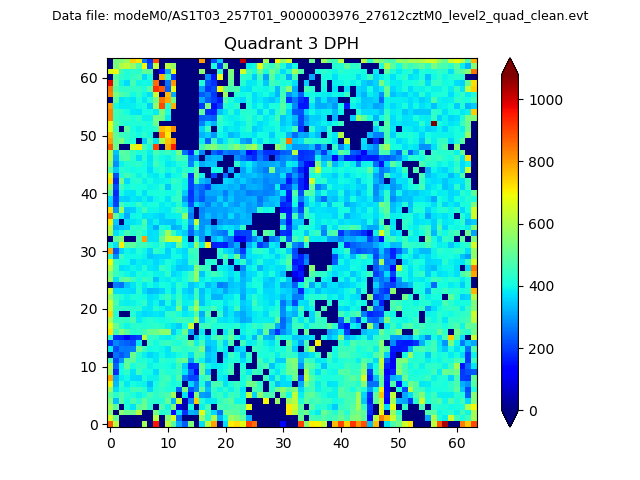 |
 |
Quadrant C |
| Plot type | Count rate plots | Images |
|---|---|---|
| Comparison with Poisson distribution Blue bars denote a histogram of data divided into 1 sec bins. Red curve is a Poisson curve with rate = median count rate of data. |
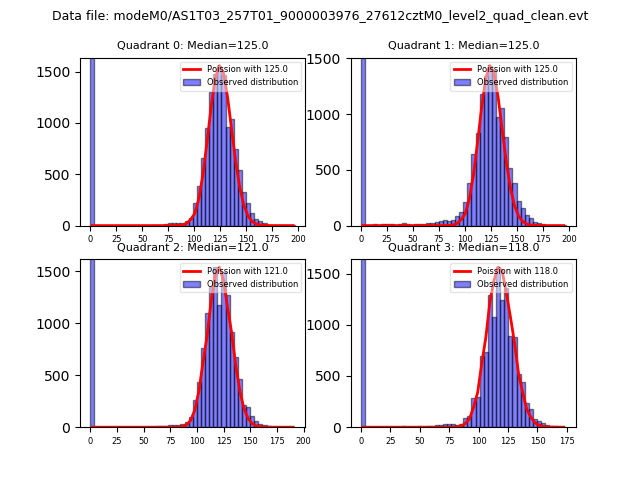 |
 |
| Quadrant-wise count rates Data is divided into 100 sec bins |
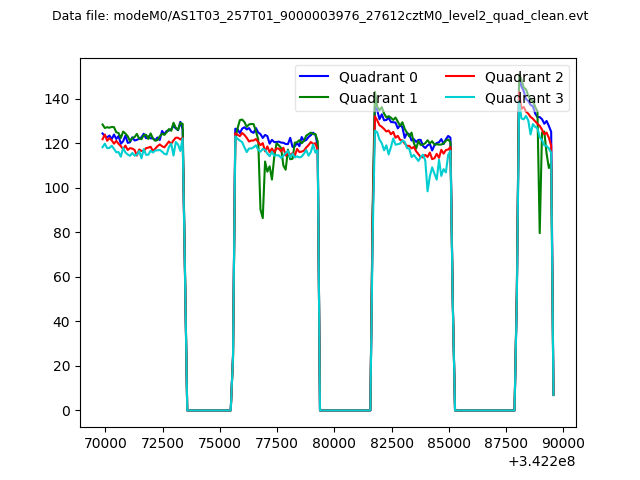 |
|
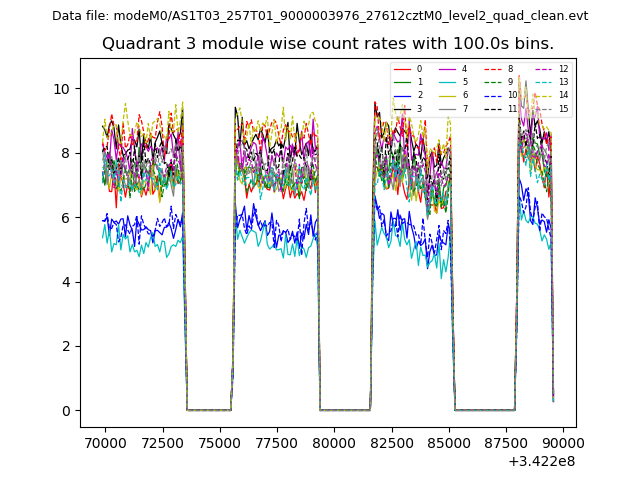
| Module-wise count rates for Quadrant A Data is divided into 100 sec bins |
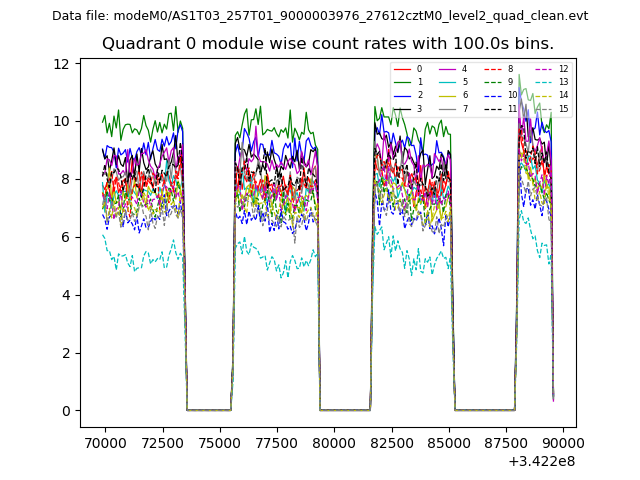 |
 |
| Module-wise count rates for Quadrant B Data is divided into 100 sec bins |
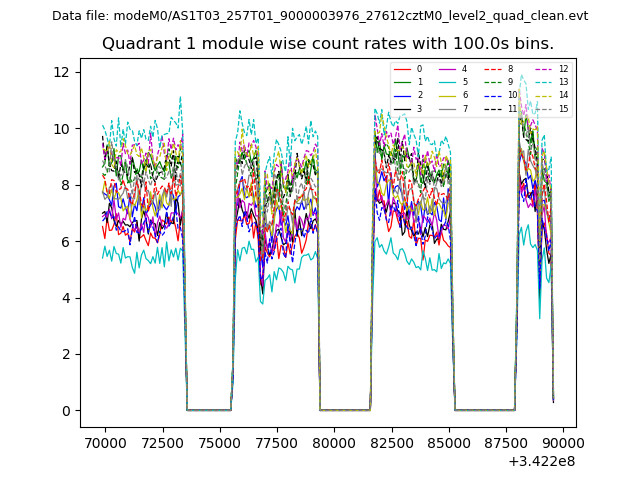 |
 |
| Module-wise count rates for Quadrant C Data is divided into 100 sec bins |
 |
 |
| Module-wise count rates for Quadrant D Data is divided into 100 sec bins |
 |
 |
| Parameter | Plot |
|---|---|
| CZT HV Monitor | 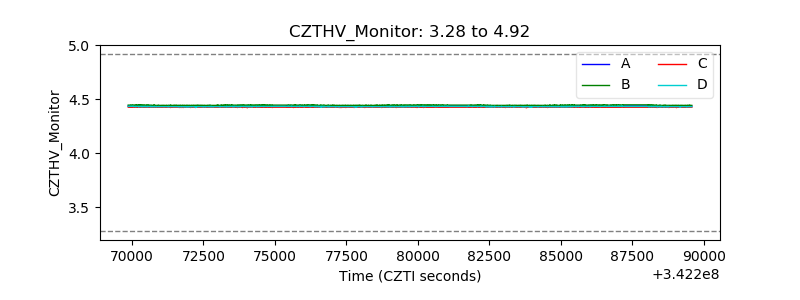 |
| D_VDD | 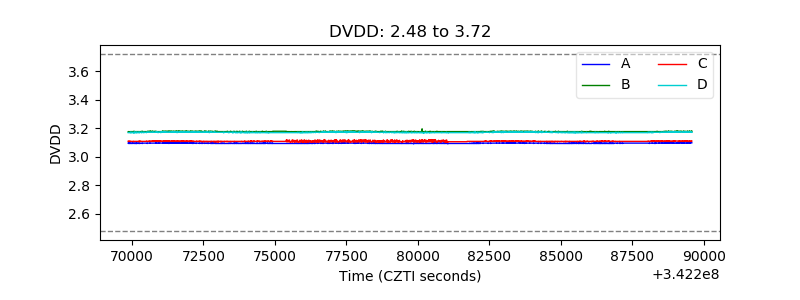 |
| Temperature 1 | 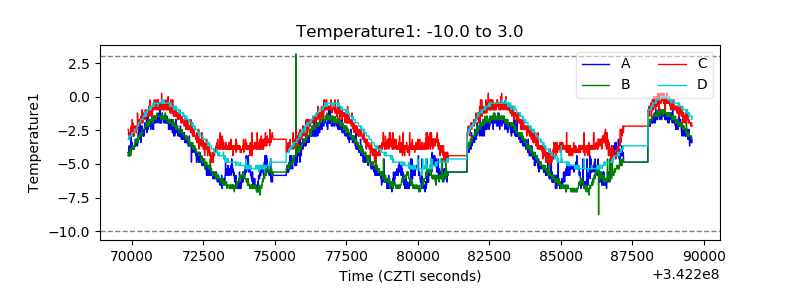 |
| Veto HV Monitor |  |
| Veto LLD | 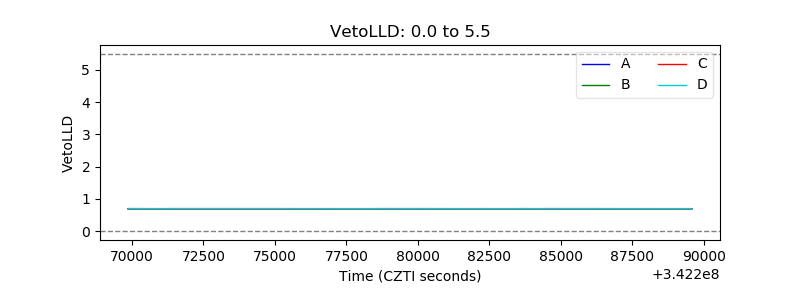 |
| Alpha Counter | 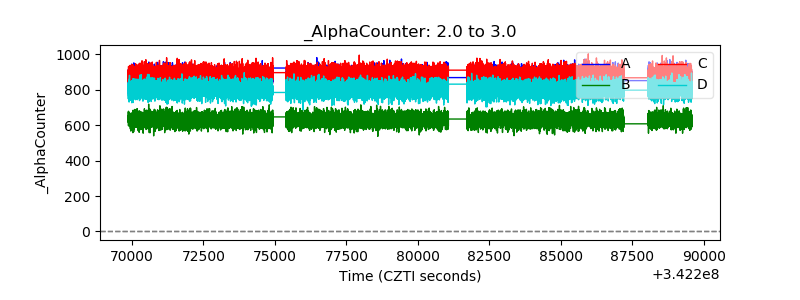 |
| _CPM_Rate | 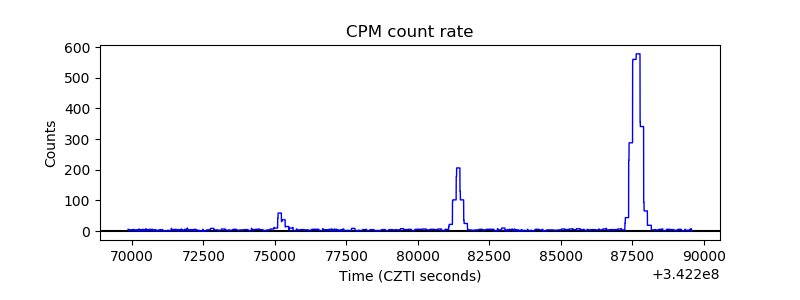 |
| CZT Counter | 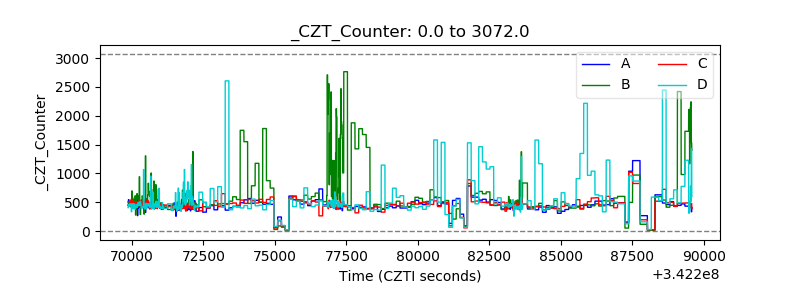 |
| +2.5 Volts monitor |  |
| +5 Volts monitor | 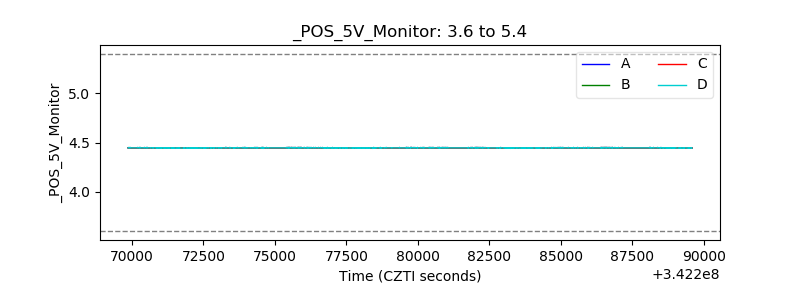 |
| _ROLL_ROT | 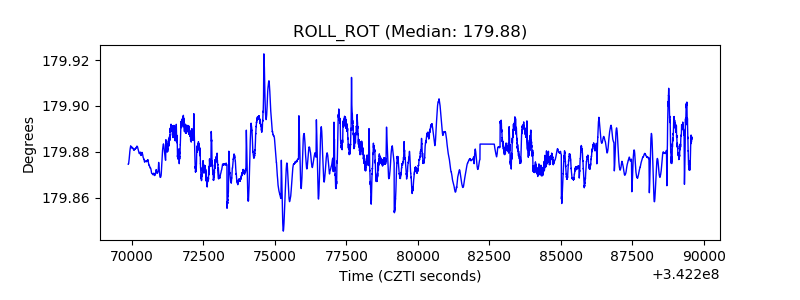 |
| _Roll_DEC | 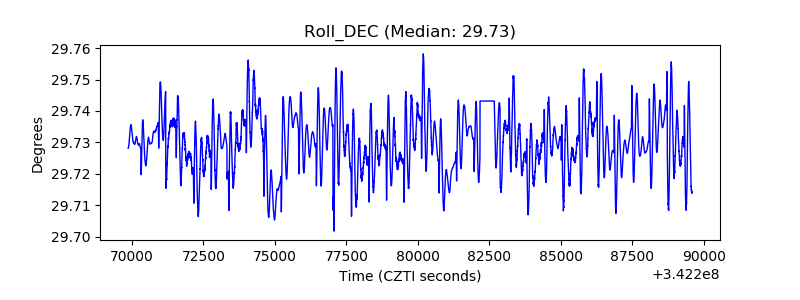 |
| _Roll_RA | 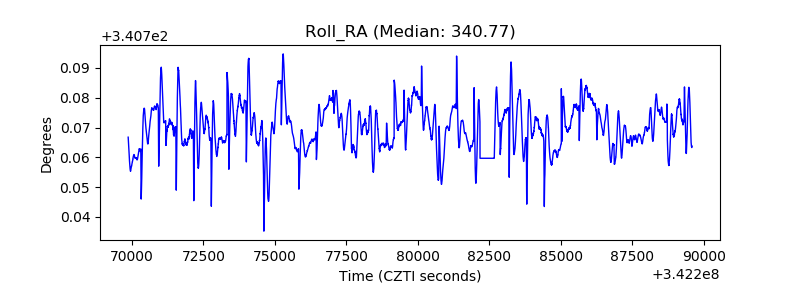 |
| Veto Counter | 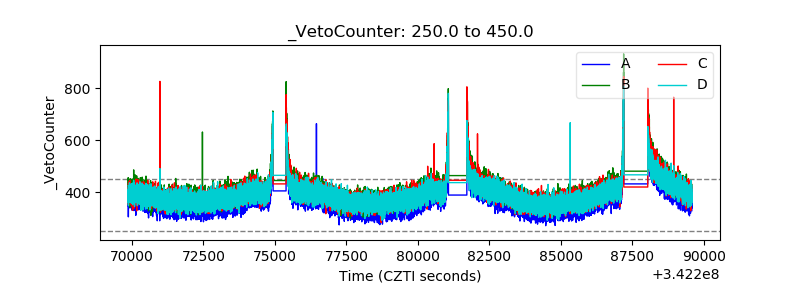 |