| Param | Original file | Final file |
|---|---|---|
| Filename | modeM0/AS1T03_257T01_9000003976_27613cztM0_level2.evt | modeM0/AS1T03_257T01_9000003976_27613cztM0_level2_quad_clean.evt |
| Size (bytes) | 513,046,080 | 85,786,560 |
| Size | 489.3 MB | 81.8 MB |
| Events in quadrant A | 2,967,401 | 558,923 |
| Events in quadrant B | 4,840,666 | 538,873 |
| Events in quadrant C | 3,068,406 | 537,924 |
| Events in quadrant D | 4,231,494 | 519,968 |
| Mode M9 | |||
|---|---|---|---|
| Quadrant | BADHDUFLAG | Total packets | Discarded packets |
| A | 0 | 10 | 0 |
| B | 0 | 10 | 0 |
| C | 0 | 10 | 0 |
| D | 0 | 10 | 0 |
| Mode M0 | |||
|---|---|---|---|
| Quadrant | BADHDUFLAG | Total packets | Discarded packets |
| A | 0 | 13008 | 0 |
| B | 0 | 18425 | 0 |
| C | 0 | 13265 | 0 |
| D | 0 | 16873 | 0 |
| Quadrant | Total seconds | Saturated seconds | Saturation percentage |
|---|---|---|---|
| A | 6332 | 37 | 0.584334% |
| B | 6333 | 765 | 12.079583% |
| C | 6333 | 66 | 1.042160% |
| D | 6333 | 181 | 2.858045% |
Noise dominated data is calculated using 1-second bins in cleaned event files. If a bin has >2000 counts, and if more than 50% of those come from <1% of pixels, then it is considered to be noise-dominated and hence unusable.
| Quadrant | # 1 sec bins | Bins with >0 counts | Bins with >2000 counts | High rate bins dominated by noise | Noise dominated (total time) | Noise dominated (detector-on time) | Marked lightcurve |
|---|---|---|---|---|---|---|---|
| A | 7367 | 6333 | 1 | 1 | 0.01% | 0.02% | 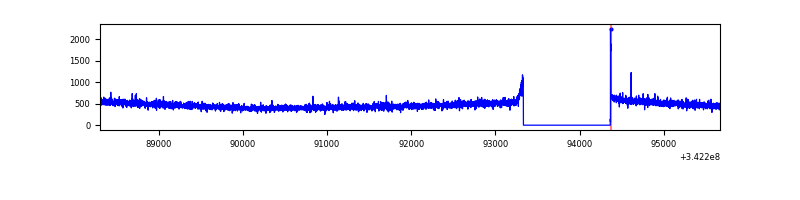 |
| B | 7368 | 6334 | 184 | 184 | 2.50% | 2.90% | 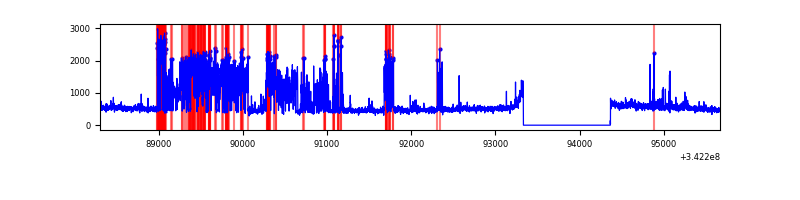 |
| C | 7368 | 6334 | 1 | 1 | 0.01% | 0.02% | 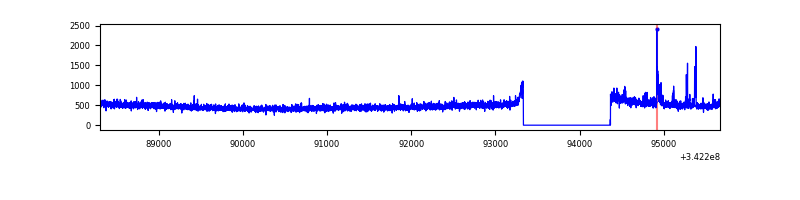 |
| D | 7368 | 6334 | 176 | 176 | 2.39% | 2.78% | 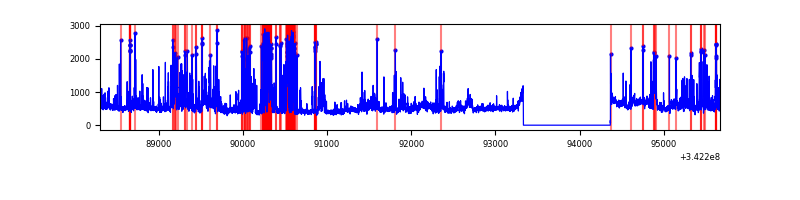 |
Top three noisy pixels from each quadrant. If the there are fewer than three noisy pixels in the level2.evt file, extra rows are filled as -1
| Pixel properties | Quadrant properties | ||||||
|---|---|---|---|---|---|---|---|
| Quadrant | DetID | PixID | Counts | Sigma | Mean | Median | Sigma |
| A | 13 | 254 | 10635 | 63.57 | 766 | 749 | 155.5 |
| A | 8 | 192 | 7350 | 42.45 | 766 | 749 | 155.5 |
| A | 3 | 137 | 7337 | 42.37 | 766 | 749 | 155.5 |
| B | 3 | 64 | 1721140 | 12282.24 | 739 | 720 | 140.1 |
| B | 10 | 245 | 108327 | 768.22 | 739 | 720 | 140.1 |
| B | 0 | 230 | 56055 | 395.04 | 739 | 720 | 140.1 |
| C | 14 | 238 | 117430 | 678.87 | 736 | 742 | 171.9 |
| C | 2 | 16 | 76288 | 439.51 | 736 | 742 | 171.9 |
| C | 13 | 61 | 5247 | 26.21 | 736 | 742 | 171.9 |
| D | 1 | 52 | 769993 | 4359.05 | 739 | 718 | 176.5 |
| D | 2 | 250 | 253280 | 1431.13 | 739 | 718 | 176.5 |
| D | 7 | 80 | 146584 | 826.54 | 739 | 718 | 176.5 |
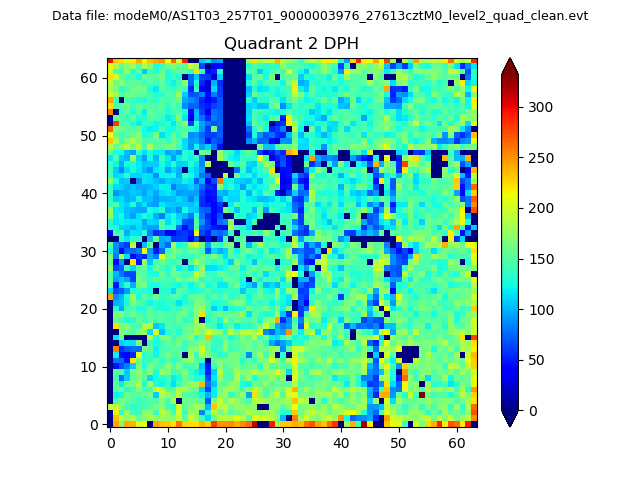
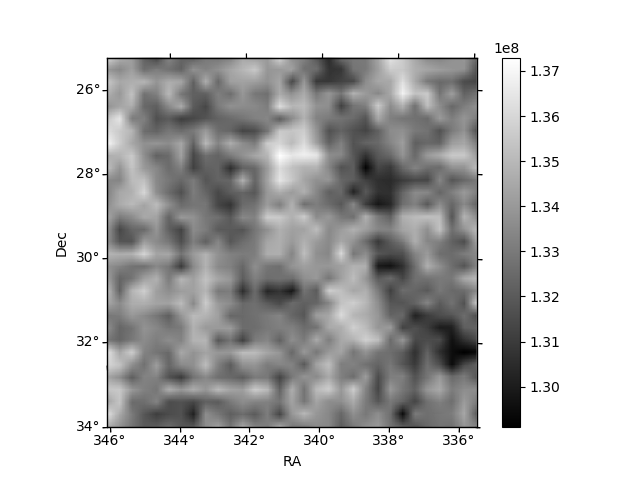
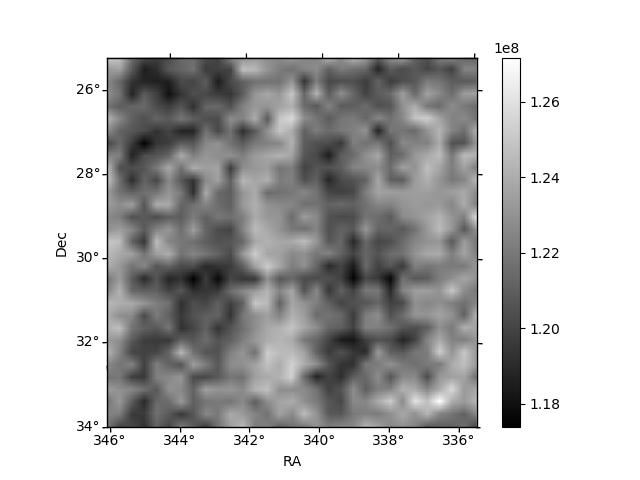
Histogram calculated using DETX and DETY for each event in the final _common_clean file
| Quadrant A | 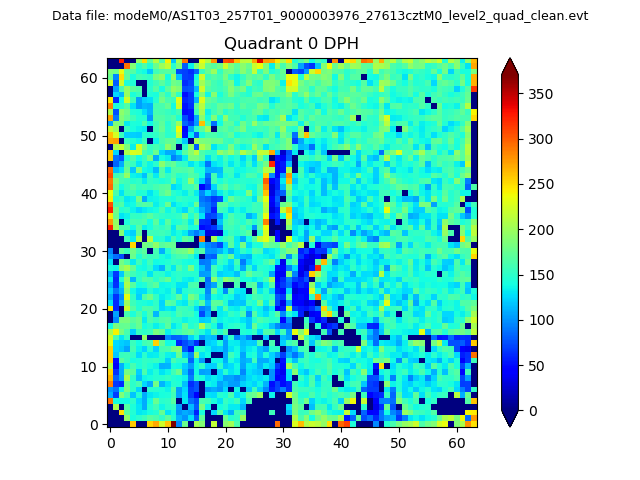 |
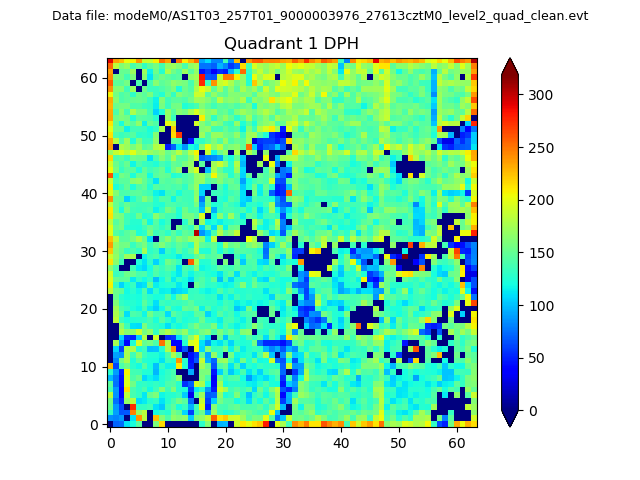 |
Quadrant B |
|---|---|---|---|
| Quadrant D | 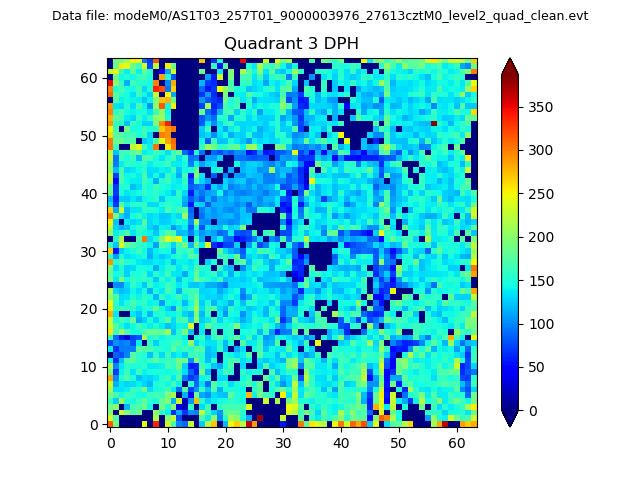 |
 |
Quadrant C |
| Plot type | Count rate plots | Images |
|---|---|---|
| Comparison with Poisson distribution Blue bars denote a histogram of data divided into 1 sec bins. Red curve is a Poisson curve with rate = median count rate of data. |
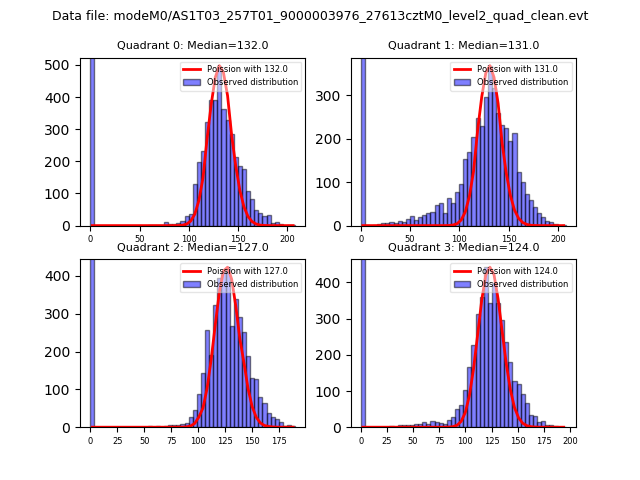 |
 |
| Quadrant-wise count rates Data is divided into 100 sec bins |
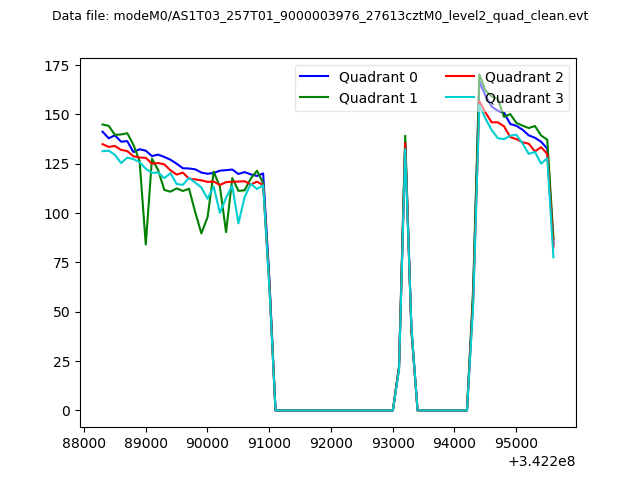 |
|
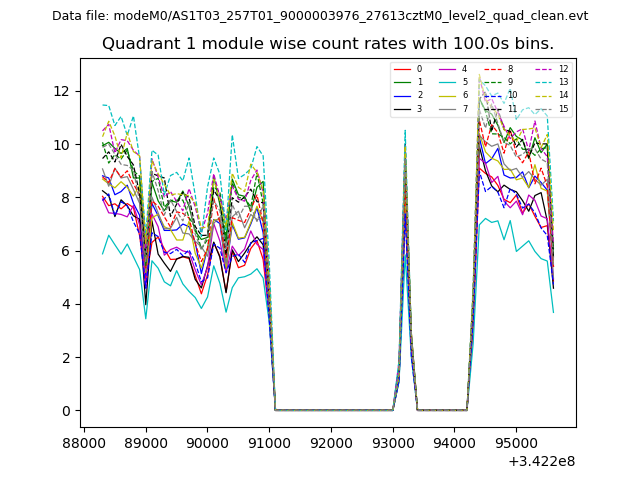
| Module-wise count rates for Quadrant A Data is divided into 100 sec bins |
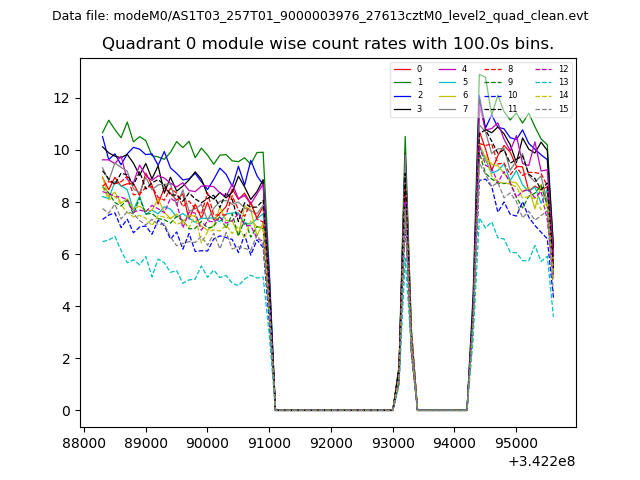 |
 |
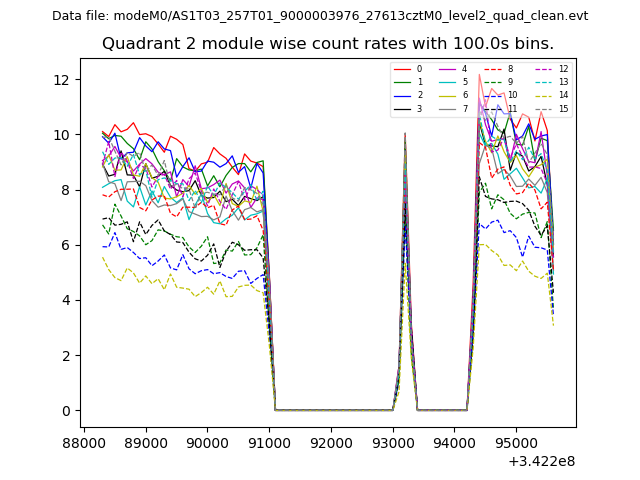
| Module-wise count rates for Quadrant B Data is divided into 100 sec bins |
 |
 |
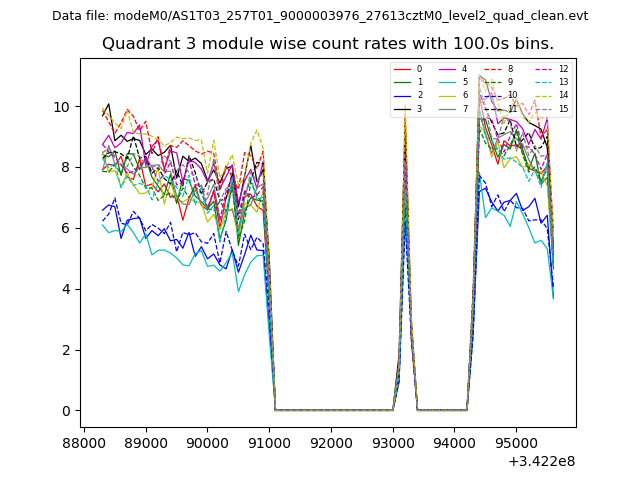
| Module-wise count rates for Quadrant C Data is divided into 100 sec bins |
 |
 |
| Module-wise count rates for Quadrant D Data is divided into 100 sec bins |
 |
 |
| Parameter | Plot |
|---|---|
| CZT HV Monitor |  |
| D_VDD | 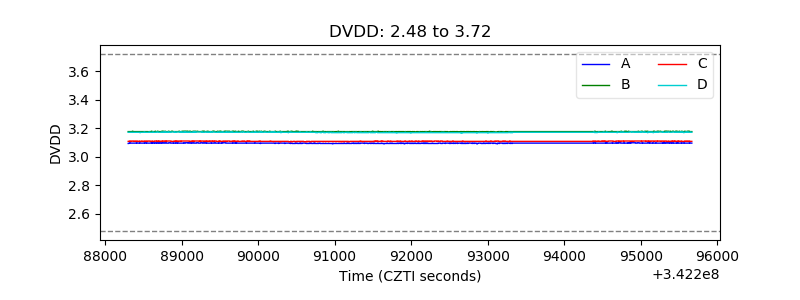 |
| Temperature 1 | 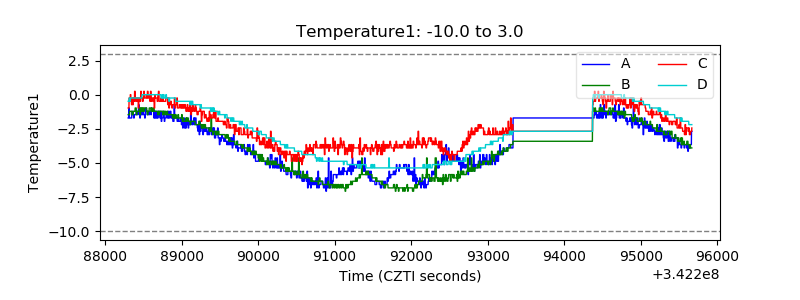 |
| Veto HV Monitor | 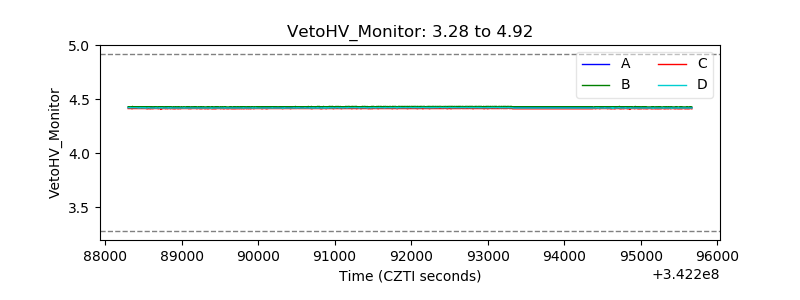 |
| Veto LLD |  |
| Alpha Counter | 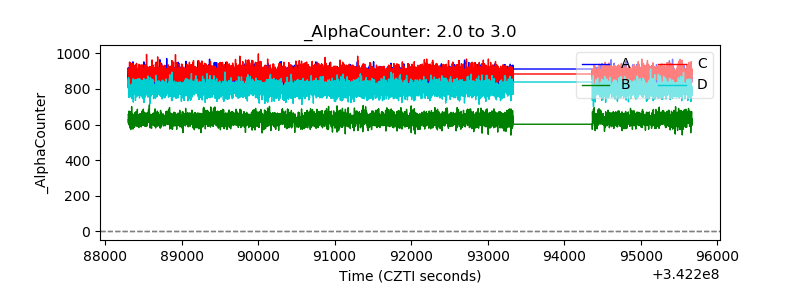 |
| _CPM_Rate | 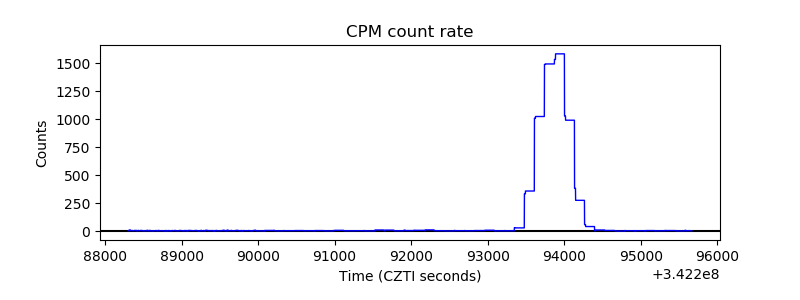 |
| CZT Counter | 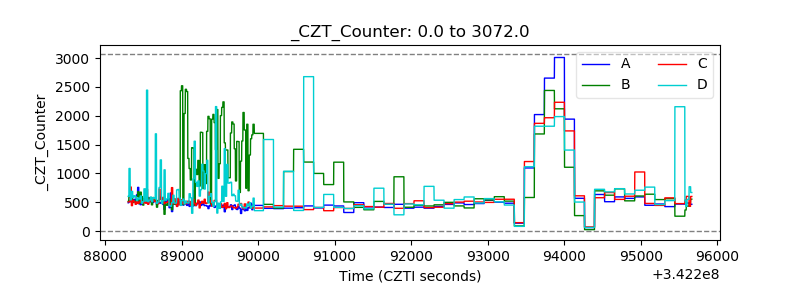 |
| +2.5 Volts monitor | 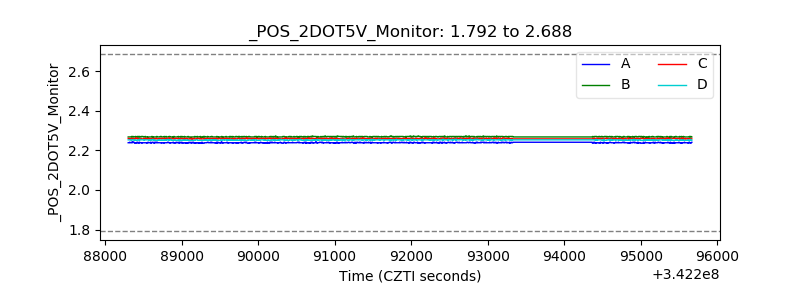 |
| +5 Volts monitor | 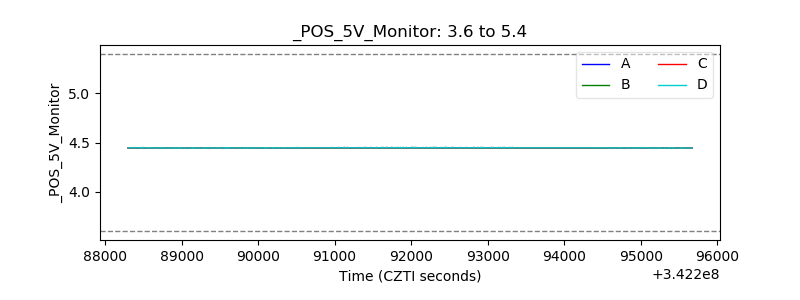 |
| _ROLL_ROT | 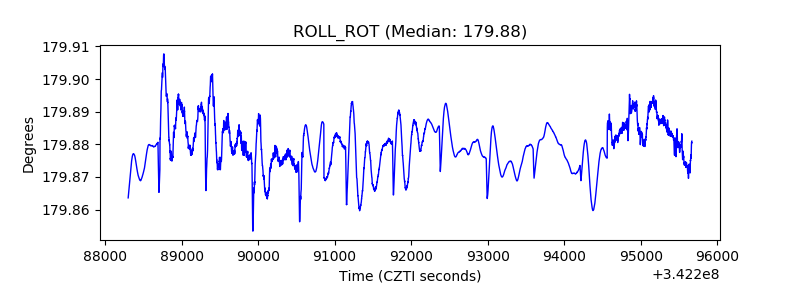 |
| _Roll_DEC | 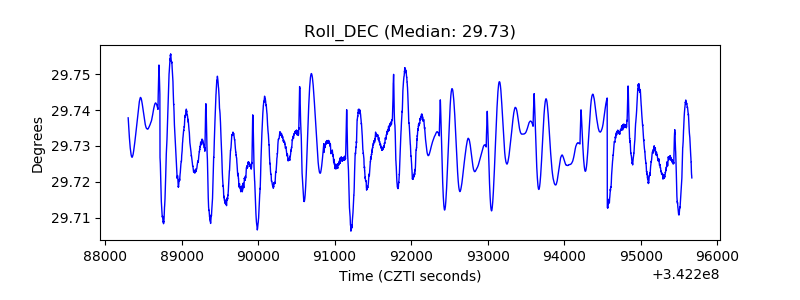 |
| _Roll_RA |  |
| Veto Counter | 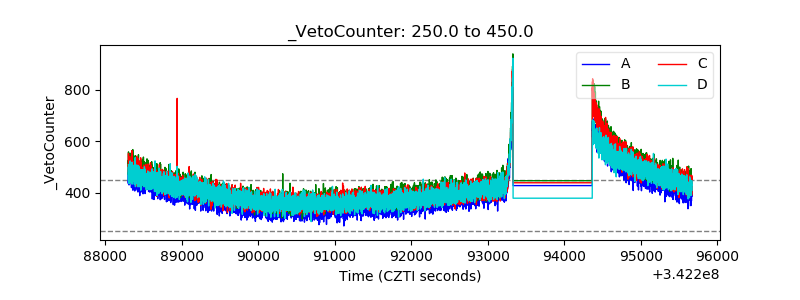 |