| Param | Original file | Final file |
|---|---|---|
| Filename | modeM0/AS1T03_257T01_9000003976_27615cztM0_level2.evt | modeM0/AS1T03_257T01_9000003976_27615cztM0_level2_quad_clean.evt |
| Size (bytes) | 492,920,640 | 95,402,880 |
| Size | 470.1 MB | 91.0 MB |
| Events in quadrant A | 3,120,628 | 625,066 |
| Events in quadrant B | 4,037,896 | 635,147 |
| Events in quadrant C | 3,265,600 | 600,892 |
| Events in quadrant D | 4,065,417 | 577,221 |
| Mode M9 | |||
|---|---|---|---|
| Quadrant | BADHDUFLAG | Total packets | Discarded packets |
| A | 0 | 13 | 0 |
| B | 0 | 14 | 0 |
| C | 0 | 14 | 0 |
| D | 0 | 14 | 0 |
| Mode M0 | |||
|---|---|---|---|
| Quadrant | BADHDUFLAG | Total packets | Discarded packets |
| A | 0 | 13532 | 0 |
| B | 0 | 16249 | 0 |
| C | 0 | 13891 | 0 |
| D | 0 | 16535 | 0 |
| Quadrant | Total seconds | Saturated seconds | Saturation percentage |
|---|---|---|---|
| A | 6461 | 31 | 0.479802% |
| B | 6461 | 105 | 1.625135% |
| C | 6461 | 66 | 1.021514% |
| D | 6461 | 135 | 2.089460% |
Noise dominated data is calculated using 1-second bins in cleaned event files. If a bin has >2000 counts, and if more than 50% of those come from <1% of pixels, then it is considered to be noise-dominated and hence unusable.
| Quadrant | # 1 sec bins | Bins with >0 counts | Bins with >2000 counts | High rate bins dominated by noise | Noise dominated (total time) | Noise dominated (detector-on time) | Marked lightcurve |
|---|---|---|---|---|---|---|---|
| A | 7611 | 6462 | 1 | 1 | 0.01% | 0.02% | 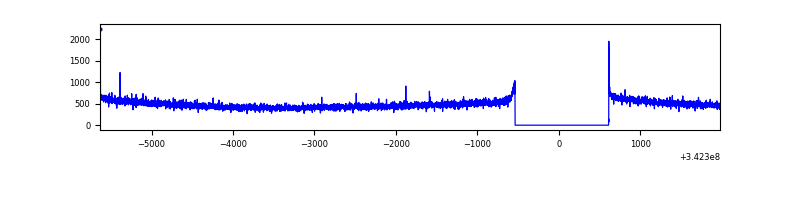 |
| B | 7611 | 6462 | 60 | 60 | 0.79% | 0.93% | 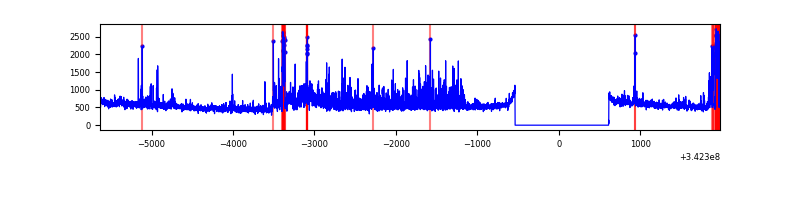 |
| C | 7611 | 6462 | 3 | 3 | 0.04% | 0.05% | 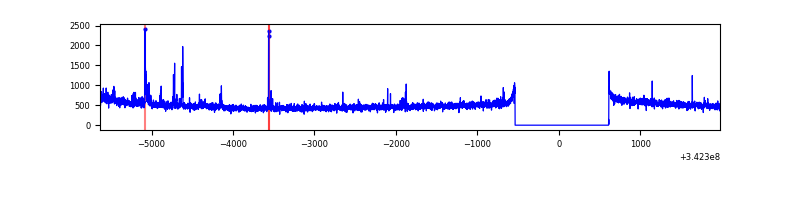 |
| D | 7611 | 6462 | 127 | 127 | 1.67% | 1.97% | 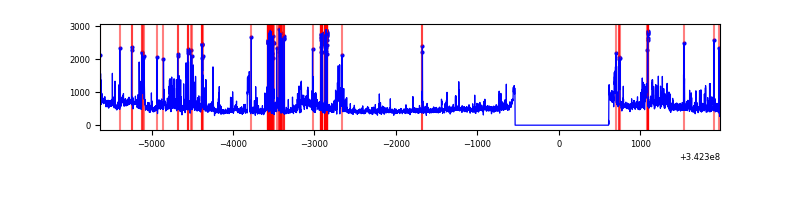 |
Top three noisy pixels from each quadrant. If the there are fewer than three noisy pixels in the level2.evt file, extra rows are filled as -1
| Pixel properties | Quadrant properties | ||||||
|---|---|---|---|---|---|---|---|
| Quadrant | DetID | PixID | Counts | Sigma | Mean | Median | Sigma |
| A | 8 | 192 | 12059 | 69.96 | 805 | 790 | 161.1 |
| A | 13 | 254 | 10810 | 62.21 | 805 | 790 | 161.1 |
| A | 3 | 137 | 7391 | 40.98 | 805 | 790 | 161.1 |
| B | 3 | 64 | 666355 | 4440.6 | 803 | 784 | 149.9 |
| B | 10 | 245 | 67219 | 443.25 | 803 | 784 | 149.9 |
| B | 0 | 230 | 57537 | 378.65 | 803 | 784 | 149.9 |
| C | 14 | 238 | 124371 | 681.86 | 778 | 783 | 181.3 |
| C | 2 | 16 | 95279 | 521.35 | 778 | 783 | 181.3 |
| C | 10 | 22 | 6371 | 30.83 | 778 | 783 | 181.3 |
| D | 1 | 52 | 609854 | 3295.82 | 776 | 754 | 184.8 |
| D | 7 | 80 | 151272 | 814.45 | 776 | 754 | 184.8 |
| D | 6 | 112 | 126796 | 682.01 | 776 | 754 | 184.8 |
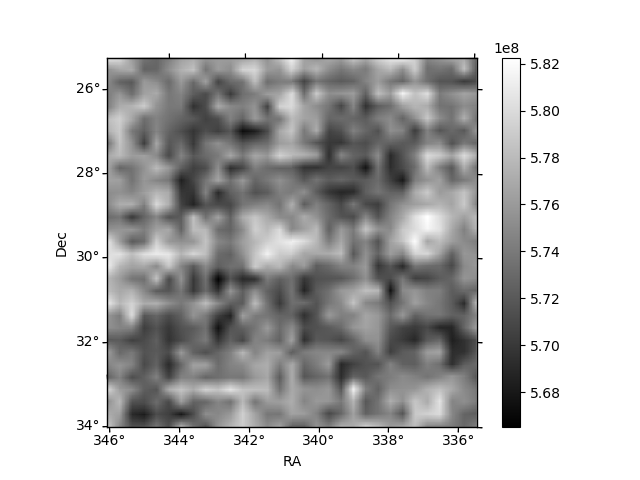
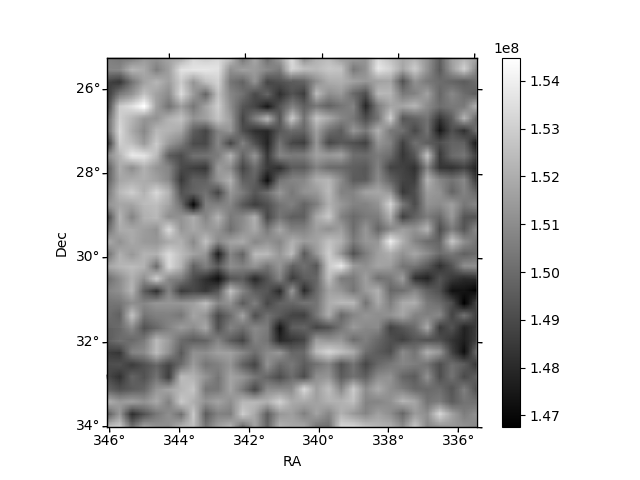
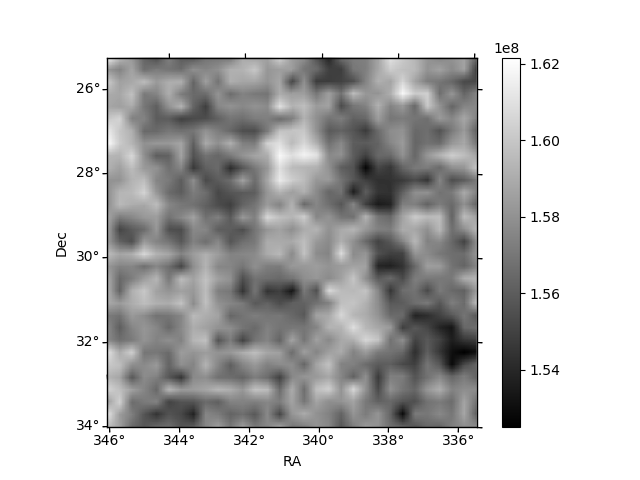
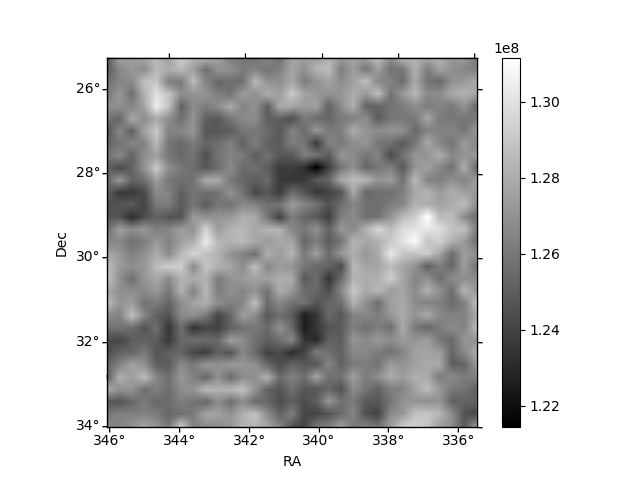
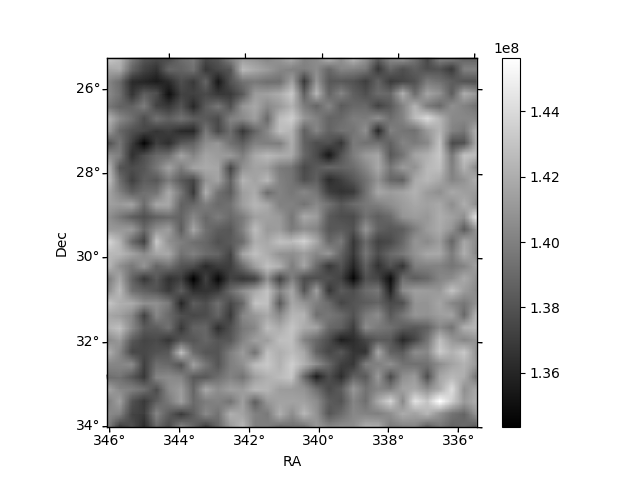
Histogram calculated using DETX and DETY for each event in the final _common_clean file
| Quadrant A | 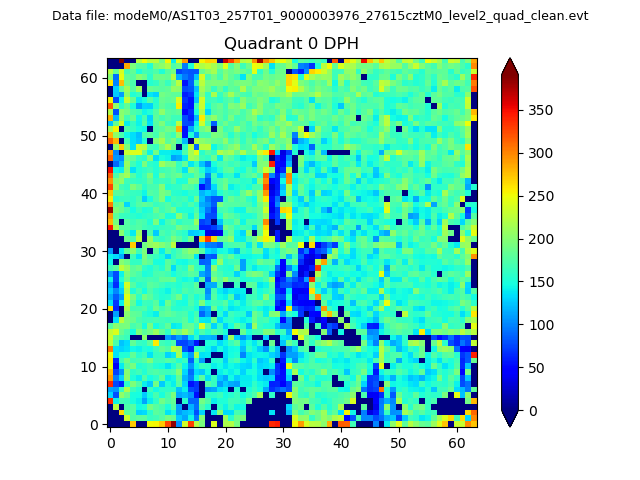 |
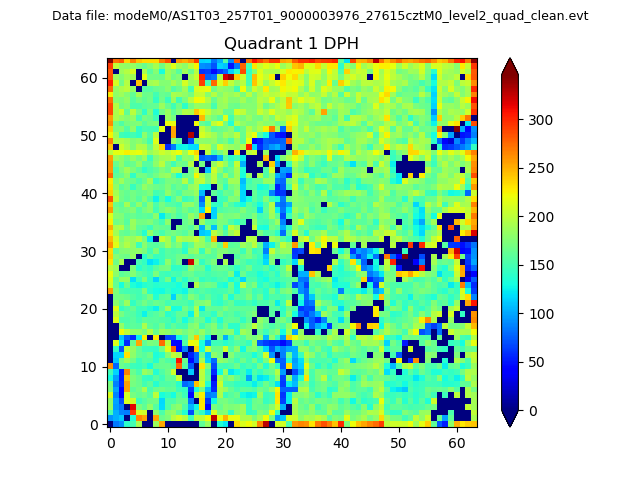 |
Quadrant B |
|---|---|---|---|
| Quadrant D | 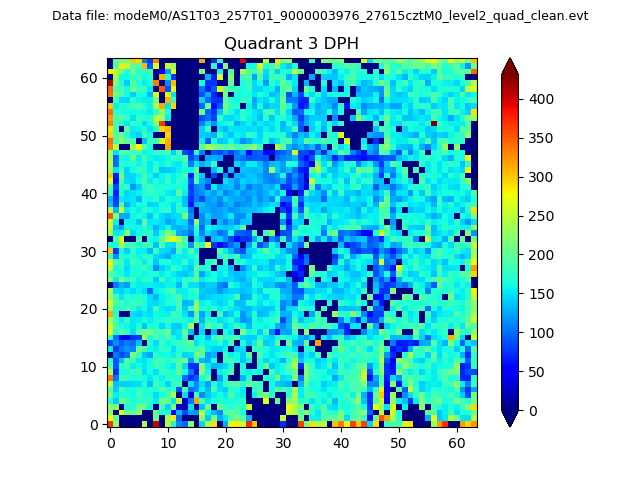 |
 |
Quadrant C |
| Plot type | Count rate plots | Images |
|---|---|---|
| Comparison with Poisson distribution Blue bars denote a histogram of data divided into 1 sec bins. Red curve is a Poisson curve with rate = median count rate of data. |
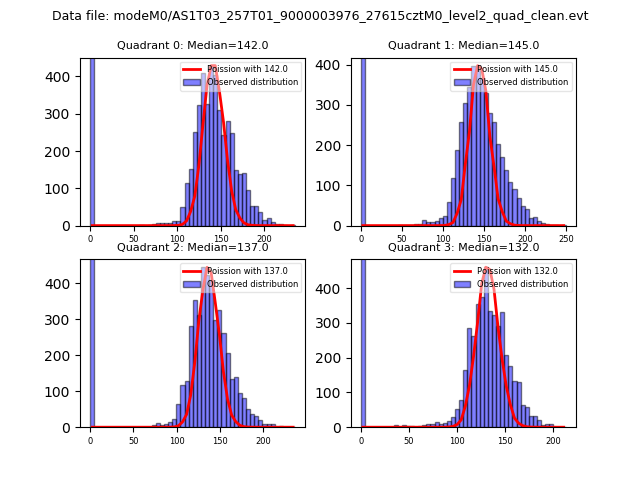 |
 |
| Quadrant-wise count rates Data is divided into 100 sec bins |
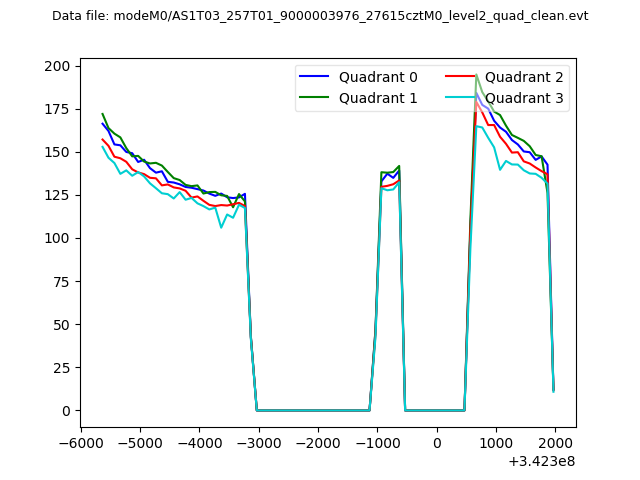 |
|
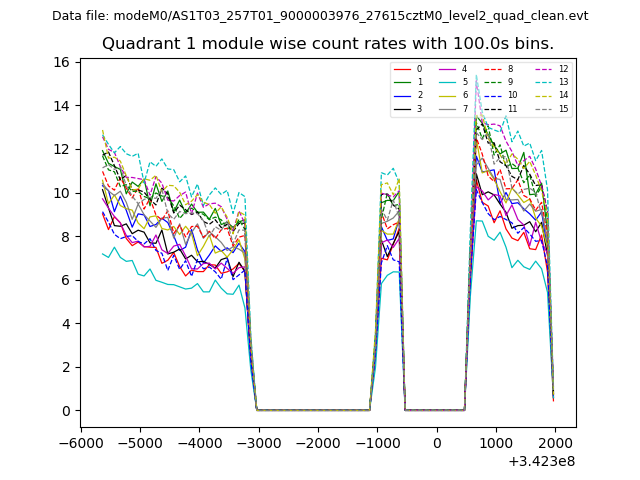
| Module-wise count rates for Quadrant A Data is divided into 100 sec bins |
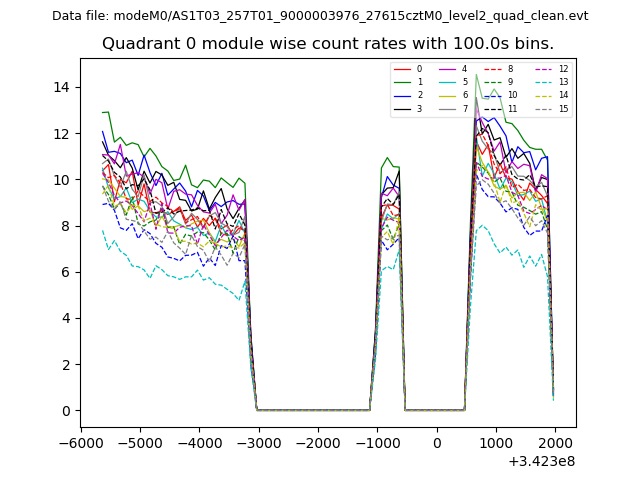 |
 |
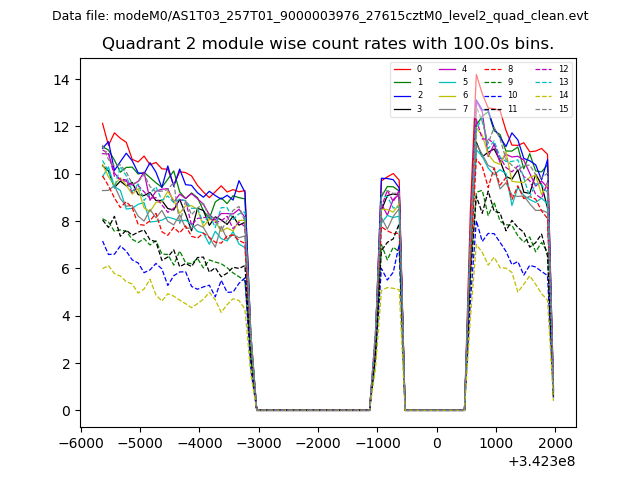
| Module-wise count rates for Quadrant B Data is divided into 100 sec bins |
 |
 |
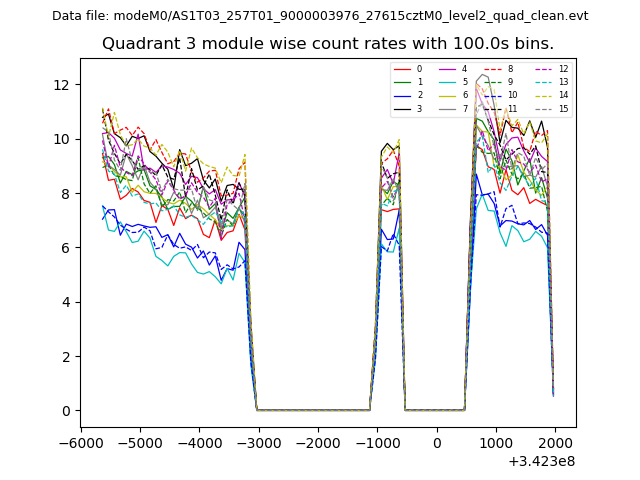
| Module-wise count rates for Quadrant C Data is divided into 100 sec bins |
 |
 |
| Module-wise count rates for Quadrant D Data is divided into 100 sec bins |
 |
 |
| Parameter | Plot |
|---|---|
| CZT HV Monitor | 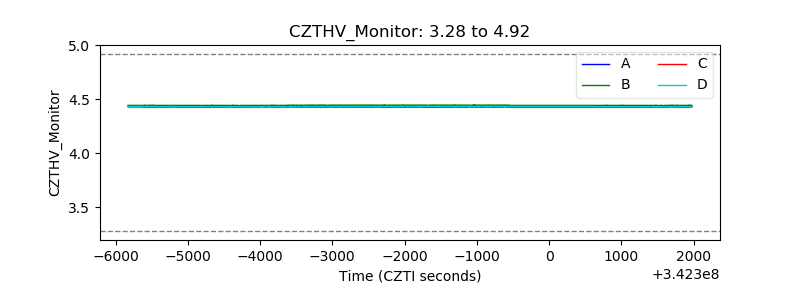 |
| D_VDD | 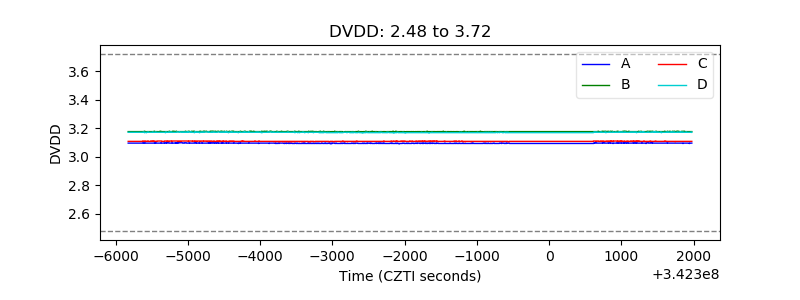 |
| Temperature 1 | 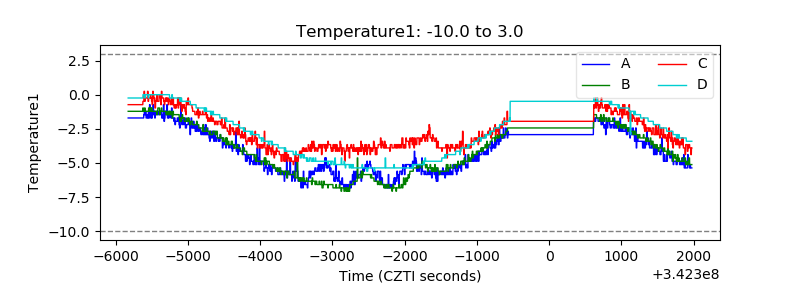 |
| Veto HV Monitor | 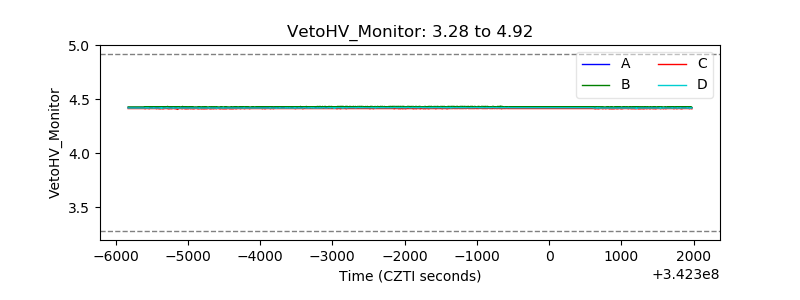 |
| Veto LLD | 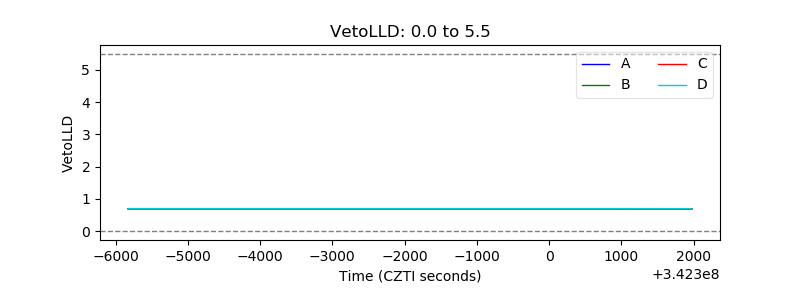 |
| Alpha Counter | 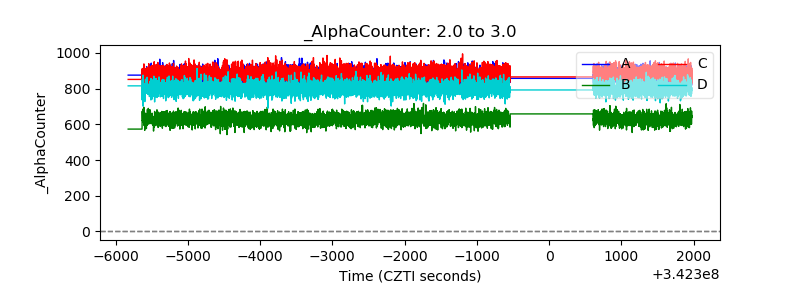 |
| _CPM_Rate | 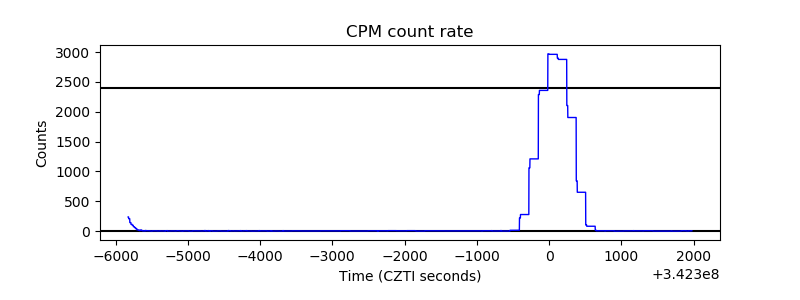 |
| CZT Counter | 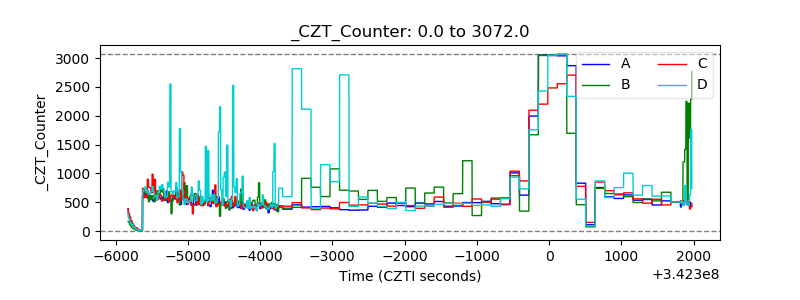 |
| +2.5 Volts monitor |  |
| +5 Volts monitor | 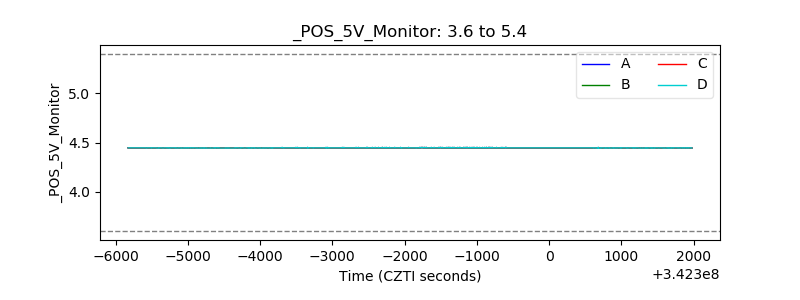 |
| _ROLL_ROT | 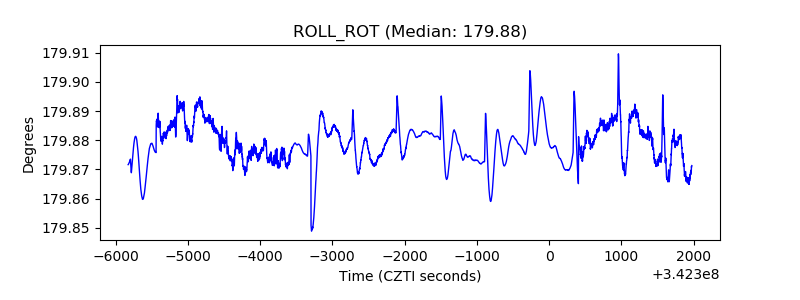 |
| _Roll_DEC | 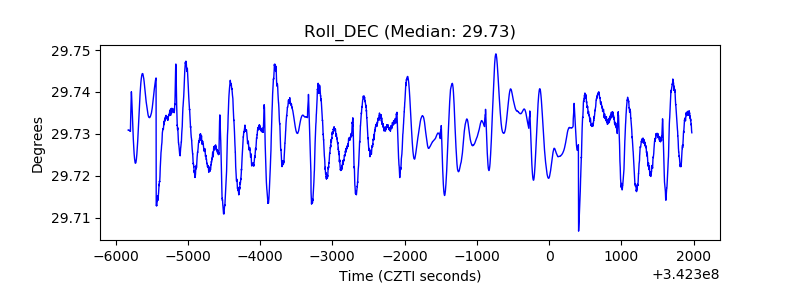 |
| _Roll_RA | 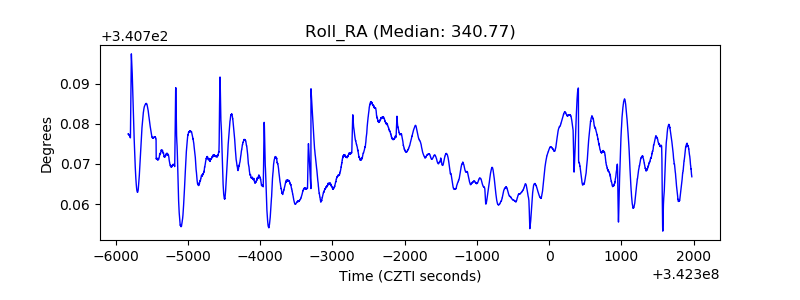 |
| Veto Counter | 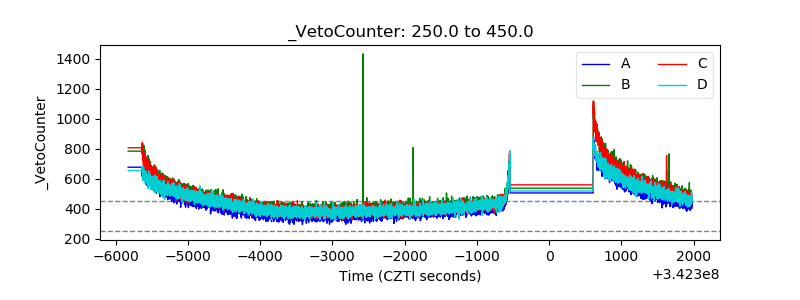 |