| Param | Original file | Final file |
|---|---|---|
| Filename | modeM0/AS1T03_257T01_9000003976_27616cztM0_level2.evt | modeM0/AS1T03_257T01_9000003976_27616cztM0_level2_quad_clean.evt |
| Size (bytes) | 496,353,600 | 99,302,400 |
| Size | 473.4 MB | 94.7 MB |
| Events in quadrant A | 3,193,948 | 657,164 |
| Events in quadrant B | 4,240,692 | 668,356 |
| Events in quadrant C | 3,248,815 | 636,203 |
| Events in quadrant D | 3,917,635 | 602,356 |
| Mode M9 | |||
|---|---|---|---|
| Quadrant | BADHDUFLAG | Total packets | Discarded packets |
| A | 0 | 15 | 0 |
| B | 0 | 16 | 0 |
| C | 0 | 16 | 0 |
| D | 0 | 16 | 0 |
| Mode M0 | |||
|---|---|---|---|
| Quadrant | BADHDUFLAG | Total packets | Discarded packets |
| A | 0 | 13502 | 0 |
| B | 0 | 16770 | 0 |
| C | 0 | 13619 | 0 |
| D | 0 | 15665 | 0 |
| Quadrant | Total seconds | Saturated seconds | Saturation percentage |
|---|---|---|---|
| A | 6349 | 33 | 0.519767% |
| B | 6349 | 212 | 3.339109% |
| C | 6349 | 63 | 0.992282% |
| D | 6349 | 75 | 1.181288% |
Noise dominated data is calculated using 1-second bins in cleaned event files. If a bin has >2000 counts, and if more than 50% of those come from <1% of pixels, then it is considered to be noise-dominated and hence unusable.
| Quadrant | # 1 sec bins | Bins with >0 counts | Bins with >2000 counts | High rate bins dominated by noise | Noise dominated (total time) | Noise dominated (detector-on time) | Marked lightcurve |
|---|---|---|---|---|---|---|---|
| A | 7604 | 6350 | 1 | 1 | 0.01% | 0.02% | 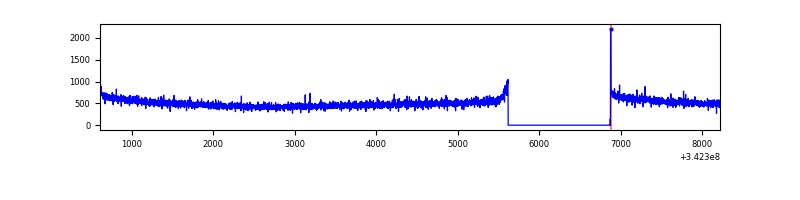 |
| B | 7604 | 6350 | 134 | 134 | 1.76% | 2.11% | 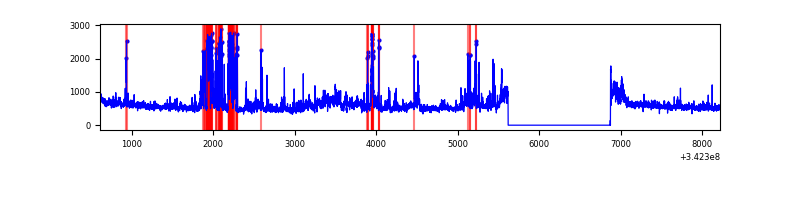 |
| C | 7604 | 6349 | 0 | 0 | 0.00% | 0.00% | 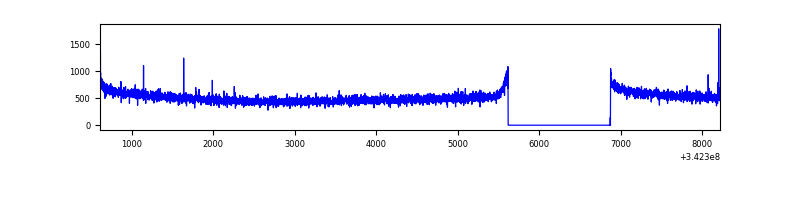 |
| D | 7604 | 6350 | 59 | 59 | 0.78% | 0.93% | 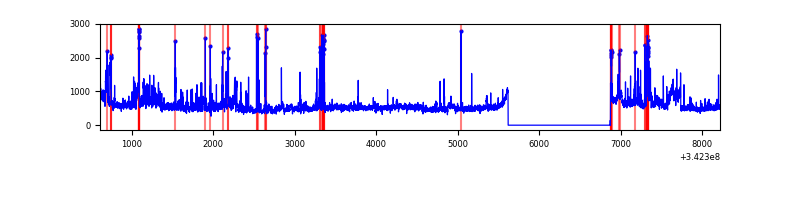 |
Top three noisy pixels from each quadrant. If the there are fewer than three noisy pixels in the level2.evt file, extra rows are filled as -1
| Pixel properties | Quadrant properties | ||||||
|---|---|---|---|---|---|---|---|
| Quadrant | DetID | PixID | Counts | Sigma | Mean | Median | Sigma |
| A | 8 | 192 | 11634 | 65.94 | 821 | 806 | 164.2 |
| A | 4 | 2 | 11509 | 65.18 | 821 | 806 | 164.2 |
| A | 13 | 254 | 11301 | 63.91 | 821 | 806 | 164.2 |
| B | 3 | 64 | 773692 | 5061.78 | 819 | 799 | 152.7 |
| B | 10 | 245 | 109104 | 709.3 | 819 | 799 | 152.7 |
| B | 4 | 200 | 64064 | 414.33 | 819 | 799 | 152.7 |
| C | 14 | 238 | 128447 | 684.11 | 797 | 804 | 186.6 |
| C | 2 | 16 | 6816 | 32.22 | 797 | 804 | 186.6 |
| C | 13 | 61 | 5572 | 25.55 | 797 | 804 | 186.6 |
| D | 1 | 52 | 422944 | 2224.26 | 790 | 769 | 189.8 |
| D | 7 | 80 | 226900 | 1191.39 | 790 | 769 | 189.8 |
| D | 2 | 250 | 141254 | 740.15 | 790 | 769 | 189.8 |
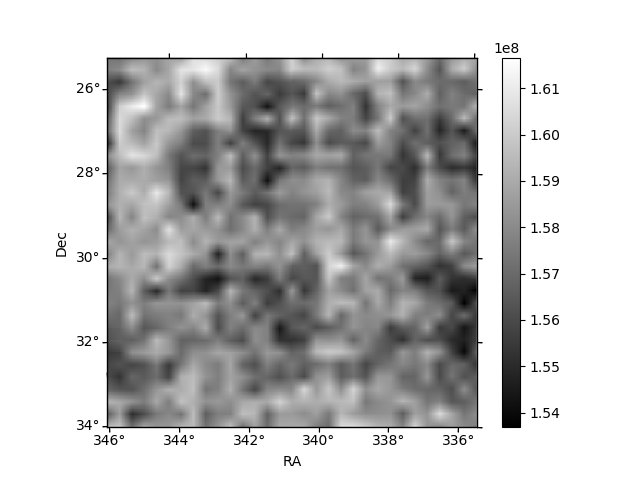
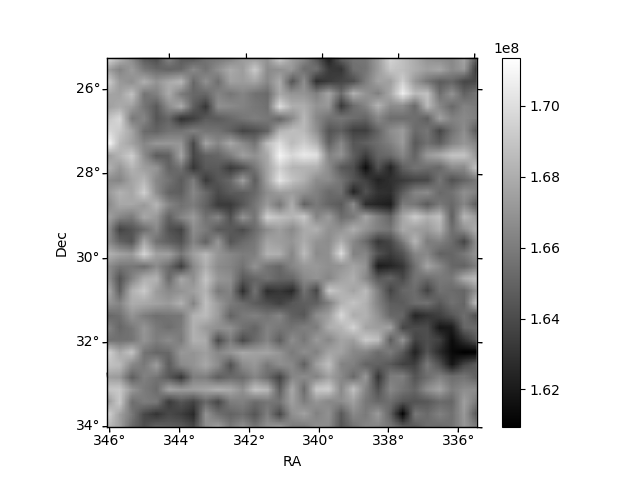
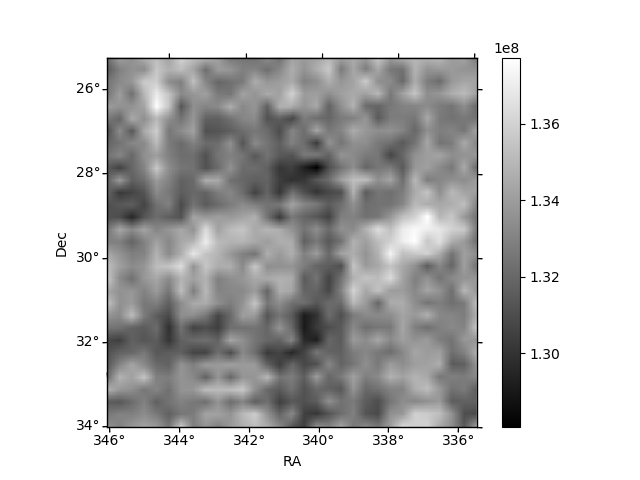
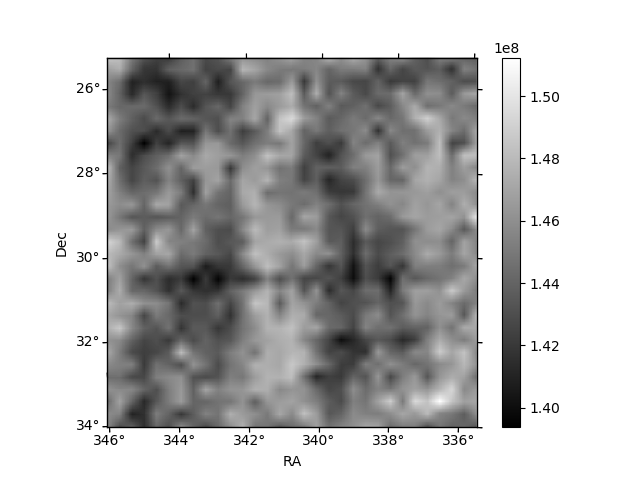
Histogram calculated using DETX and DETY for each event in the final _common_clean file
| Quadrant A | 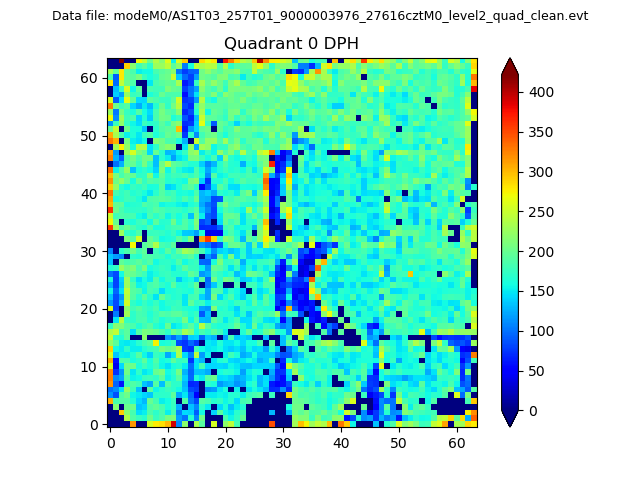 |
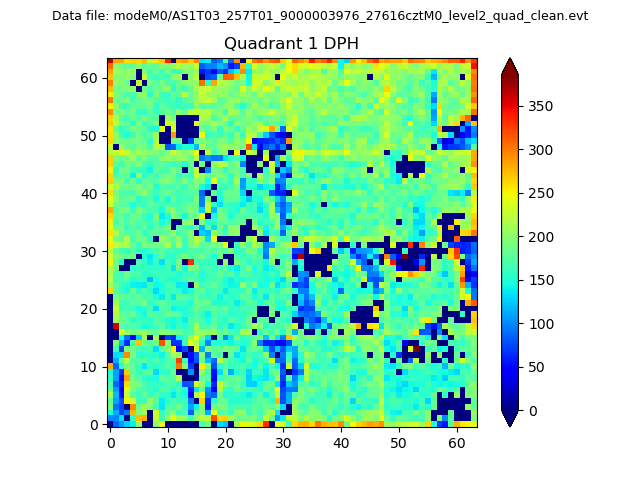 |
Quadrant B |
|---|---|---|---|
| Quadrant D | 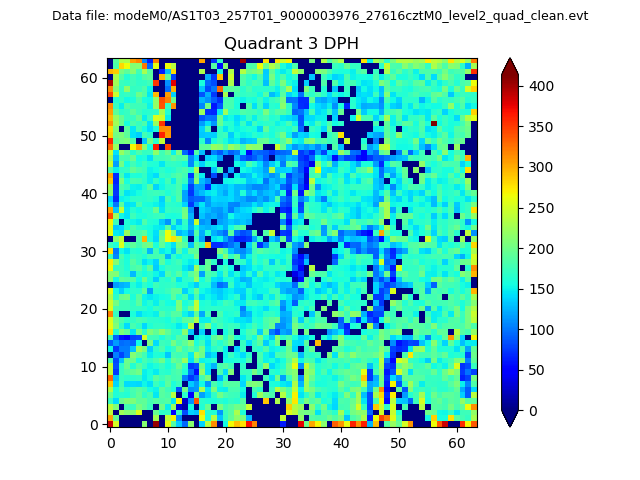 |
 |
Quadrant C |
| Plot type | Count rate plots | Images |
|---|---|---|
| Comparison with Poisson distribution Blue bars denote a histogram of data divided into 1 sec bins. Red curve is a Poisson curve with rate = median count rate of data. |
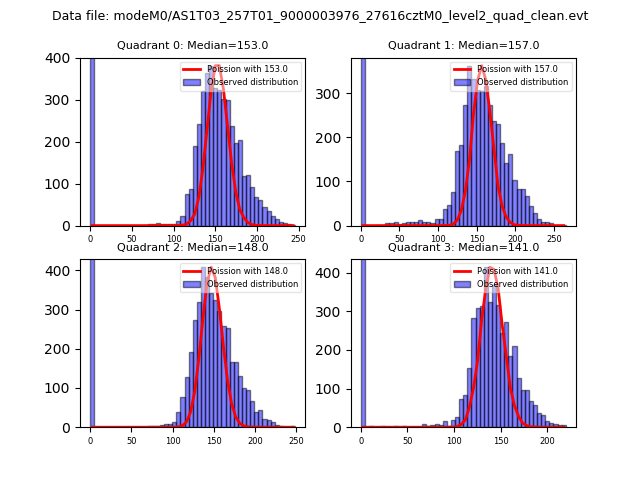 |
 |
| Quadrant-wise count rates Data is divided into 100 sec bins |
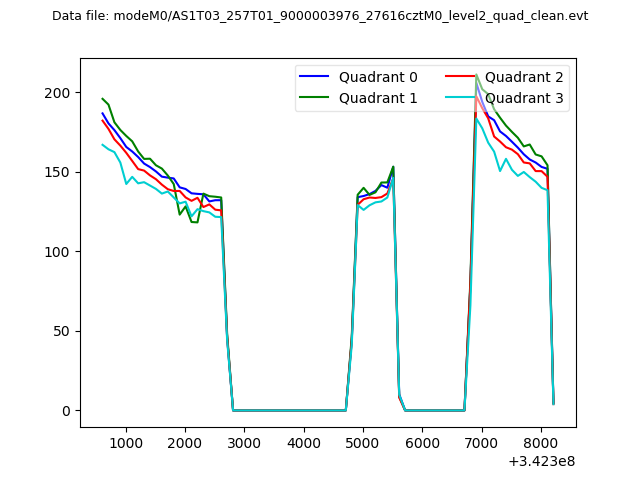 |
|
| Module-wise count rates for Quadrant A Data is divided into 100 sec bins |
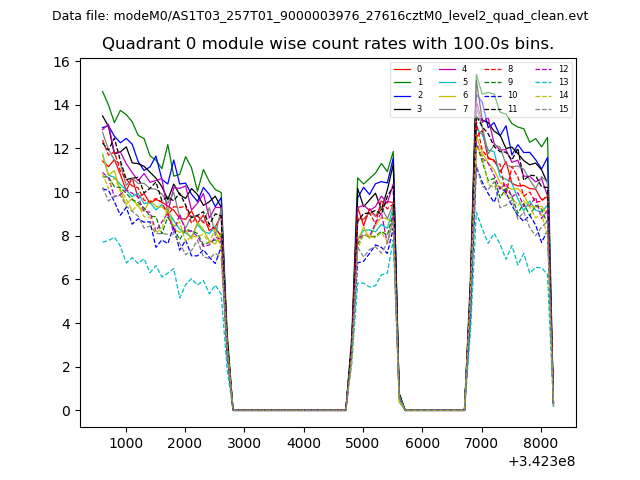 |
 |
| Module-wise count rates for Quadrant B Data is divided into 100 sec bins |
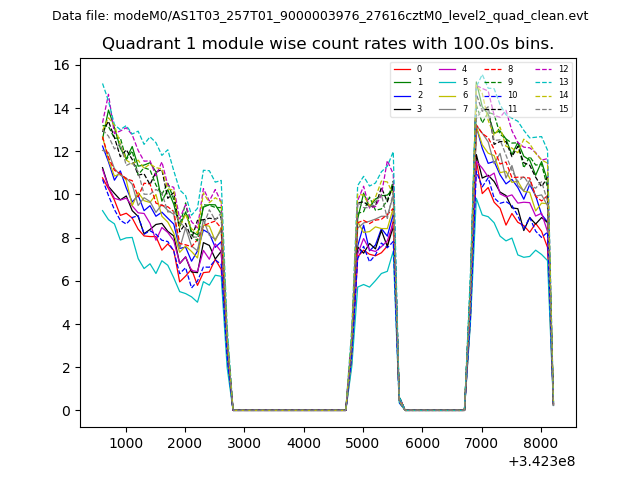 |
 |
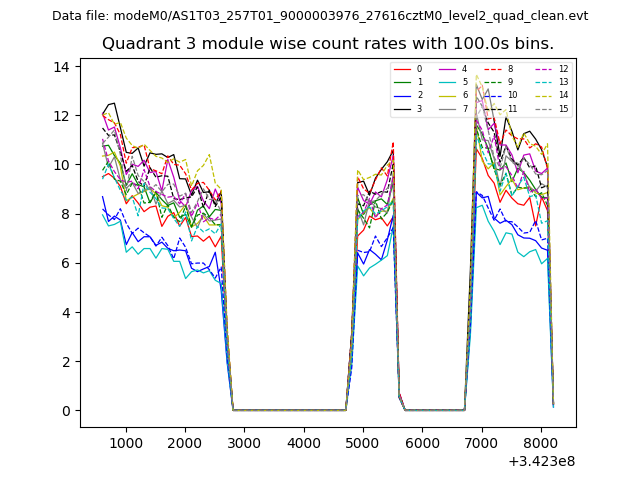
| Module-wise count rates for Quadrant C Data is divided into 100 sec bins |
 |
 |
| Module-wise count rates for Quadrant D Data is divided into 100 sec bins |
 |
 |
| Parameter | Plot |
|---|---|
| CZT HV Monitor | 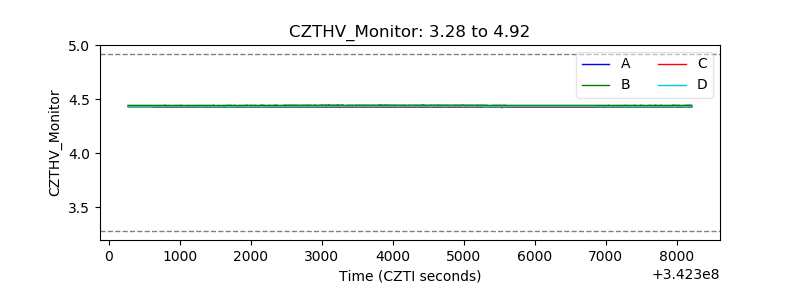 |
| D_VDD | 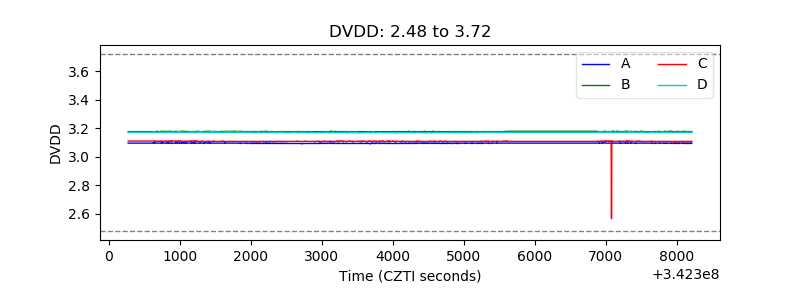 |
| Temperature 1 | 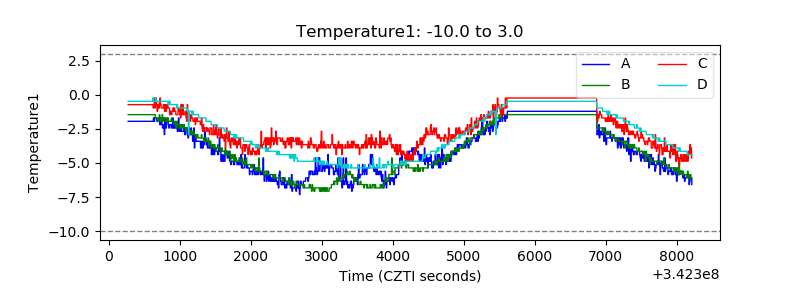 |
| Veto HV Monitor | 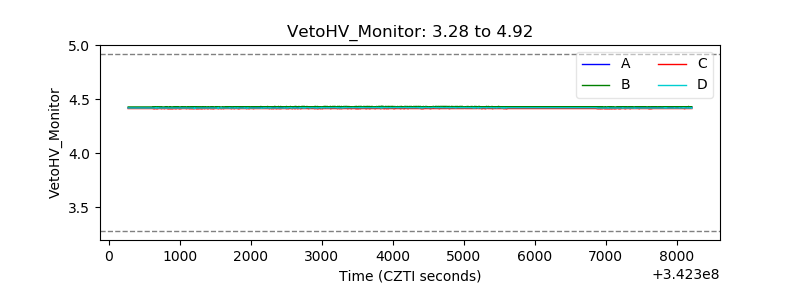 |
| Veto LLD | 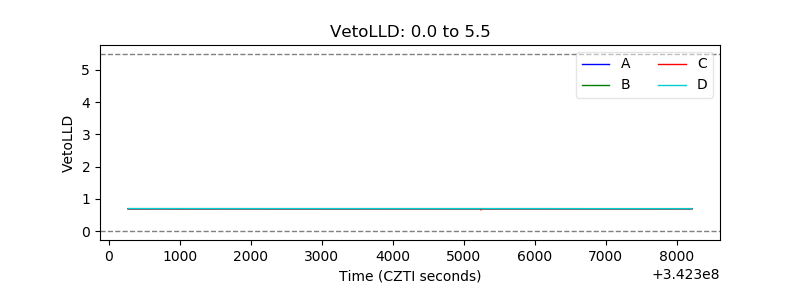 |
| Alpha Counter | 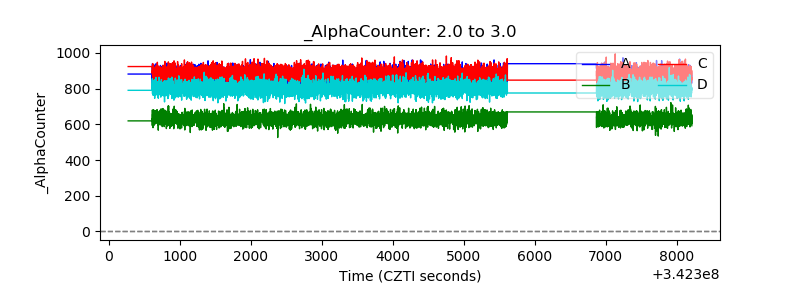 |
| _CPM_Rate | 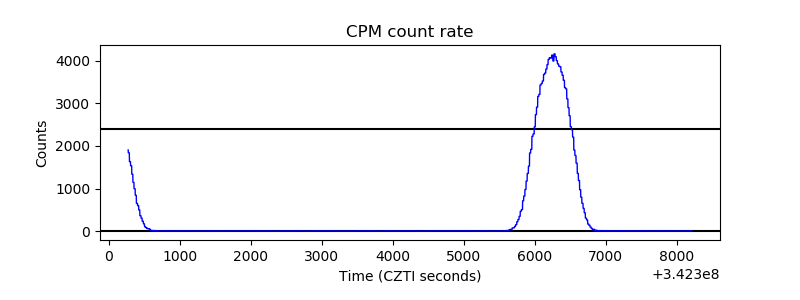 |
| CZT Counter |  |
| +2.5 Volts monitor |  |
| +5 Volts monitor | 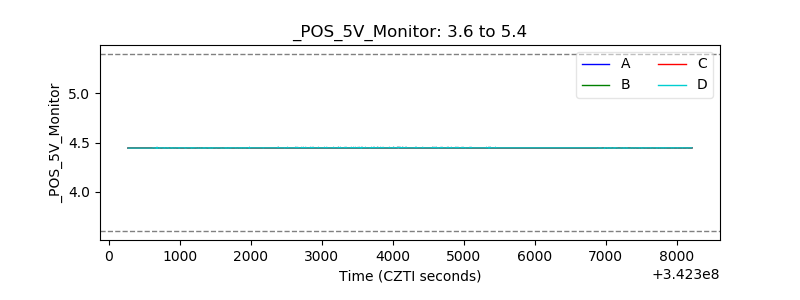 |
| _ROLL_ROT | 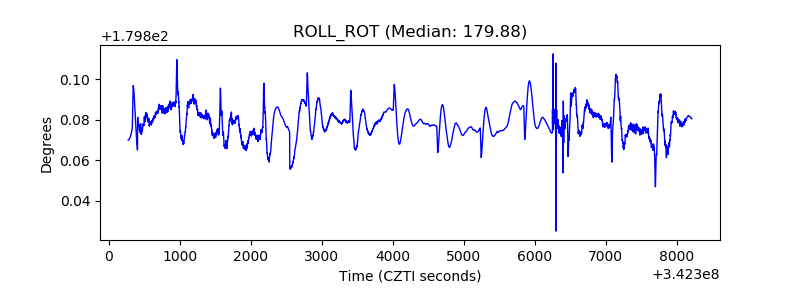 |
| _Roll_DEC | 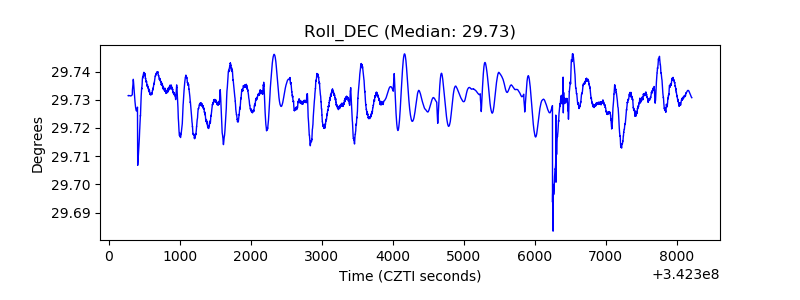 |
| _Roll_RA | 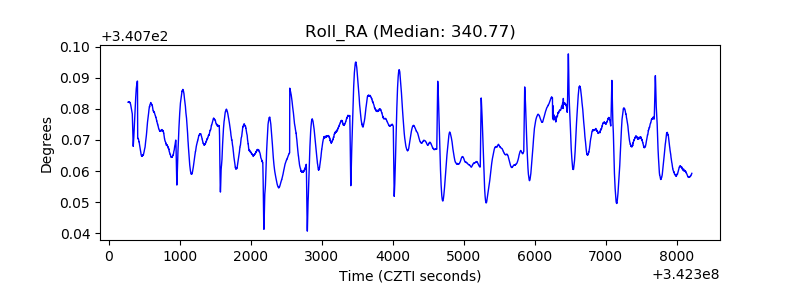 |
| Veto Counter | 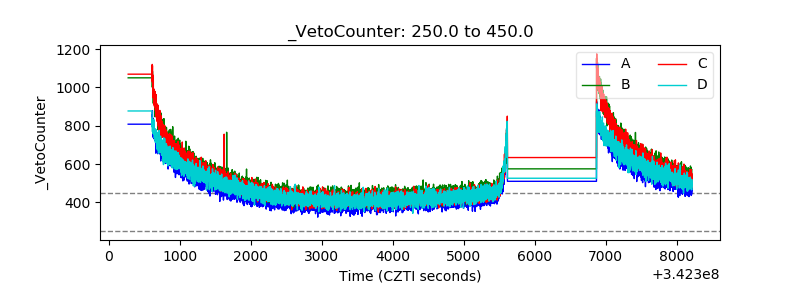 |