| Param | Original file | Final file |
|---|---|---|
| Filename | modeM0/AS1T03_257T01_9000003976_27617cztM0_level2.evt | modeM0/AS1T03_257T01_9000003976_27617cztM0_level2_quad_clean.evt |
| Size (bytes) | 468,846,720 | 98,922,240 |
| Size | 447.1 MB | 94.3 MB |
| Events in quadrant A | 3,223,376 | 654,193 |
| Events in quadrant B | 3,742,167 | 679,431 |
| Events in quadrant C | 3,294,751 | 634,481 |
| Events in quadrant D | 3,522,056 | 599,052 |
| Mode M9 | |||
|---|---|---|---|
| Quadrant | BADHDUFLAG | Total packets | Discarded packets |
| A | 0 | 20 | 0 |
| B | 0 | 21 | 0 |
| C | 0 | 21 | 0 |
| D | 0 | 21 | 0 |
| Mode M0 | |||
|---|---|---|---|
| Quadrant | BADHDUFLAG | Total packets | Discarded packets |
| A | 0 | 13391 | 0 |
| B | 0 | 14881 | 0 |
| C | 0 | 13530 | 0 |
| D | 0 | 14470 | 0 |
| Quadrant | Total seconds | Saturated seconds | Saturation percentage |
|---|---|---|---|
| A | 6137 | 34 | 0.554017% |
| B | 6137 | 144 | 2.346423% |
| C | 6137 | 88 | 1.433925% |
| D | 6137 | 82 | 1.336158% |
Noise dominated data is calculated using 1-second bins in cleaned event files. If a bin has >2000 counts, and if more than 50% of those come from <1% of pixels, then it is considered to be noise-dominated and hence unusable.
| Quadrant | # 1 sec bins | Bins with >0 counts | Bins with >2000 counts | High rate bins dominated by noise | Noise dominated (total time) | Noise dominated (detector-on time) | Marked lightcurve |
|---|---|---|---|---|---|---|---|
| A | 7477 | 6138 | 3 | 3 | 0.04% | 0.05% | 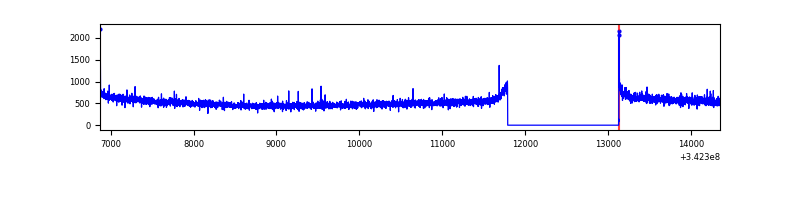 |
| B | 7477 | 6138 | 59 | 59 | 0.79% | 0.96% | 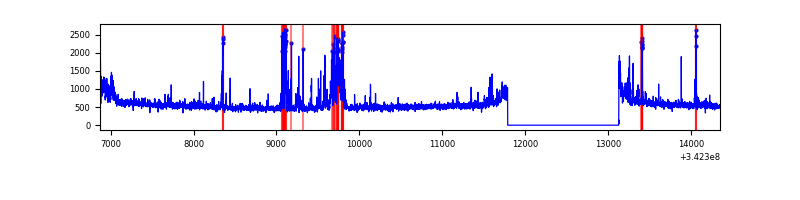 |
| C | 7477 | 6137 | 3 | 3 | 0.04% | 0.05% | 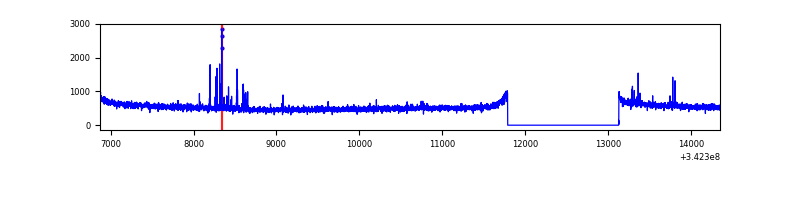 |
| D | 7477 | 6138 | 36 | 36 | 0.48% | 0.59% | 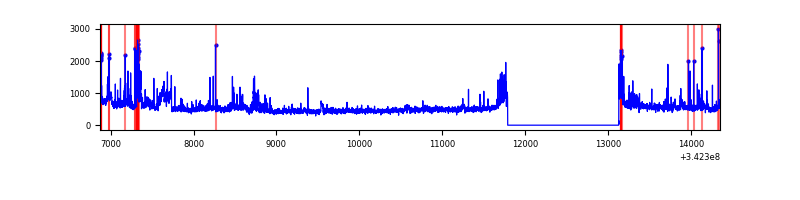 |
Top three noisy pixels from each quadrant. If the there are fewer than three noisy pixels in the level2.evt file, extra rows are filled as -1
| Pixel properties | Quadrant properties | ||||||
|---|---|---|---|---|---|---|---|
| Quadrant | DetID | PixID | Counts | Sigma | Mean | Median | Sigma |
| A | 4 | 2 | 40177 | 240.79 | 819 | 806 | 163.5 |
| A | 8 | 192 | 12673 | 72.58 | 819 | 806 | 163.5 |
| A | 13 | 254 | 10894 | 61.7 | 819 | 806 | 163.5 |
| B | 10 | 245 | 303751 | 1973.72 | 824 | 806 | 153.5 |
| B | 0 | 190 | 60307 | 387.66 | 824 | 806 | 153.5 |
| B | 4 | 200 | 57245 | 367.71 | 824 | 806 | 153.5 |
| C | 14 | 238 | 130860 | 705.37 | 794 | 803 | 184.4 |
| C | 2 | 16 | 56769 | 303.53 | 794 | 803 | 184.4 |
| C | 15 | 208 | 9318 | 46.18 | 794 | 803 | 184.4 |
| D | 7 | 80 | 239494 | 1284.06 | 784 | 765 | 185.9 |
| D | 1 | 52 | 128184 | 685.35 | 784 | 765 | 185.9 |
| D | 2 | 250 | 108085 | 577.25 | 784 | 765 | 185.9 |
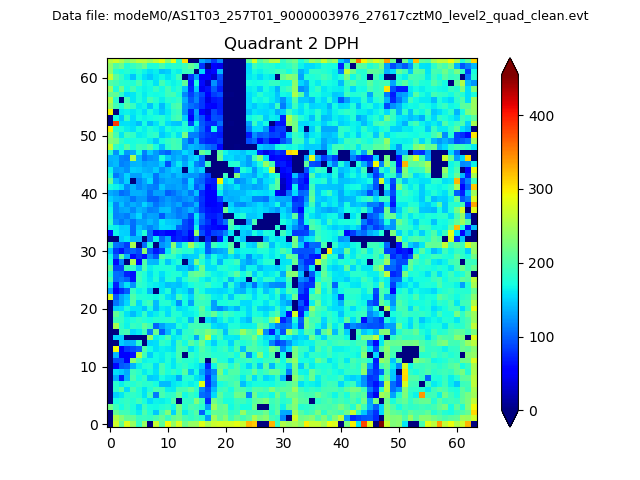
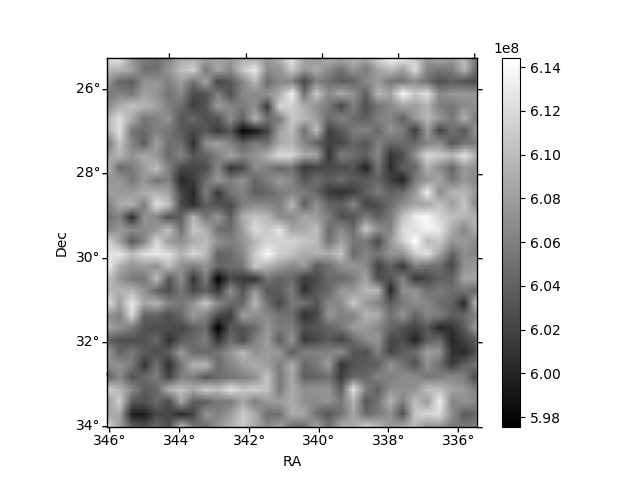
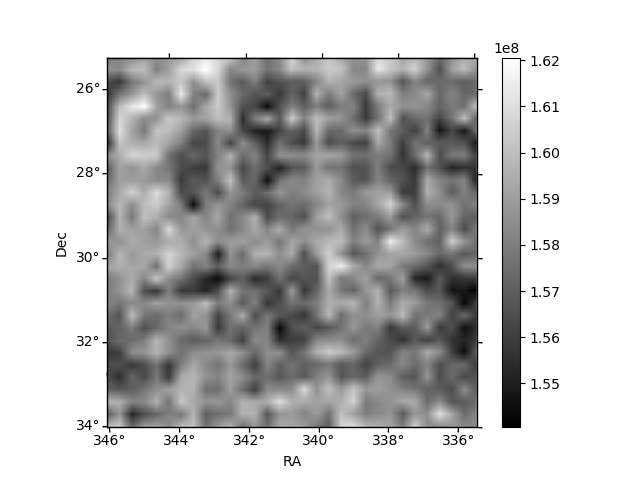
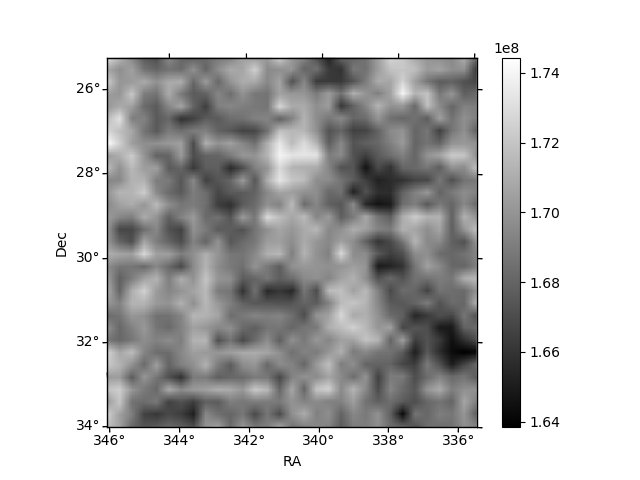
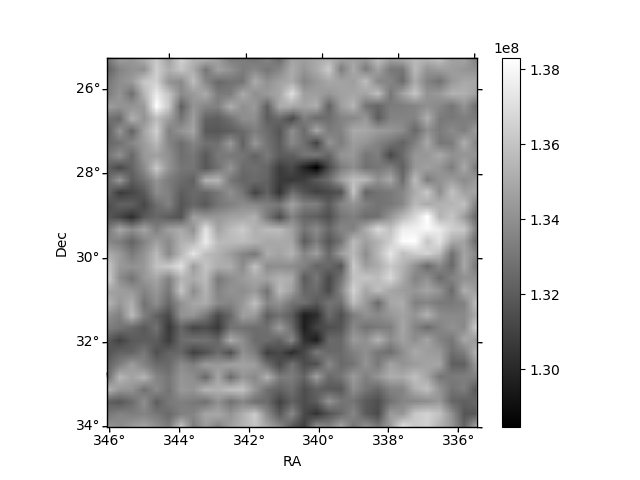
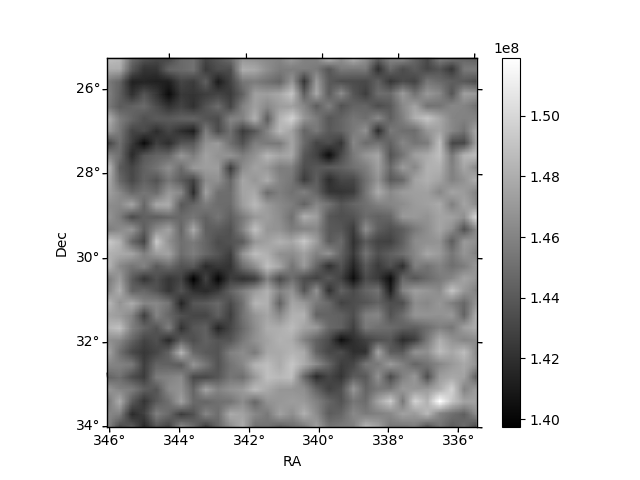
Histogram calculated using DETX and DETY for each event in the final _common_clean file
| Quadrant A | 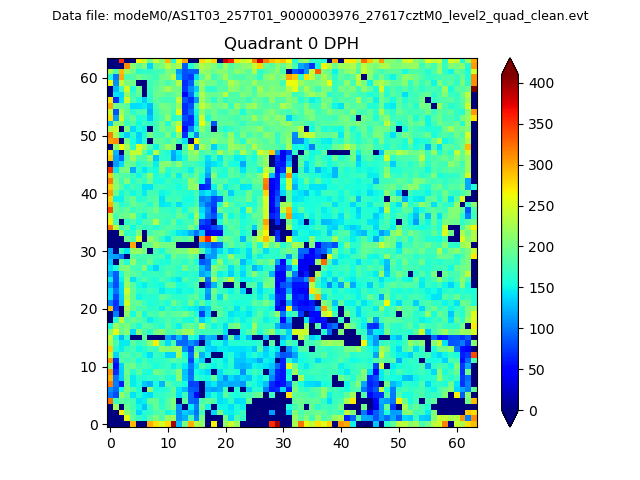 |
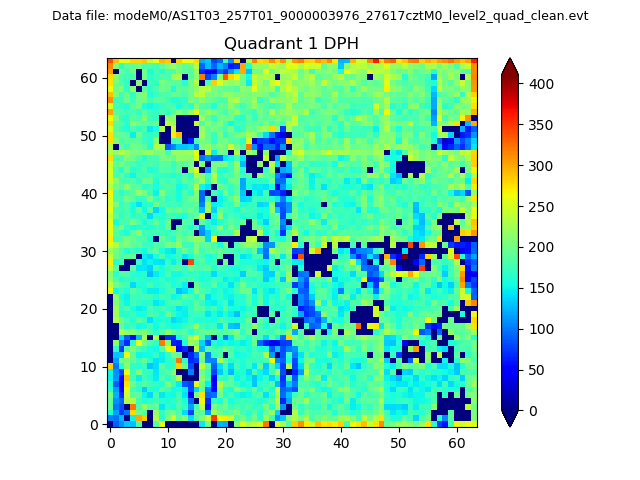 |
Quadrant B |
|---|---|---|---|
| Quadrant D | 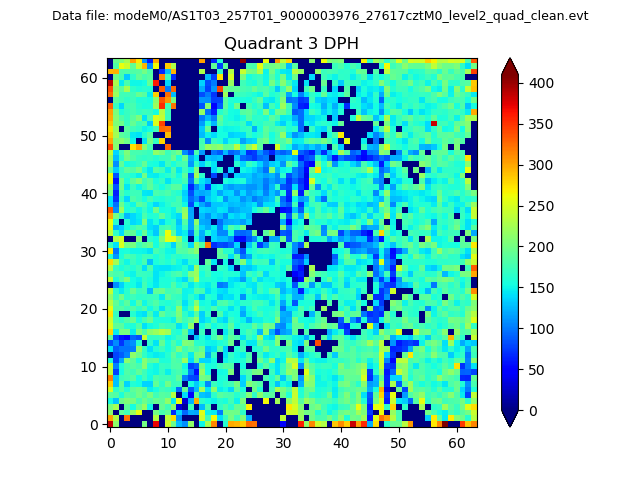 |
 |
Quadrant C |
| Plot type | Count rate plots | Images |
|---|---|---|
| Comparison with Poisson distribution Blue bars denote a histogram of data divided into 1 sec bins. Red curve is a Poisson curve with rate = median count rate of data. |
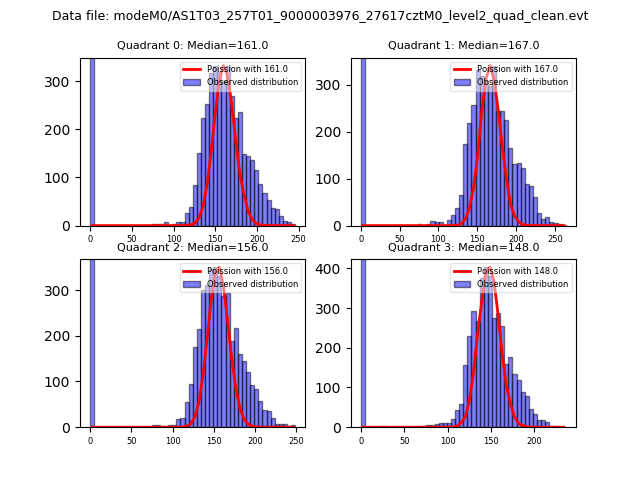 |
 |
| Quadrant-wise count rates Data is divided into 100 sec bins |
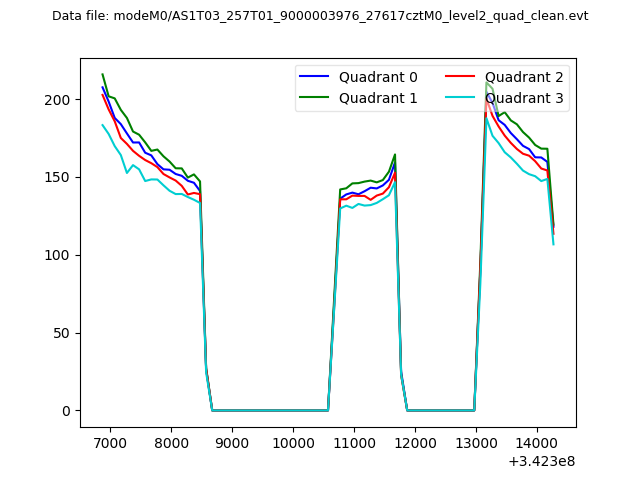 |
|
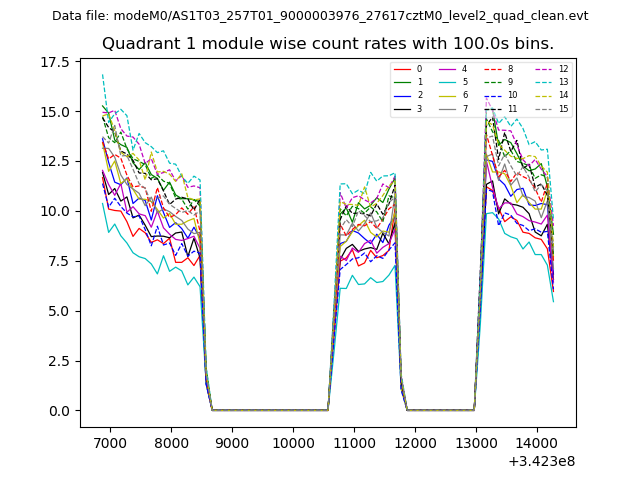
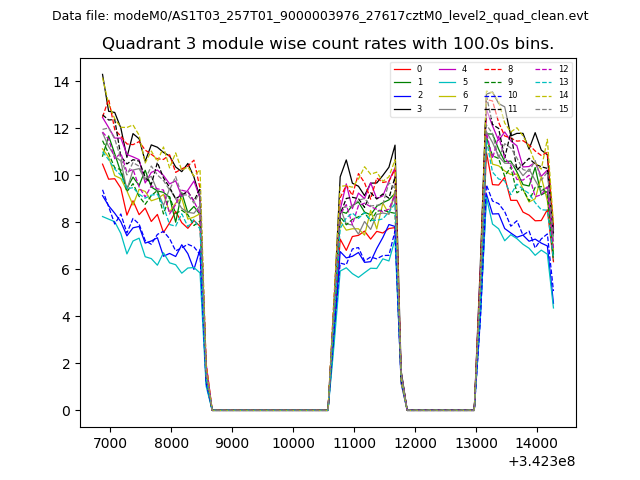
| Module-wise count rates for Quadrant A Data is divided into 100 sec bins |
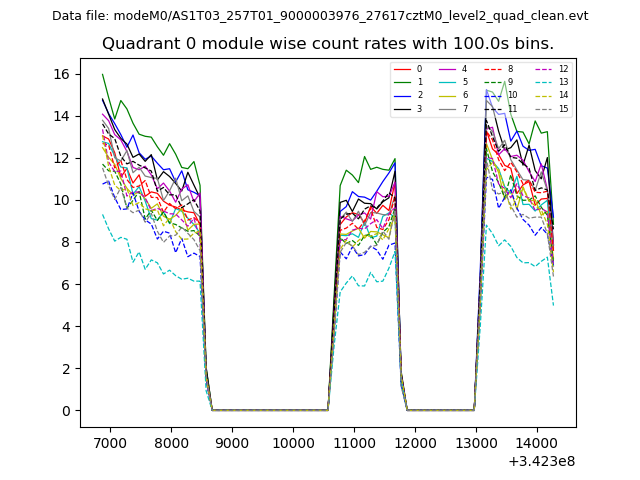 |
 |
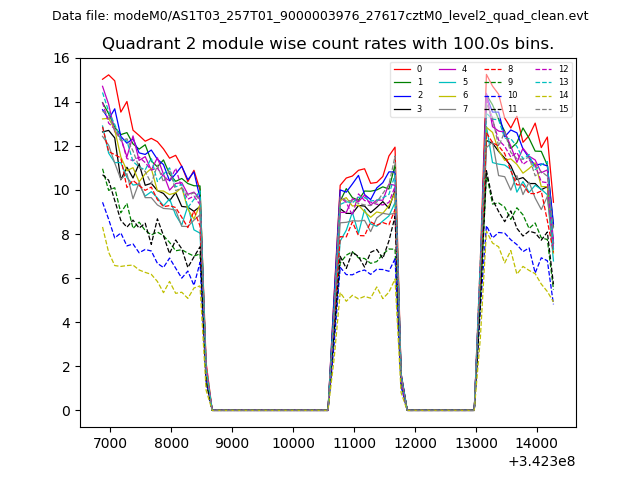
| Module-wise count rates for Quadrant B Data is divided into 100 sec bins |
 |
 |
| Module-wise count rates for Quadrant C Data is divided into 100 sec bins |
 |
 |
| Module-wise count rates for Quadrant D Data is divided into 100 sec bins |
 |
 |
| Parameter | Plot |
|---|---|
| CZT HV Monitor | 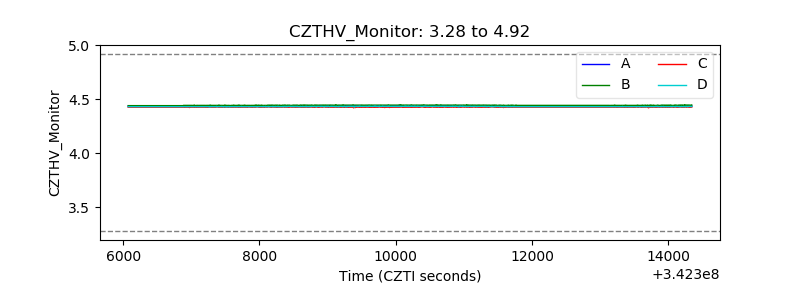 |
| D_VDD | 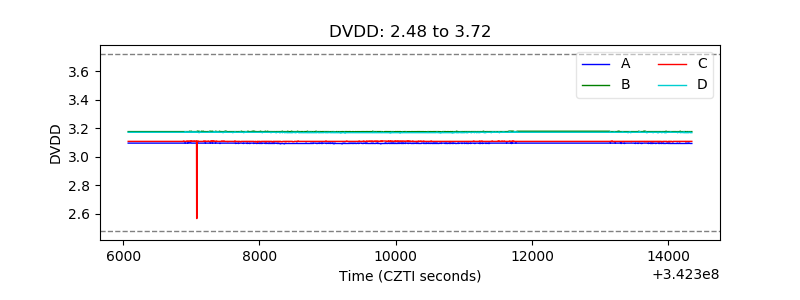 |
| Temperature 1 | 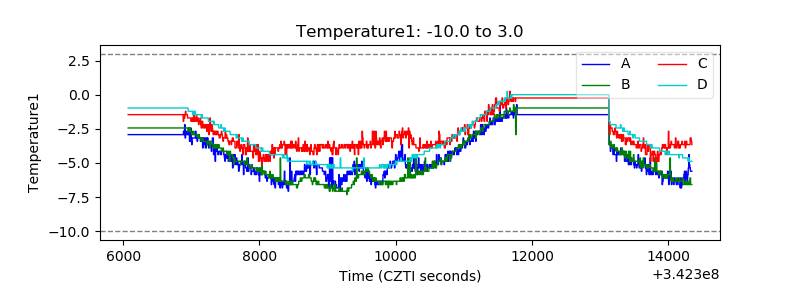 |
| Veto HV Monitor | 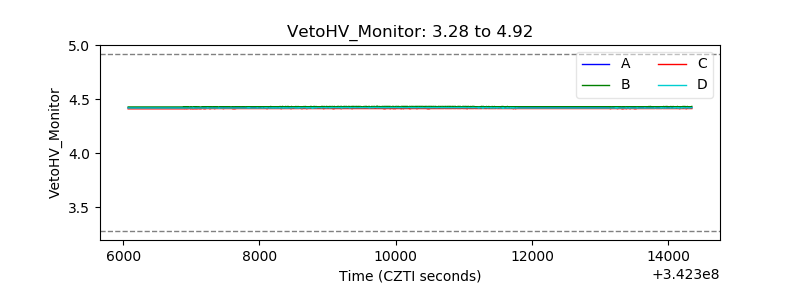 |
| Veto LLD | 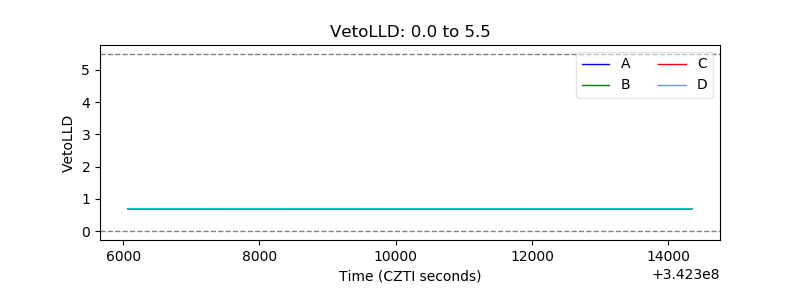 |
| Alpha Counter | 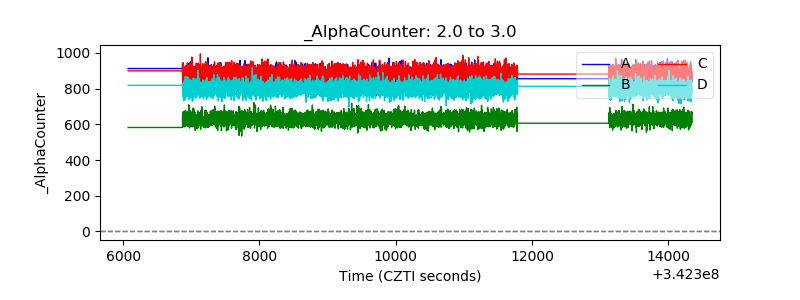 |
| _CPM_Rate | 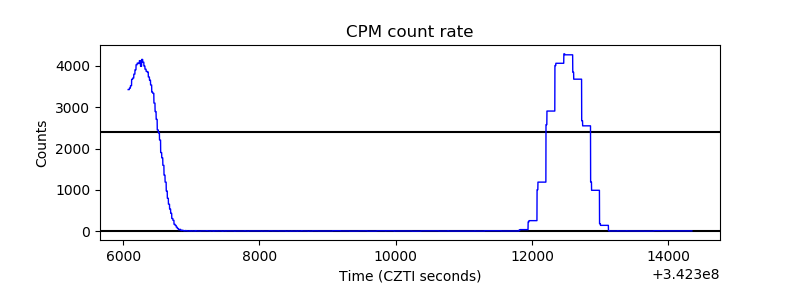 |
| CZT Counter | 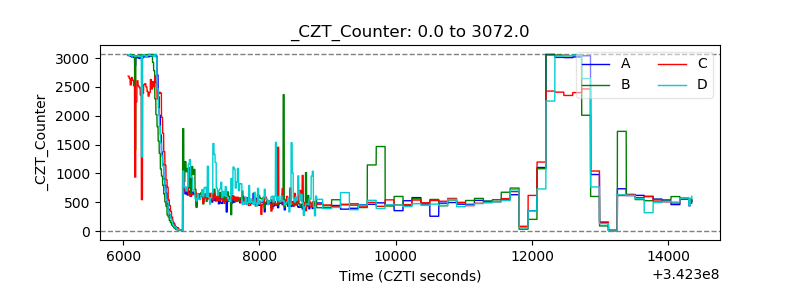 |
| +2.5 Volts monitor |  |
| +5 Volts monitor |  |
| _ROLL_ROT | 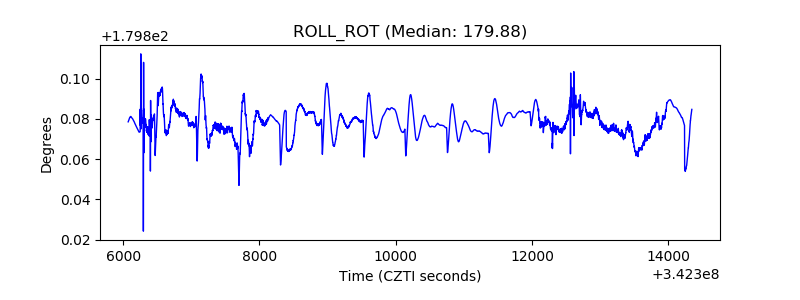 |
| _Roll_DEC | 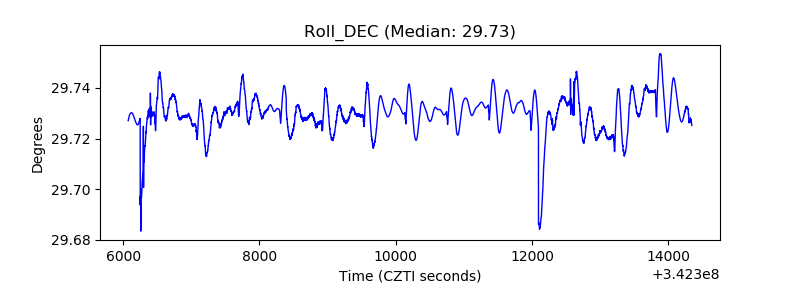 |
| _Roll_RA | 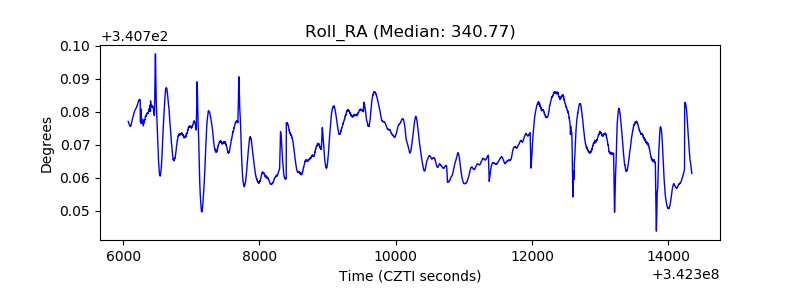 |
| Veto Counter | 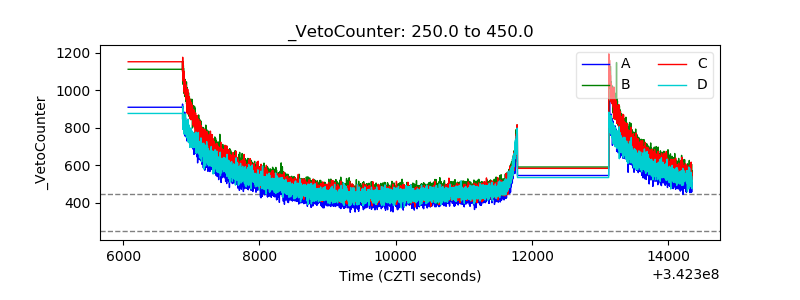 |