| Param | Original file | Final file |
|---|---|---|
| Filename | modeM0/AS1T03_257T01_9000003976_27618cztM0_level2.evt | modeM0/AS1T03_257T01_9000003976_27618cztM0_level2_quad_clean.evt |
| Size (bytes) | 490,855,680 | 91,653,120 |
| Size | 468.1 MB | 87.4 MB |
| Events in quadrant A | 3,307,295 | 598,801 |
| Events in quadrant B | 3,812,747 | 617,592 |
| Events in quadrant C | 3,292,608 | 579,710 |
| Events in quadrant D | 4,034,513 | 548,811 |
| Mode M9 | |||
|---|---|---|---|
| Quadrant | BADHDUFLAG | Total packets | Discarded packets |
| A | 0 | 15 | 0 |
| B | 0 | 16 | 0 |
| C | 0 | 16 | 0 |
| D | 0 | 16 | 0 |
| Mode M0 | |||
|---|---|---|---|
| Quadrant | BADHDUFLAG | Total packets | Discarded packets |
| A | 0 | 13509 | 0 |
| B | 0 | 15117 | 0 |
| C | 0 | 13448 | 0 |
| D | 0 | 15951 | 0 |
| Quadrant | Total seconds | Saturated seconds | Saturation percentage |
|---|---|---|---|
| A | 6167 | 42 | 0.681044% |
| B | 6166 | 150 | 2.432695% |
| C | 6166 | 81 | 1.313656% |
| D | 6166 | 124 | 2.011028% |
Noise dominated data is calculated using 1-second bins in cleaned event files. If a bin has >2000 counts, and if more than 50% of those come from <1% of pixels, then it is considered to be noise-dominated and hence unusable.
| Quadrant | # 1 sec bins | Bins with >0 counts | Bins with >2000 counts | High rate bins dominated by noise | Noise dominated (total time) | Noise dominated (detector-on time) | Marked lightcurve |
|---|---|---|---|---|---|---|---|
| A | 7537 | 6168 | 4 | 4 | 0.05% | 0.06% | 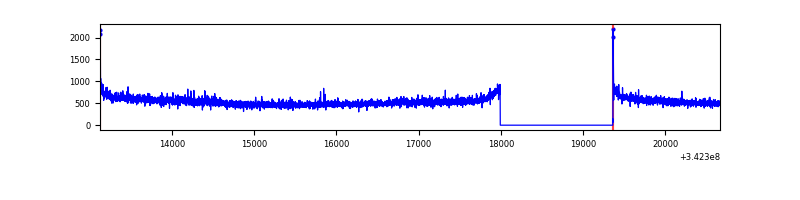 |
| B | 7536 | 6167 | 68 | 68 | 0.90% | 1.10% | 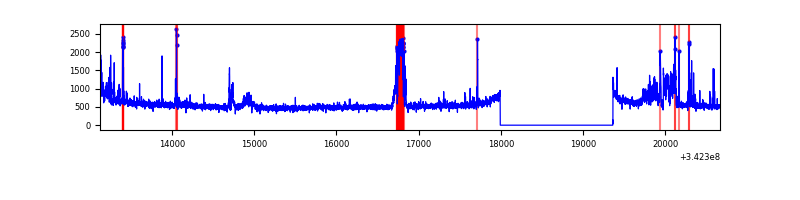 |
| C | 7536 | 6167 | 0 | 0 | 0.00% | 0.00% | 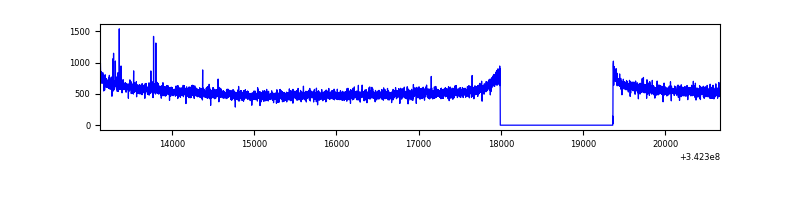 |
| D | 7536 | 6167 | 89 | 89 | 1.18% | 1.44% | 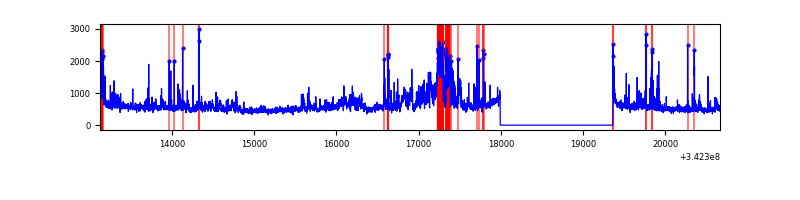 |
Top three noisy pixels from each quadrant. If the there are fewer than three noisy pixels in the level2.evt file, extra rows are filled as -1
| Pixel properties | Quadrant properties | ||||||
|---|---|---|---|---|---|---|---|
| Quadrant | DetID | PixID | Counts | Sigma | Mean | Median | Sigma |
| A | 4 | 2 | 77123 | 463.34 | 833 | 821 | 164.7 |
| A | 8 | 192 | 12940 | 73.59 | 833 | 821 | 164.7 |
| A | 13 | 254 | 10236 | 57.17 | 833 | 821 | 164.7 |
| B | 15 | 222 | 217420 | 1404.33 | 834 | 815 | 154.2 |
| B | 3 | 64 | 165802 | 1069.67 | 834 | 815 | 154.2 |
| B | 10 | 245 | 94147 | 605.11 | 834 | 815 | 154.2 |
| C | 14 | 238 | 133245 | 711.08 | 804 | 812 | 186.2 |
| C | 15 | 208 | 9002 | 43.97 | 804 | 812 | 186.2 |
| C | 13 | 61 | 5515 | 25.25 | 804 | 812 | 186.2 |
| D | 7 | 80 | 773317 | 4083.5 | 791 | 772 | 189.2 |
| D | 2 | 250 | 123669 | 649.61 | 791 | 772 | 189.2 |
| D | 1 | 52 | 87524 | 458.55 | 791 | 772 | 189.2 |
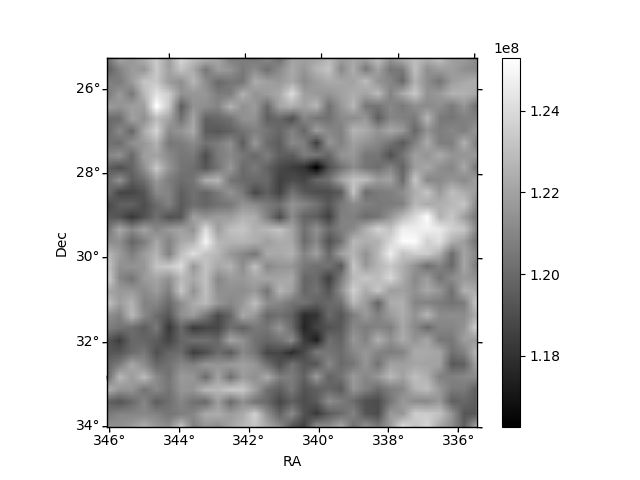
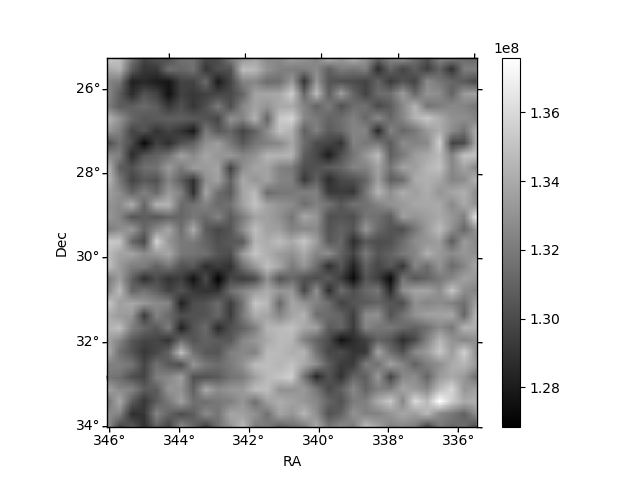
Histogram calculated using DETX and DETY for each event in the final _common_clean file
| Quadrant A | 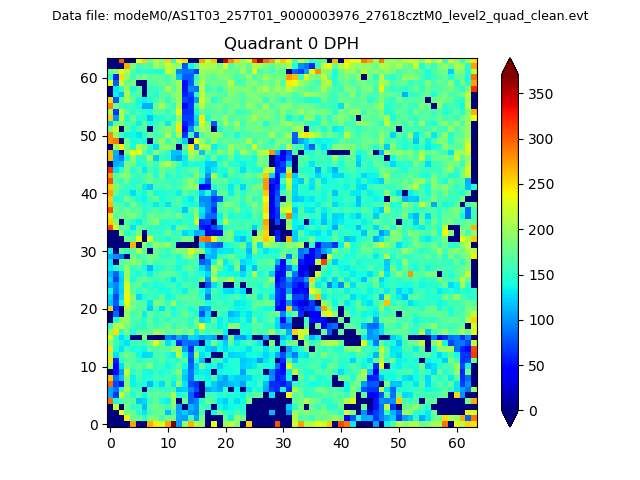 |
 |
Quadrant B |
|---|---|---|---|
| Quadrant D | 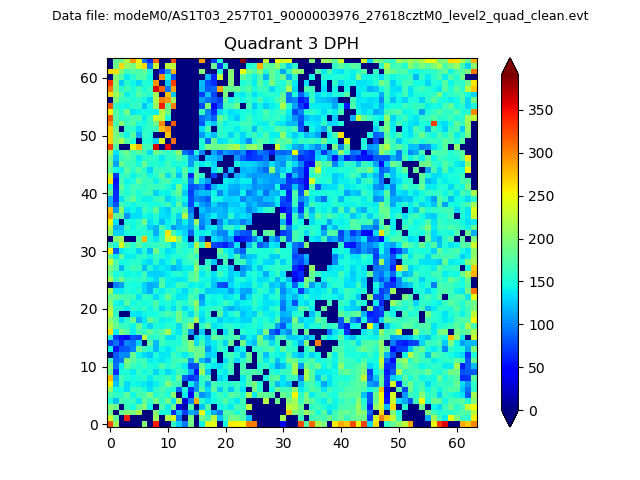 |
 |
Quadrant C |
| Plot type | Count rate plots | Images |
|---|---|---|
| Comparison with Poisson distribution Blue bars denote a histogram of data divided into 1 sec bins. Red curve is a Poisson curve with rate = median count rate of data. |
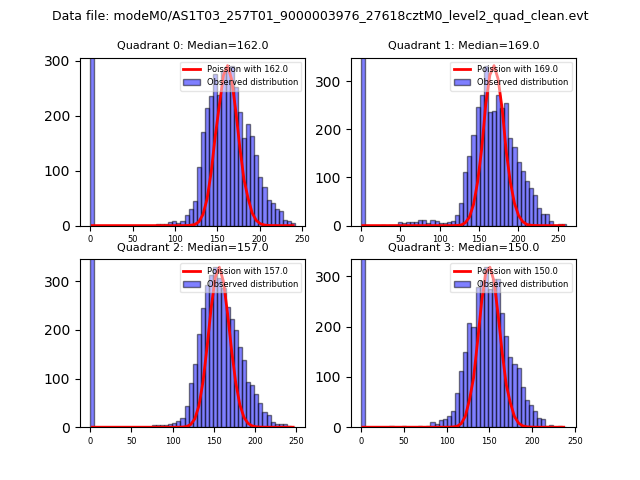 |
 |
| Quadrant-wise count rates Data is divided into 100 sec bins |
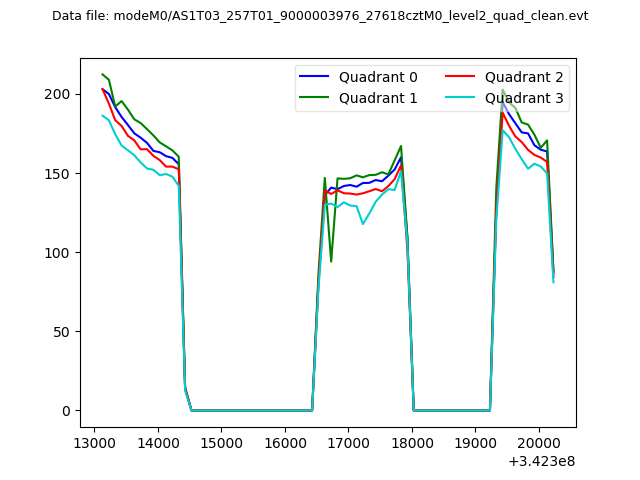 |
|
| Module-wise count rates for Quadrant A Data is divided into 100 sec bins |
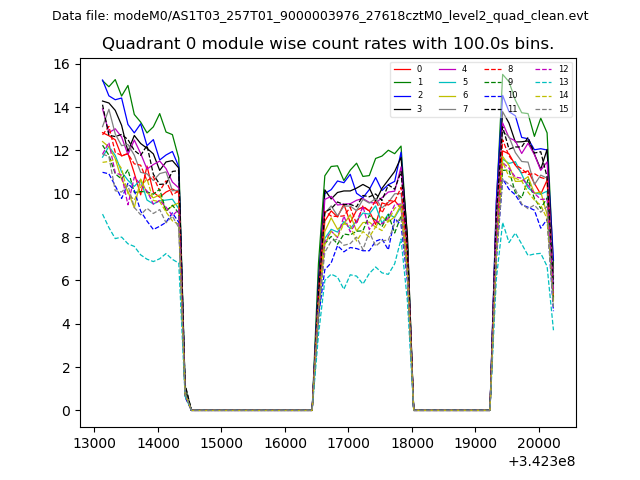 |
 |
| Module-wise count rates for Quadrant B Data is divided into 100 sec bins |
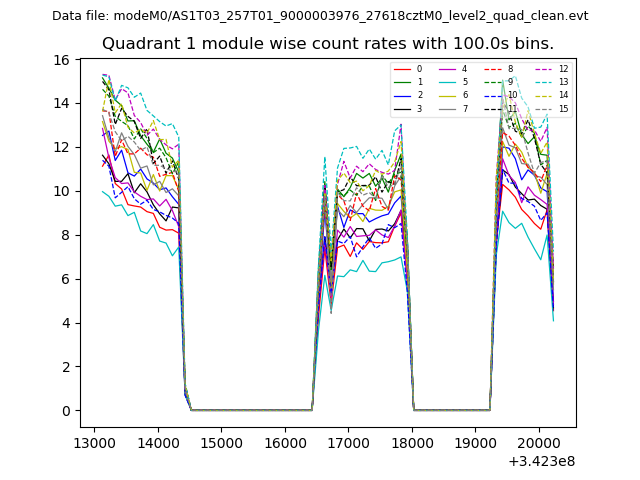 |
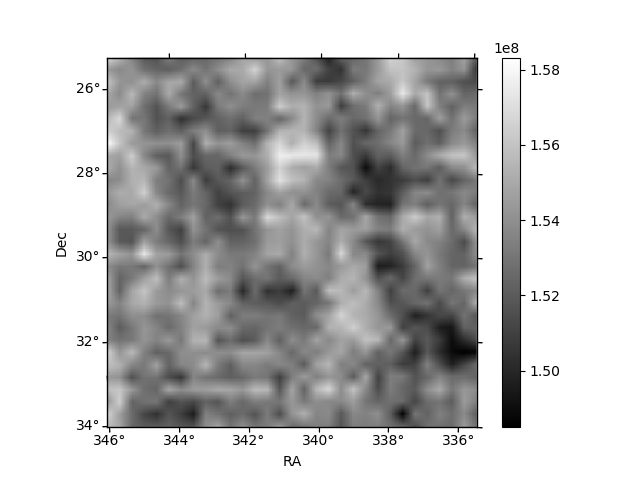 |
| Module-wise count rates for Quadrant C Data is divided into 100 sec bins |
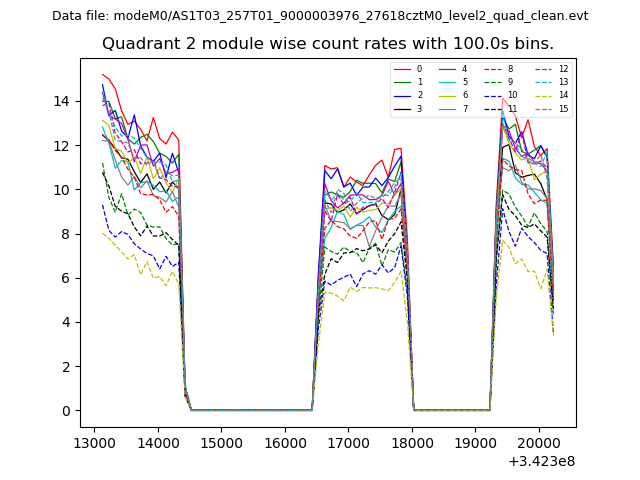 |
 |
| Module-wise count rates for Quadrant D Data is divided into 100 sec bins |
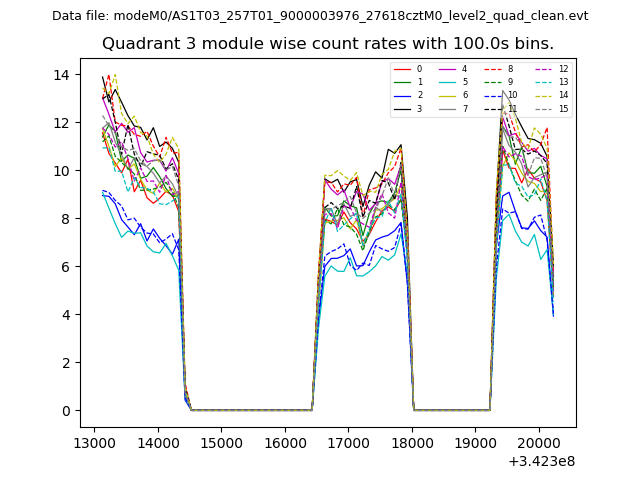 |
 |
| Parameter | Plot |
|---|---|
| CZT HV Monitor | 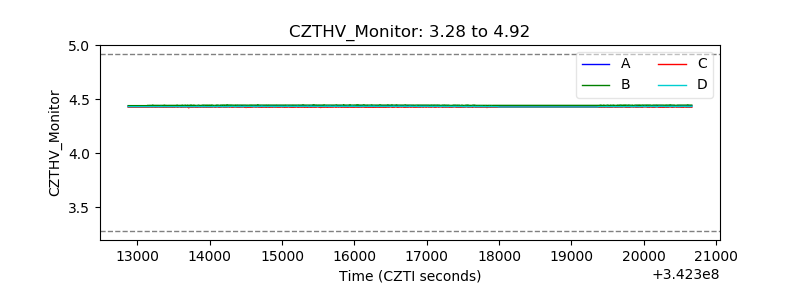 |
| D_VDD | 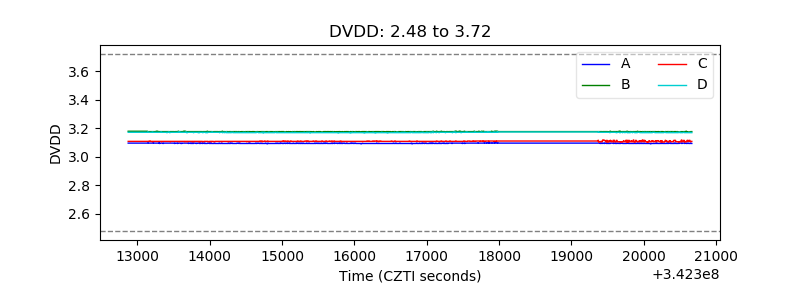 |
| Temperature 1 |  |
| Veto HV Monitor | 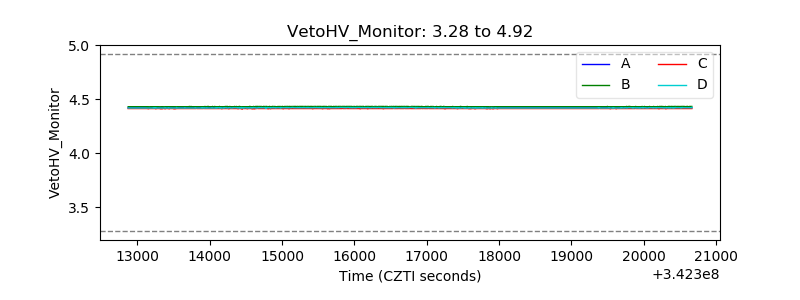 |
| Veto LLD |  |
| Alpha Counter | 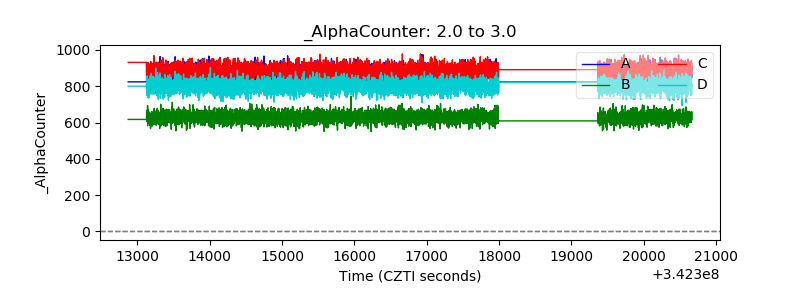 |
| _CPM_Rate | 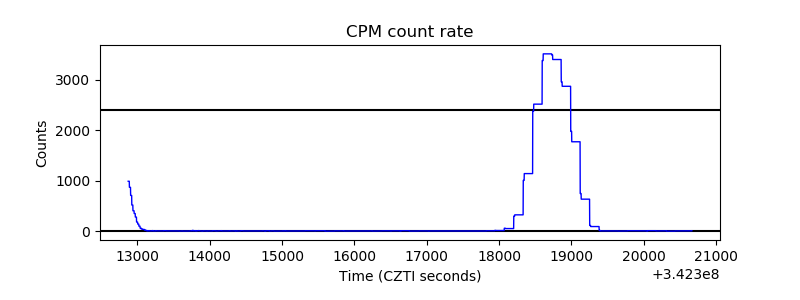 |
| CZT Counter | 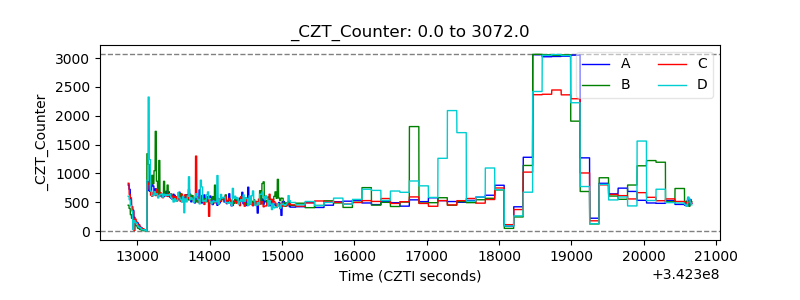 |
| +2.5 Volts monitor |  |
| +5 Volts monitor | 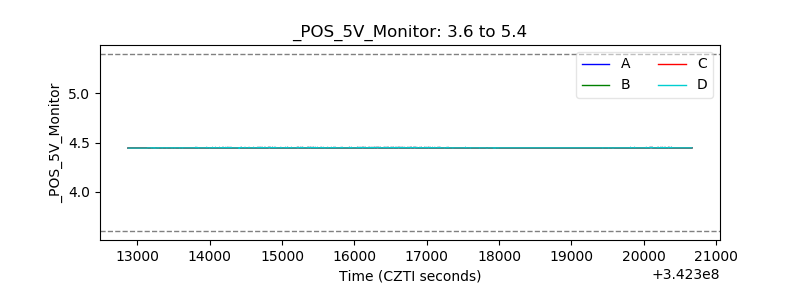 |
| _ROLL_ROT | 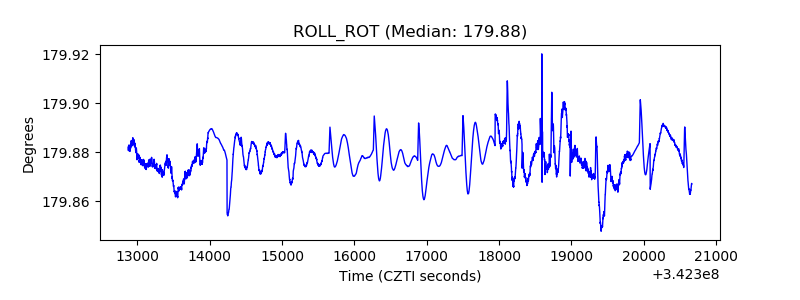 |
| _Roll_DEC | 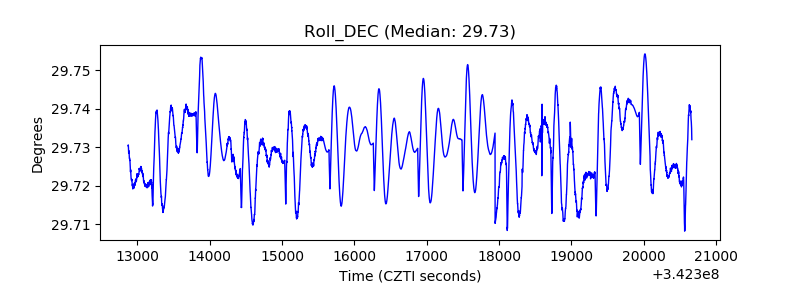 |
| _Roll_RA |  |
| Veto Counter | 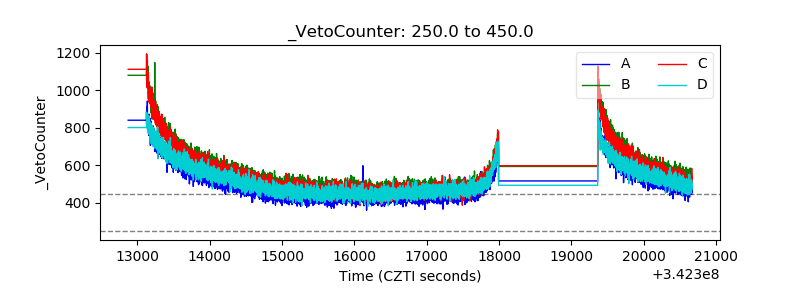 |