| Param | Original file | Final file |
|---|---|---|
| Filename | modeM0/AS1T03_257T01_9000003976_27619cztM0_level2.evt | modeM0/AS1T03_257T01_9000003976_27619cztM0_level2_quad_clean.evt |
| Size (bytes) | 473,155,200 | 80,832,960 |
| Size | 451.2 MB | 77.1 MB |
| Events in quadrant A | 3,277,498 | 510,249 |
| Events in quadrant B | 3,719,771 | 529,463 |
| Events in quadrant C | 3,323,938 | 492,815 |
| Events in quadrant D | 3,574,931 | 469,772 |
| Mode M9 | |||
|---|---|---|---|
| Quadrant | BADHDUFLAG | Total packets | Discarded packets |
| A | 0 | 26 | 0 |
| B | 0 | 27 | 0 |
| C | 0 | 27 | 0 |
| D | 0 | 27 | 0 |
| Mode M0 | |||
|---|---|---|---|
| Quadrant | BADHDUFLAG | Total packets | Discarded packets |
| A | 0 | 13468 | 0 |
| B | 0 | 14906 | 0 |
| C | 0 | 13583 | 0 |
| D | 0 | 14670 | 0 |
| Quadrant | Total seconds | Saturated seconds | Saturation percentage |
|---|---|---|---|
| A | 6384 | 24 | 0.375940% |
| B | 6384 | 74 | 1.159148% |
| C | 6384 | 63 | 0.986842% |
| D | 6383 | 98 | 1.535328% |
Noise dominated data is calculated using 1-second bins in cleaned event files. If a bin has >2000 counts, and if more than 50% of those come from <1% of pixels, then it is considered to be noise-dominated and hence unusable.
| Quadrant | # 1 sec bins | Bins with >0 counts | Bins with >2000 counts | High rate bins dominated by noise | Noise dominated (total time) | Noise dominated (detector-on time) | Marked lightcurve |
|---|---|---|---|---|---|---|---|
| A | 7764 | 6385 | 3 | 3 | 0.04% | 0.05% | 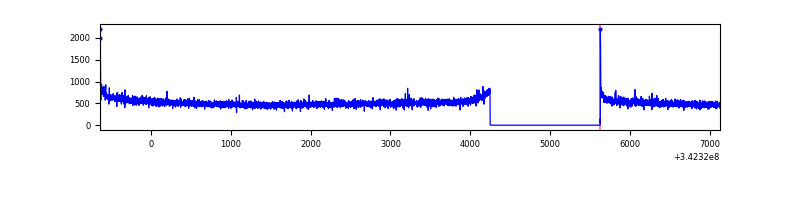 |
| B | 7764 | 6385 | 22 | 22 | 0.28% | 0.34% | 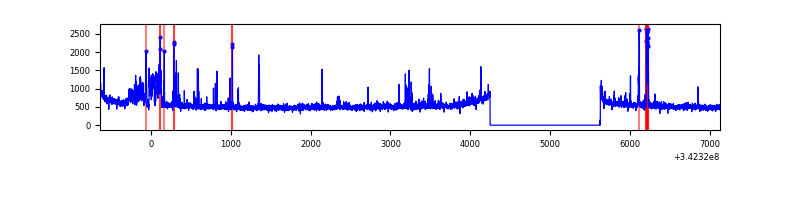 |
| C | 7764 | 6385 | 0 | 0 | 0.00% | 0.00% | 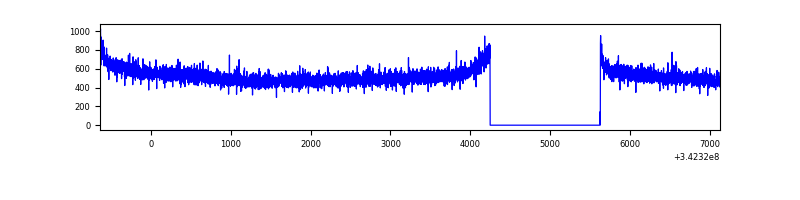 |
| D | 7763 | 6384 | 67 | 67 | 0.86% | 1.05% | 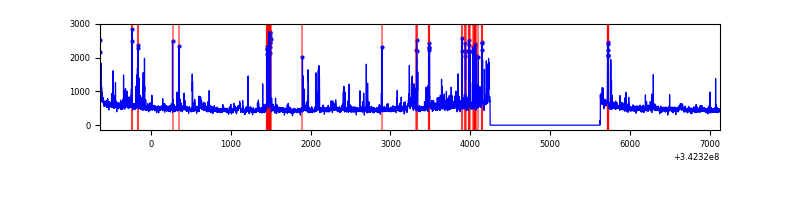 |
Top three noisy pixels from each quadrant. If the there are fewer than three noisy pixels in the level2.evt file, extra rows are filled as -1
| Pixel properties | Quadrant properties | ||||||
|---|---|---|---|---|---|---|---|
| Quadrant | DetID | PixID | Counts | Sigma | Mean | Median | Sigma |
| A | 4 | 2 | 15527 | 87.15 | 843 | 829 | 168.7 |
| A | 8 | 192 | 12597 | 69.78 | 843 | 829 | 168.7 |
| A | 13 | 254 | 10781 | 59.01 | 843 | 829 | 168.7 |
| B | 3 | 64 | 185140 | 1162.92 | 850 | 832 | 158.5 |
| B | 10 | 245 | 165475 | 1038.84 | 850 | 832 | 158.5 |
| B | 0 | 230 | 19864 | 120.09 | 850 | 832 | 158.5 |
| C | 14 | 238 | 132842 | 704.83 | 811 | 819 | 187.3 |
| C | 8 | 128 | 11905 | 59.18 | 811 | 819 | 187.3 |
| C | 1 | 16 | 6349 | 29.52 | 811 | 819 | 187.3 |
| D | 7 | 80 | 349368 | 1813.1 | 801 | 779 | 192.3 |
| D | 2 | 250 | 89441 | 461.15 | 801 | 779 | 192.3 |
| D | 1 | 52 | 37838 | 192.75 | 801 | 779 | 192.3 |
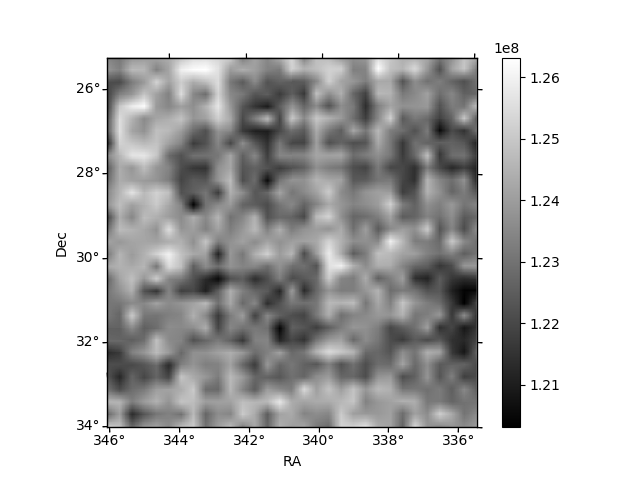
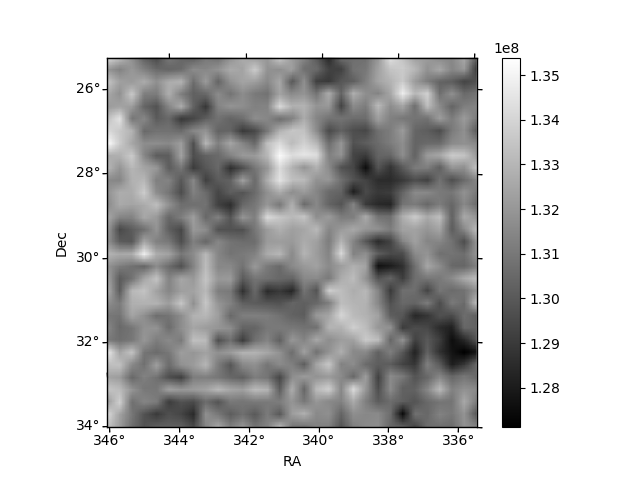
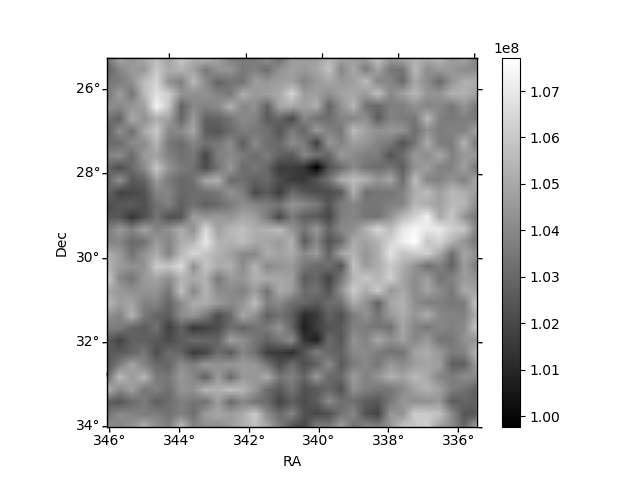
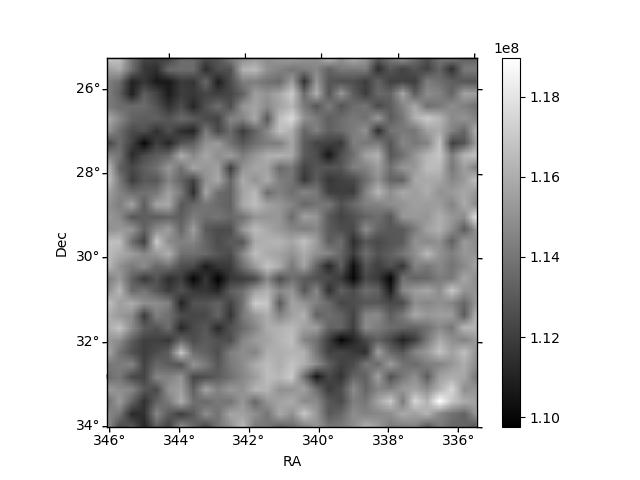
Histogram calculated using DETX and DETY for each event in the final _common_clean file
| Quadrant A | 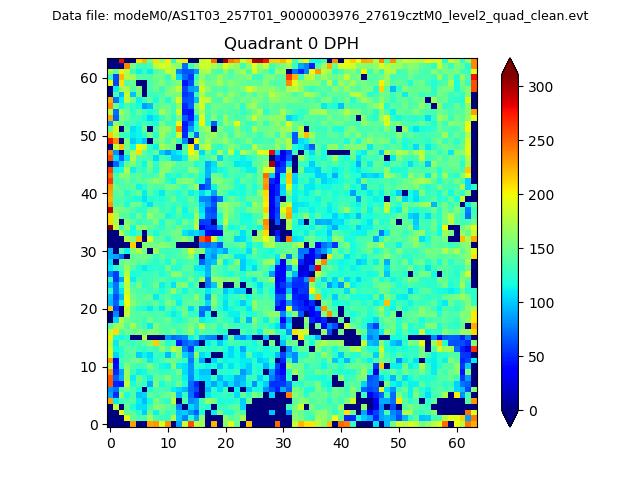 |
 |
Quadrant B |
|---|---|---|---|
| Quadrant D | 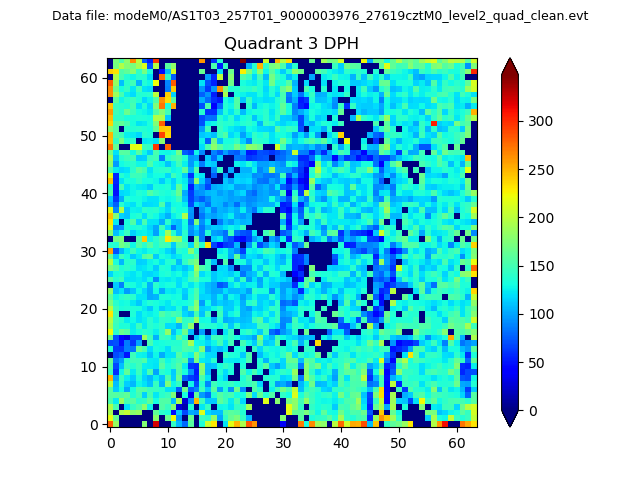 |
 |
Quadrant C |
| Plot type | Count rate plots | Images |
|---|---|---|
| Comparison with Poisson distribution Blue bars denote a histogram of data divided into 1 sec bins. Red curve is a Poisson curve with rate = median count rate of data. |
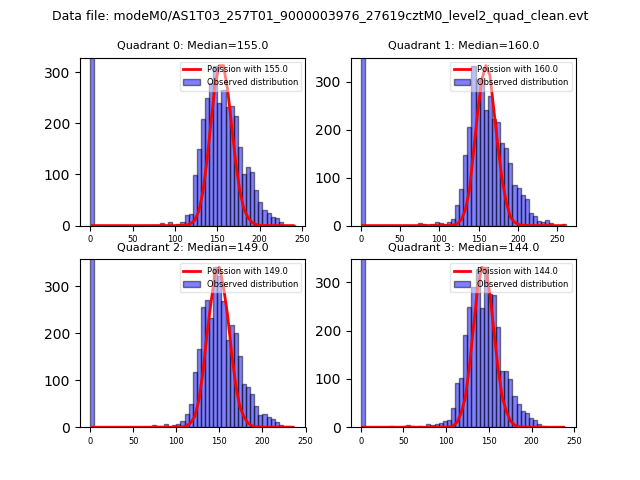 |
 |
| Quadrant-wise count rates Data is divided into 100 sec bins |
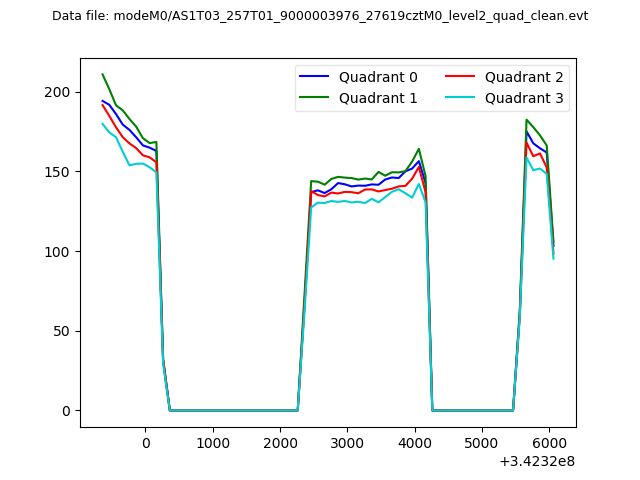 |
|
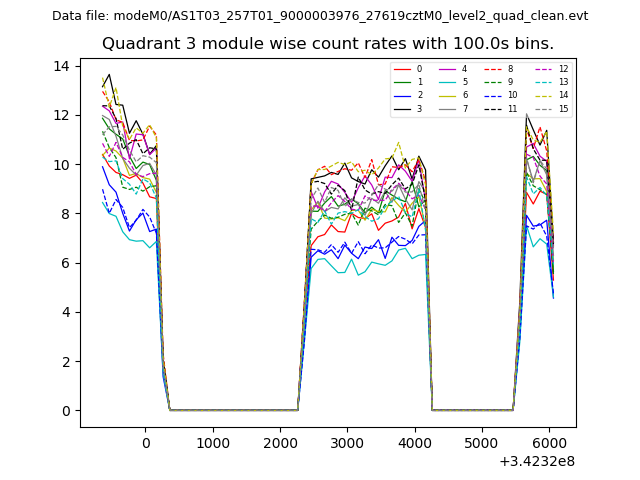
| Module-wise count rates for Quadrant A Data is divided into 100 sec bins |
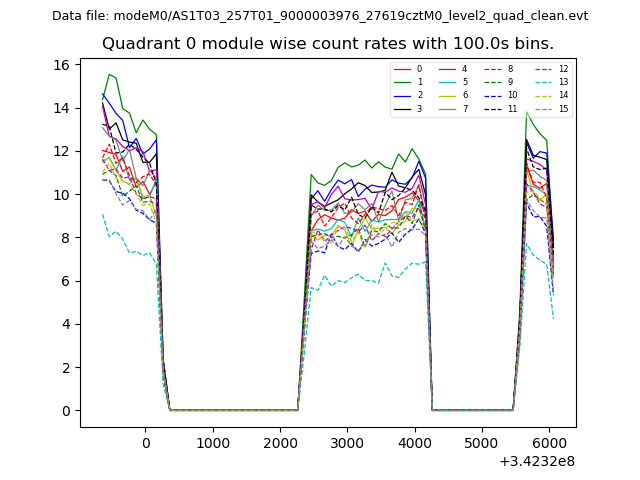 |
 |
| Module-wise count rates for Quadrant B Data is divided into 100 sec bins |
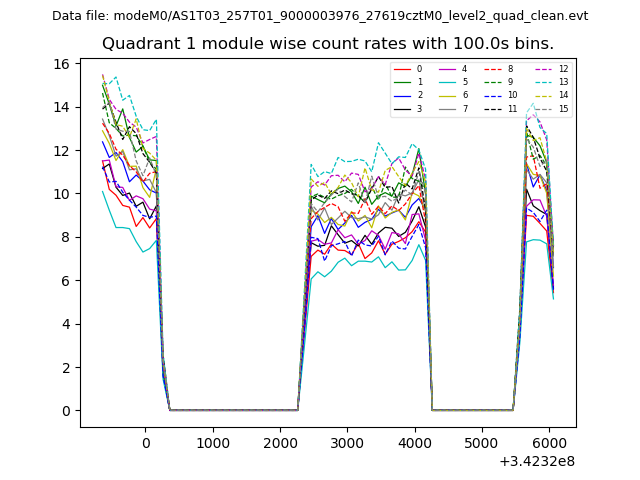 |
 |
| Module-wise count rates for Quadrant C Data is divided into 100 sec bins |
 |
 |
| Module-wise count rates for Quadrant D Data is divided into 100 sec bins |
 |
 |
| Parameter | Plot |
|---|---|
| CZT HV Monitor | 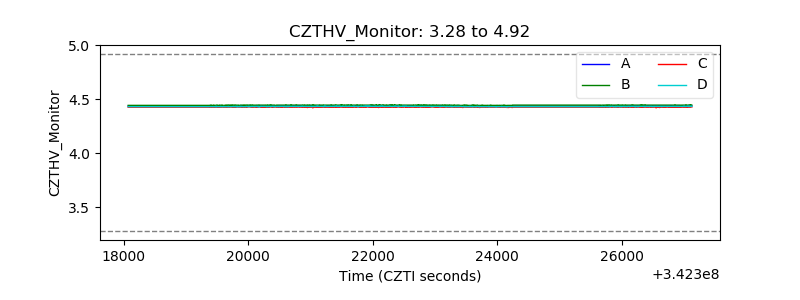 |
| D_VDD | 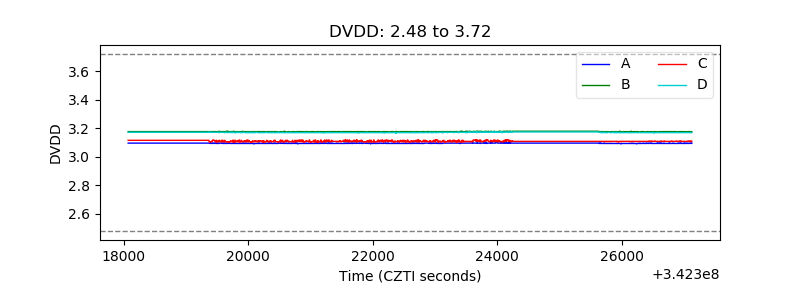 |
| Temperature 1 |  |
| Veto HV Monitor | 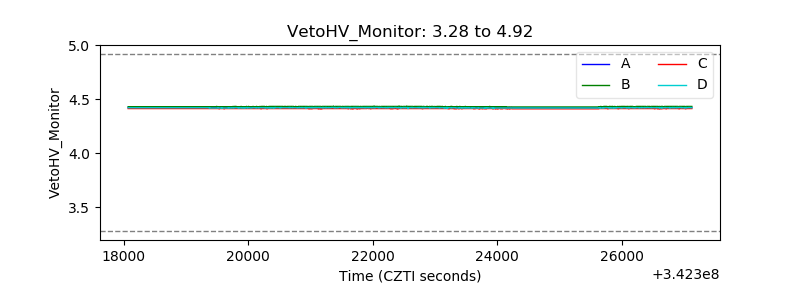 |
| Veto LLD | 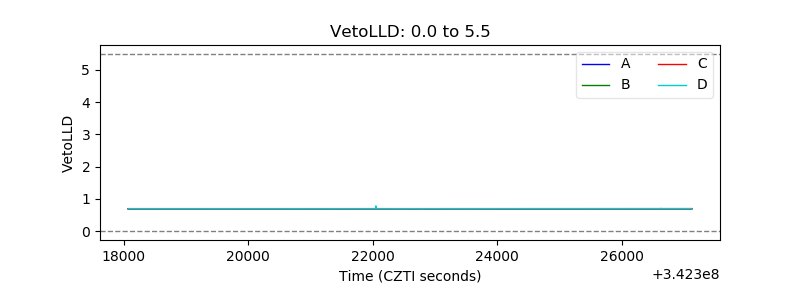 |
| Alpha Counter |  |
| _CPM_Rate | 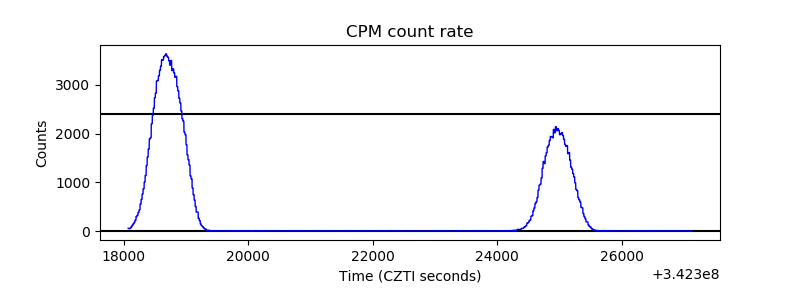 |
| CZT Counter | 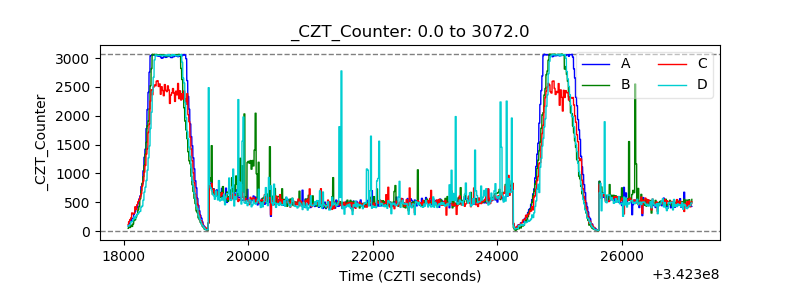 |
| +2.5 Volts monitor | 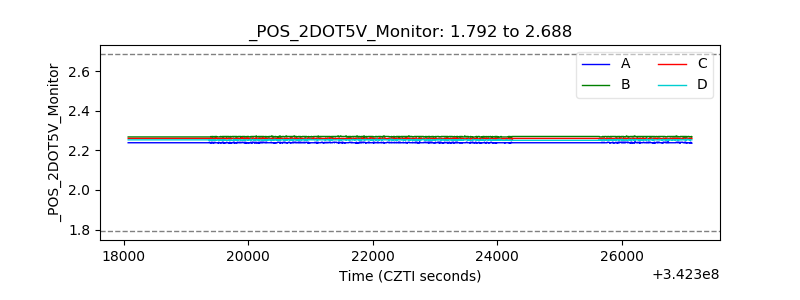 |
| +5 Volts monitor |  |
| _ROLL_ROT | 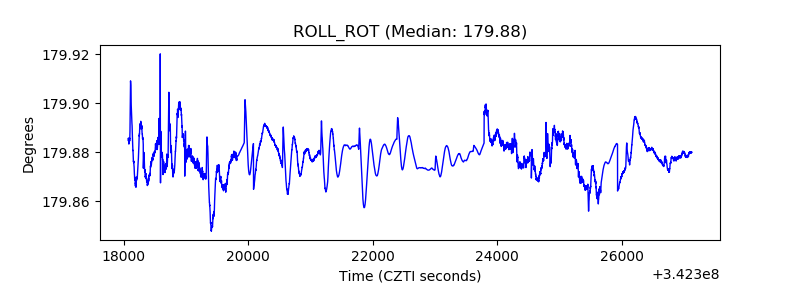 |
| _Roll_DEC | 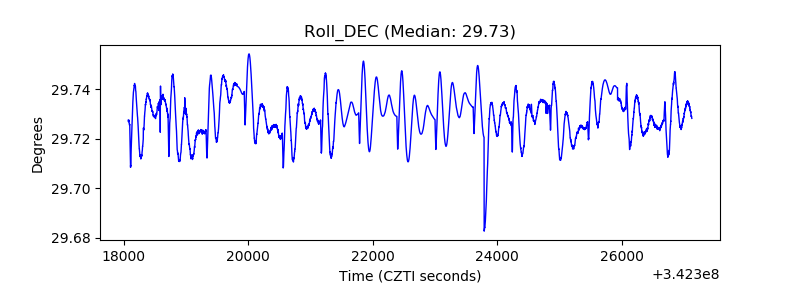 |
| _Roll_RA |  |
| Veto Counter | 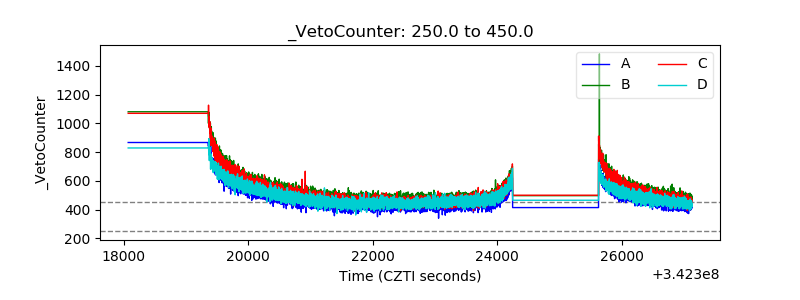 |