| Param | Original file | Final file |
|---|---|---|
| Filename | modeM0/AS1T03_257T01_9000003976_27620cztM0_level2.evt | modeM0/AS1T03_257T01_9000003976_27620cztM0_level2_quad_clean.evt |
| Size (bytes) | 471,954,240 | 73,347,840 |
| Size | 450.1 MB | 69.9 MB |
| Events in quadrant A | 3,314,983 | 449,159 |
| Events in quadrant B | 3,575,671 | 460,230 |
| Events in quadrant C | 3,328,645 | 433,163 |
| Events in quadrant D | 3,622,193 | 414,656 |
| Mode M9 | |||
|---|---|---|---|
| Quadrant | BADHDUFLAG | Total packets | Discarded packets |
| A | 0 | 19 | 0 |
| B | 0 | 20 | 0 |
| C | 0 | 20 | 0 |
| D | 0 | 20 | 0 |
| Mode M0 | |||
|---|---|---|---|
| Quadrant | BADHDUFLAG | Total packets | Discarded packets |
| A | 0 | 13810 | 0 |
| B | 0 | 14573 | 0 |
| C | 0 | 13822 | 0 |
| D | 0 | 15135 | 0 |
| Quadrant | Total seconds | Saturated seconds | Saturation percentage |
|---|---|---|---|
| A | 6647 | 31 | 0.466376% |
| B | 6647 | 99 | 1.489394% |
| C | 6647 | 55 | 0.827441% |
| D | 6647 | 81 | 1.218595% |
Noise dominated data is calculated using 1-second bins in cleaned event files. If a bin has >2000 counts, and if more than 50% of those come from <1% of pixels, then it is considered to be noise-dominated and hence unusable.
| Quadrant | # 1 sec bins | Bins with >0 counts | Bins with >2000 counts | High rate bins dominated by noise | Noise dominated (total time) | Noise dominated (detector-on time) | Marked lightcurve |
|---|---|---|---|---|---|---|---|
| A | 7787 | 6648 | 1 | 1 | 0.01% | 0.02% | 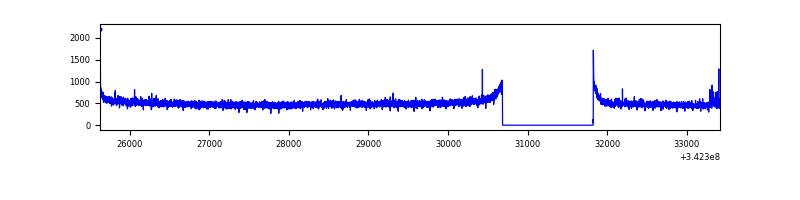 |
| B | 7787 | 6648 | 21 | 21 | 0.27% | 0.32% | 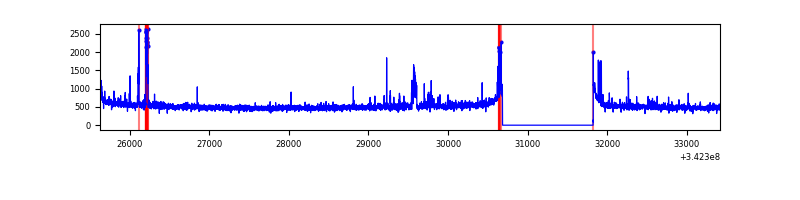 |
| C | 7787 | 6648 | 0 | 0 | 0.00% | 0.00% | 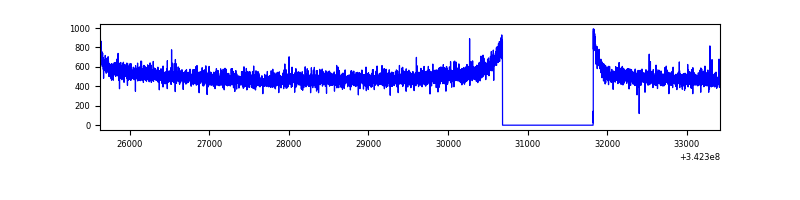 |
| D | 7787 | 6648 | 71 | 71 | 0.91% | 1.07% | 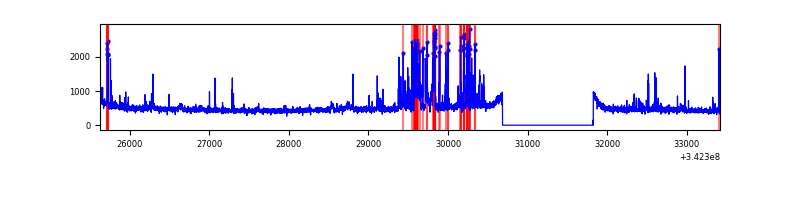 |
Top three noisy pixels from each quadrant. If the there are fewer than three noisy pixels in the level2.evt file, extra rows are filled as -1
| Pixel properties | Quadrant properties | ||||||
|---|---|---|---|---|---|---|---|
| Quadrant | DetID | PixID | Counts | Sigma | Mean | Median | Sigma |
| A | 12 | 96 | 12226 | 67.13 | 854 | 837 | 169.6 |
| A | 13 | 254 | 10213 | 55.27 | 854 | 837 | 169.6 |
| A | 8 | 192 | 10185 | 55.1 | 854 | 837 | 169.6 |
| B | 10 | 245 | 148998 | 920.27 | 854 | 835 | 161.0 |
| B | 0 | 190 | 49615 | 302.98 | 854 | 835 | 161.0 |
| B | 12 | 111 | 19251 | 114.39 | 854 | 835 | 161.0 |
| C | 14 | 238 | 133488 | 690.67 | 818 | 823 | 192.1 |
| C | 13 | 61 | 5739 | 25.59 | 818 | 823 | 192.1 |
| C | 1 | 16 | 4855 | 20.99 | 818 | 823 | 192.1 |
| D | 7 | 80 | 181943 | 943.58 | 811 | 791 | 192.0 |
| D | 12 | 233 | 158949 | 823.81 | 811 | 791 | 192.0 |
| D | 1 | 52 | 88594 | 457.35 | 811 | 791 | 192.0 |
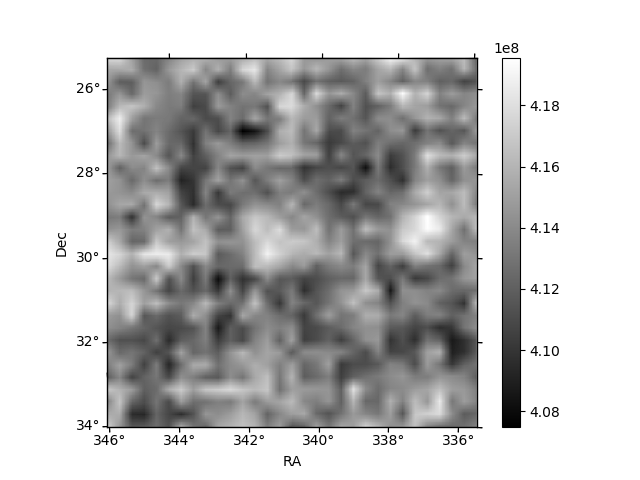
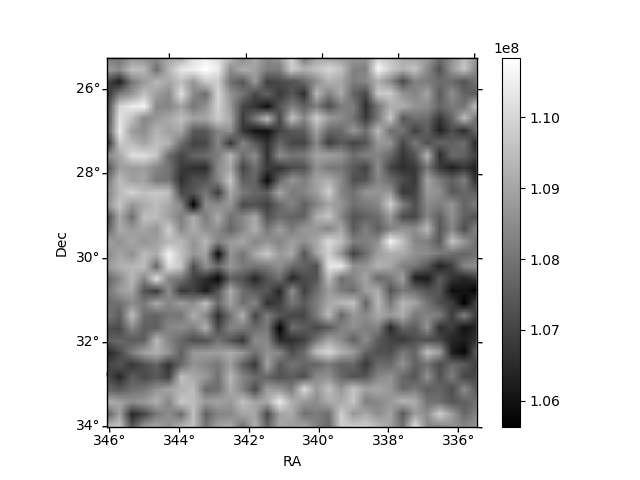
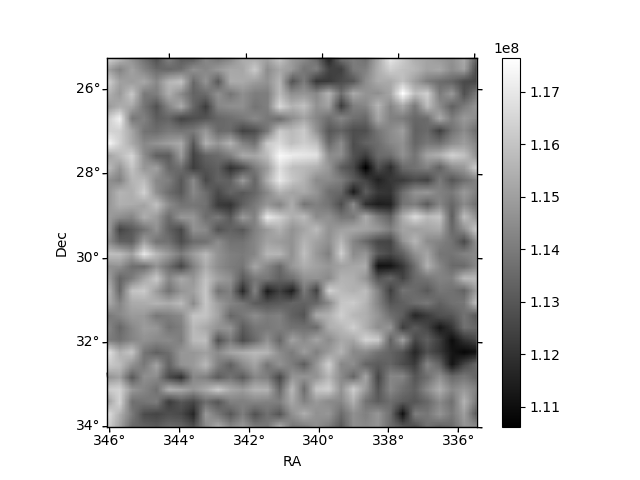
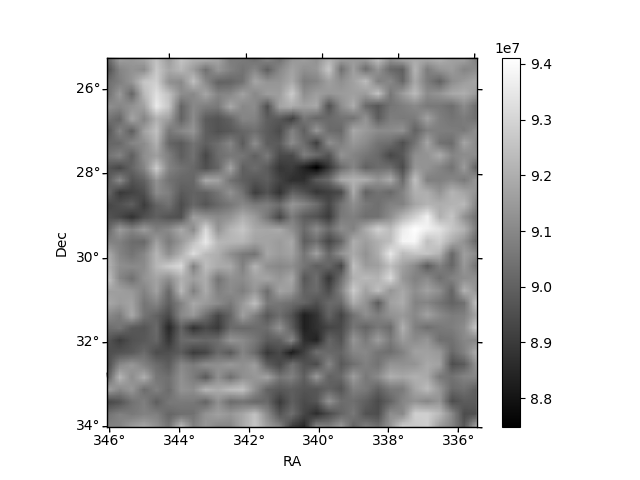
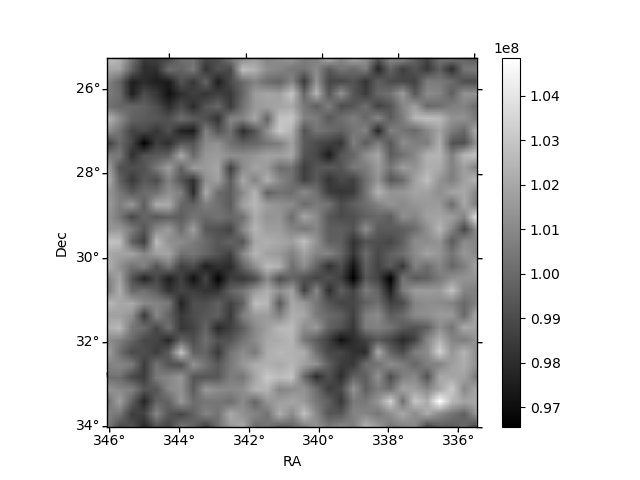
Histogram calculated using DETX and DETY for each event in the final _common_clean file
| Quadrant A | 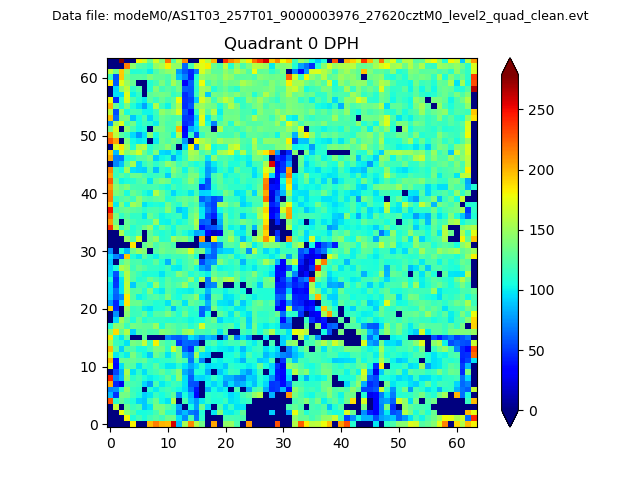 |
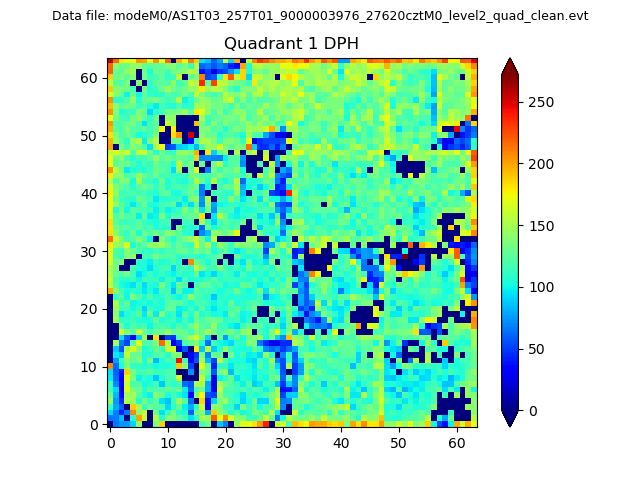 |
Quadrant B |
|---|---|---|---|
| Quadrant D | 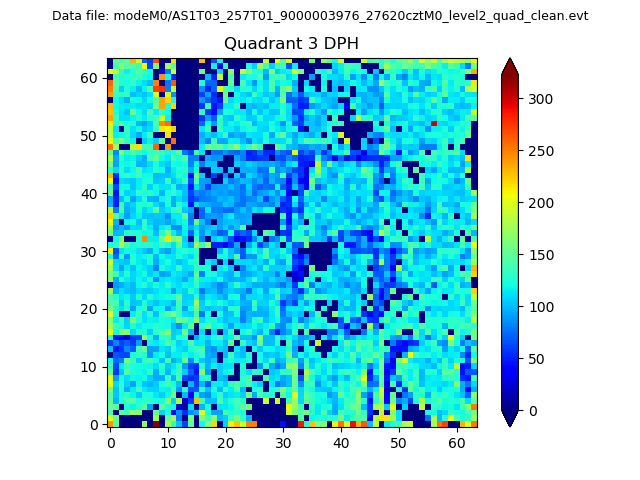 |
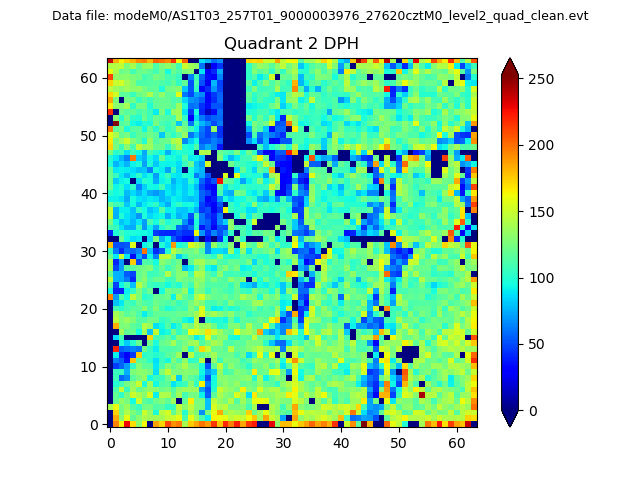 |
Quadrant C |
| Plot type | Count rate plots | Images |
|---|---|---|
| Comparison with Poisson distribution Blue bars denote a histogram of data divided into 1 sec bins. Red curve is a Poisson curve with rate = median count rate of data. |
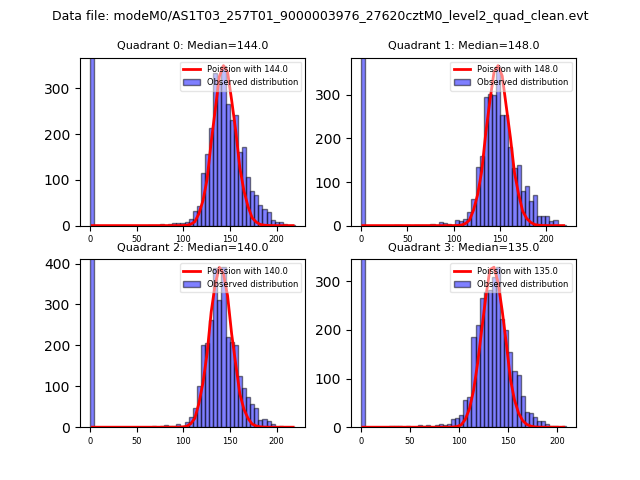 |
 |
| Quadrant-wise count rates Data is divided into 100 sec bins |
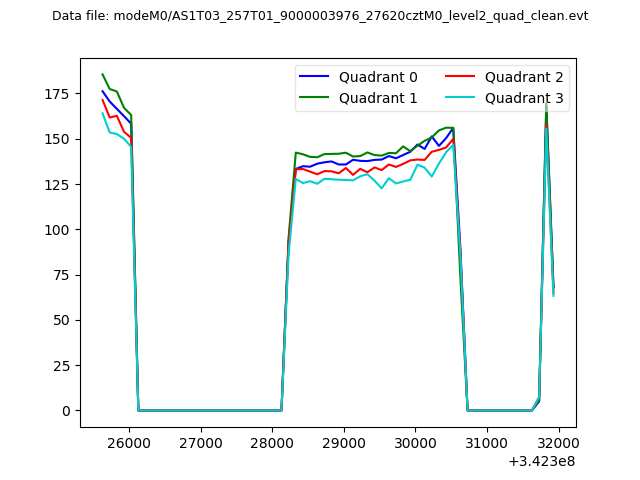 |
|
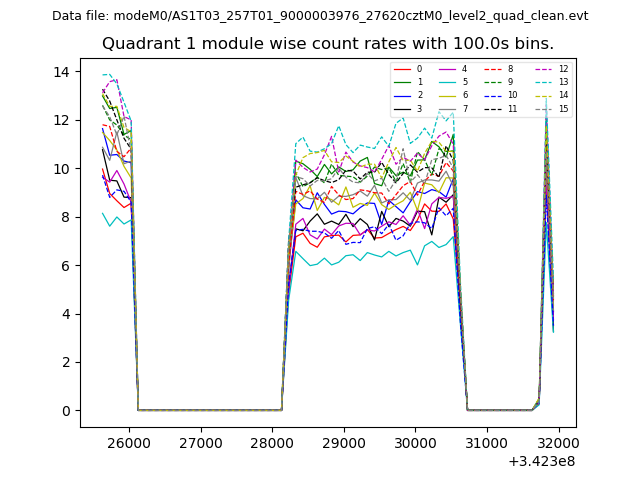
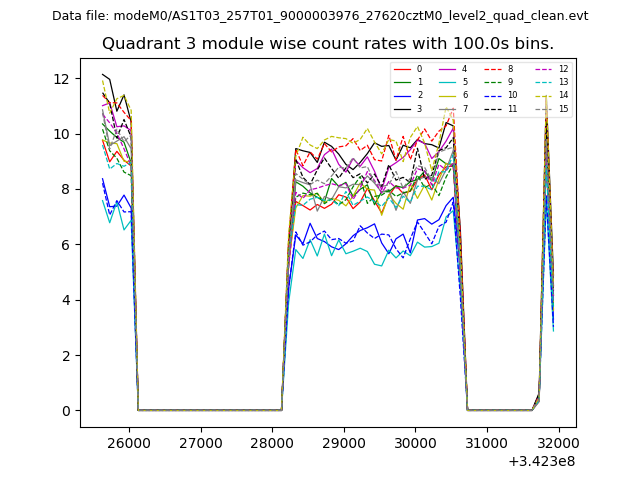
| Module-wise count rates for Quadrant A Data is divided into 100 sec bins |
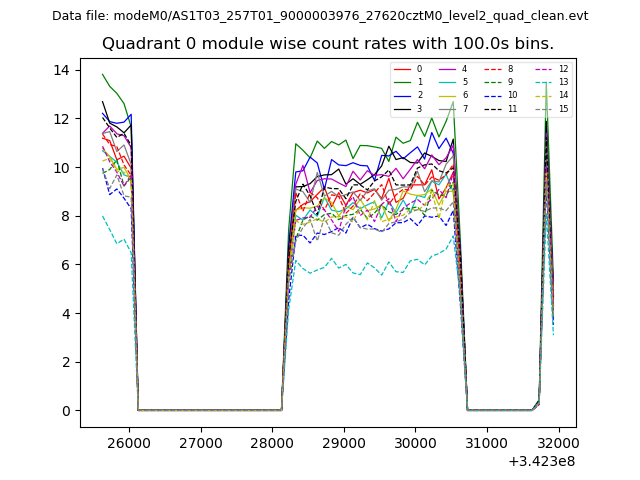 |
 |
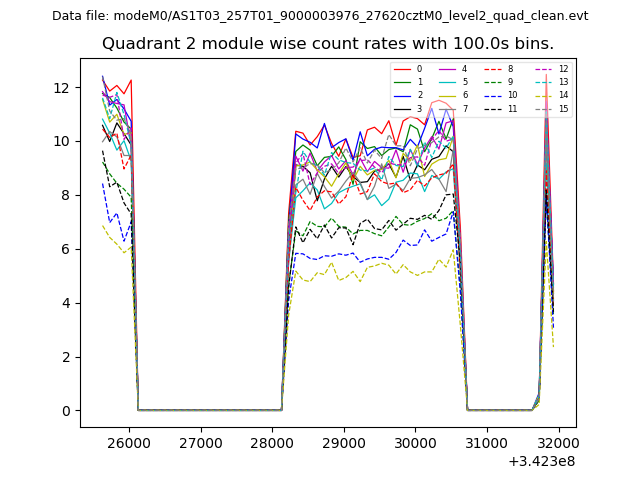
| Module-wise count rates for Quadrant B Data is divided into 100 sec bins |
 |
 |
| Module-wise count rates for Quadrant C Data is divided into 100 sec bins |
 |
 |
| Module-wise count rates for Quadrant D Data is divided into 100 sec bins |
 |
 |
| Parameter | Plot |
|---|---|
| CZT HV Monitor | 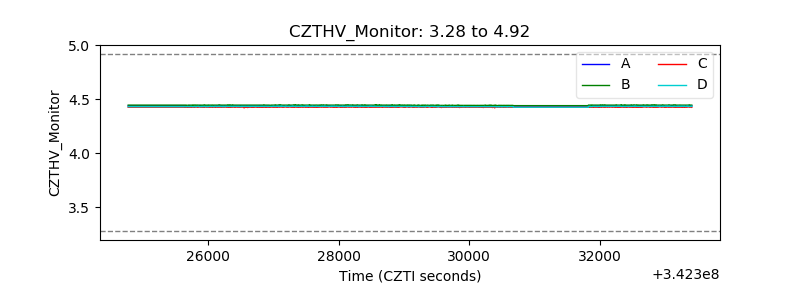 |
| D_VDD | 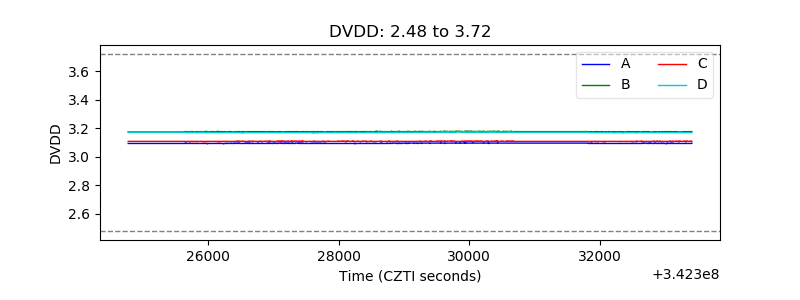 |
| Temperature 1 | 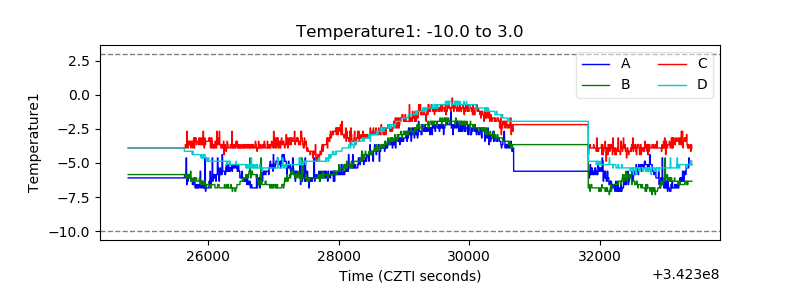 |
| Veto HV Monitor | 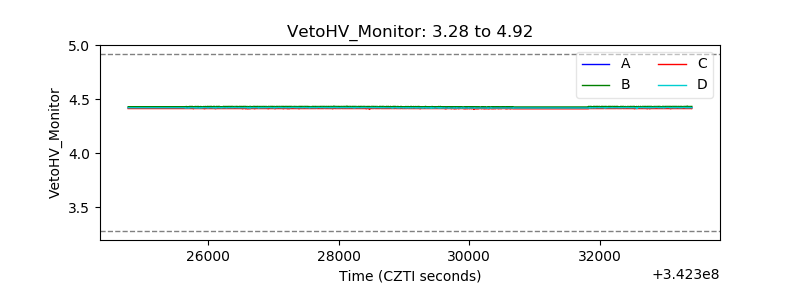 |
| Veto LLD | 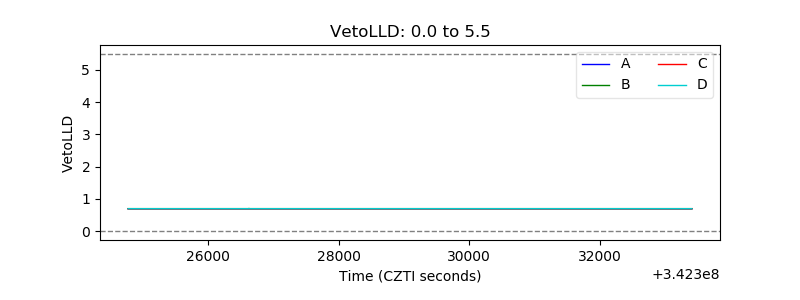 |
| Alpha Counter | 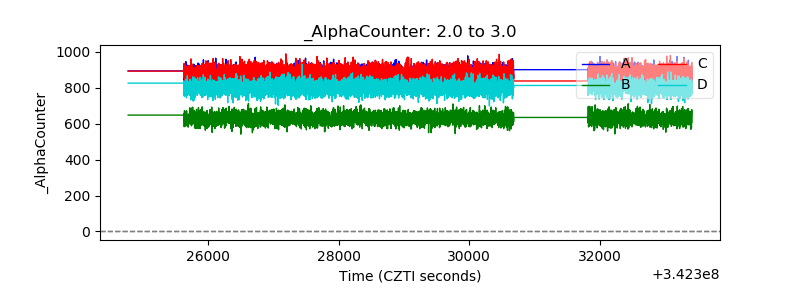 |
| _CPM_Rate | 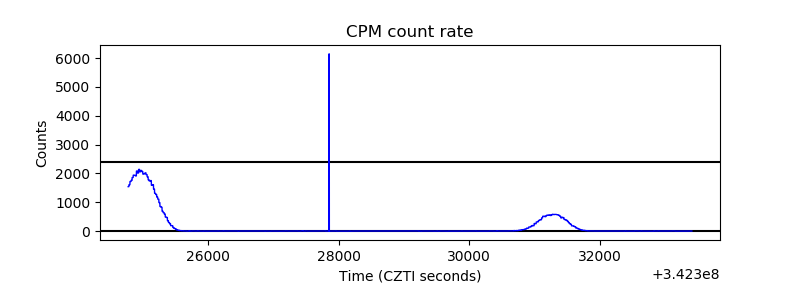 |
| CZT Counter | 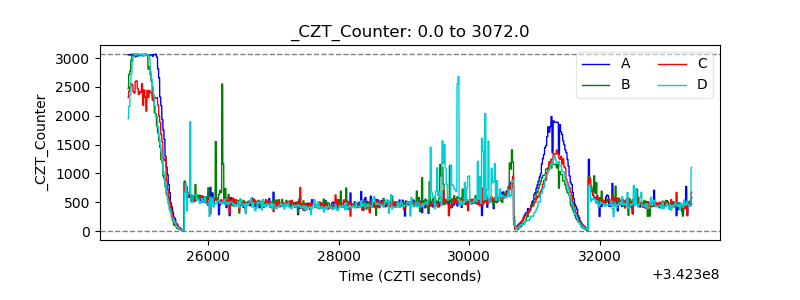 |
| +2.5 Volts monitor | 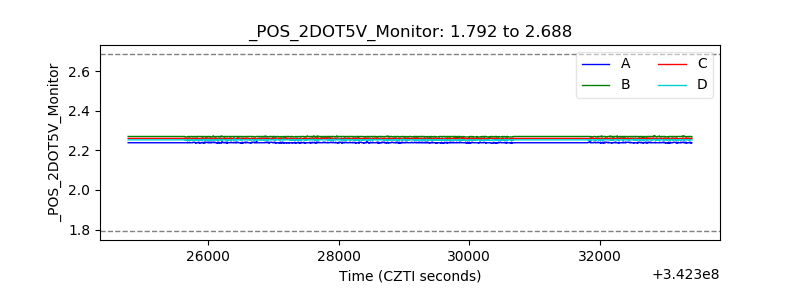 |
| +5 Volts monitor |  |
| _ROLL_ROT | 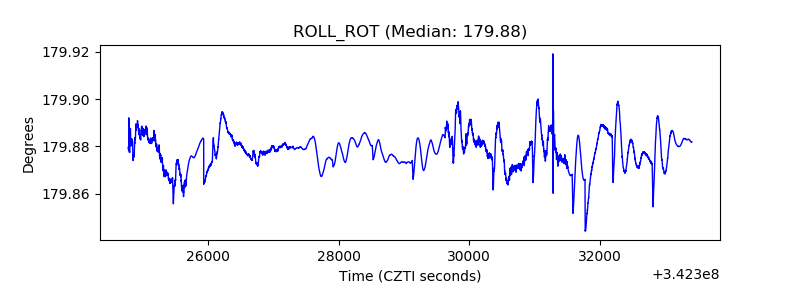 |
| _Roll_DEC | 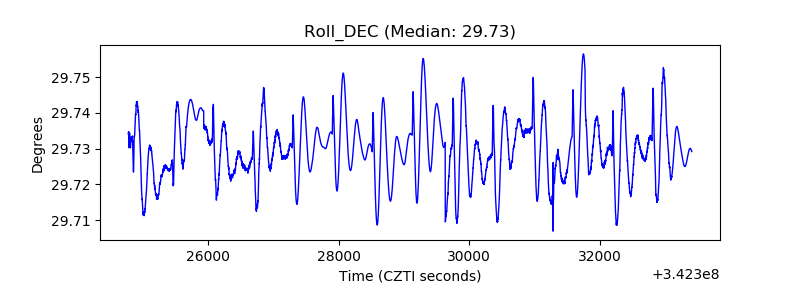 |
| _Roll_RA | 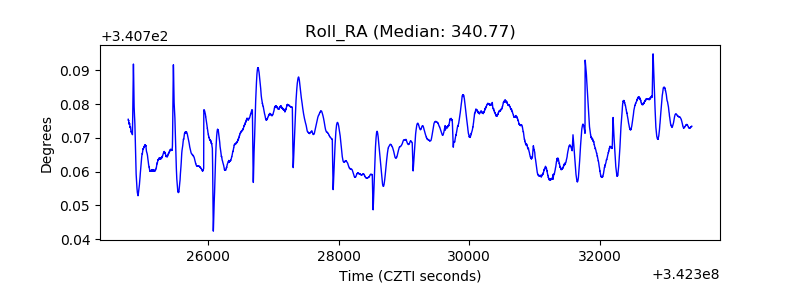 |
| Veto Counter | 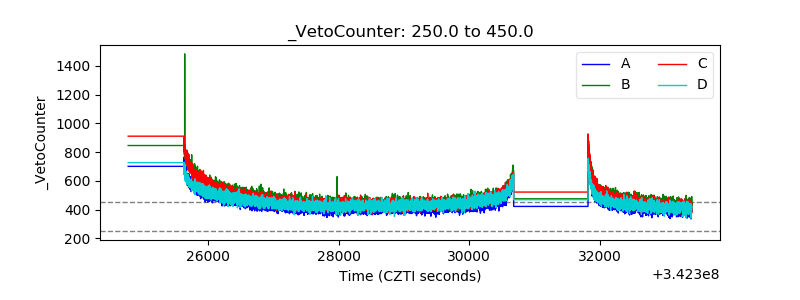 |