| Param | Original file | Final file |
|---|---|---|
| Filename | modeM0/AS1T03_257T01_9000003976_27621cztM0_level2.evt | modeM0/AS1T03_257T01_9000003976_27621cztM0_level2_quad_clean.evt |
| Size (bytes) | 505,774,080 | 74,839,680 |
| Size | 482.3 MB | 71.4 MB |
| Events in quadrant A | 3,419,349 | 454,781 |
| Events in quadrant B | 3,951,391 | 461,728 |
| Events in quadrant C | 3,440,255 | 440,303 |
| Events in quadrant D | 4,030,778 | 421,330 |
| Mode M9 | |||
|---|---|---|---|
| Quadrant | BADHDUFLAG | Total packets | Discarded packets |
| A | 0 | 7 | 0 |
| B | 0 | 8 | 0 |
| C | 0 | 8 | 0 |
| D | 0 | 8 | 0 |
| Mode M0 | |||
|---|---|---|---|
| Quadrant | BADHDUFLAG | Total packets | Discarded packets |
| A | 0 | 14539 | 0 |
| B | 0 | 15982 | 0 |
| C | 0 | 14528 | 0 |
| D | 0 | 16561 | 0 |
| Quadrant | Total seconds | Saturated seconds | Saturation percentage |
|---|---|---|---|
| A | 7005 | 104 | 1.484654% |
| B | 7005 | 250 | 3.568879% |
| C | 7005 | 136 | 1.941470% |
| D | 7005 | 171 | 2.441113% |
Noise dominated data is calculated using 1-second bins in cleaned event files. If a bin has >2000 counts, and if more than 50% of those come from <1% of pixels, then it is considered to be noise-dominated and hence unusable.
| Quadrant | # 1 sec bins | Bins with >0 counts | Bins with >2000 counts | High rate bins dominated by noise | Noise dominated (total time) | Noise dominated (detector-on time) | Marked lightcurve |
|---|---|---|---|---|---|---|---|
| A | 7690 | 7007 | 0 | 0 | 0.00% | 0.00% | 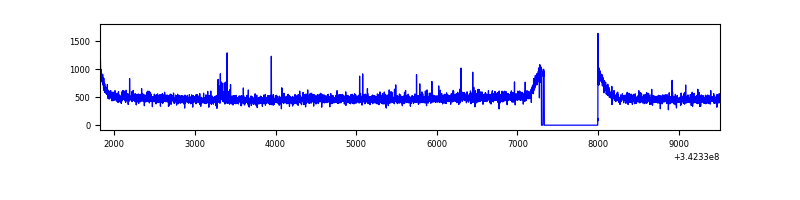 |
| B | 7690 | 7007 | 69 | 69 | 0.90% | 0.98% | 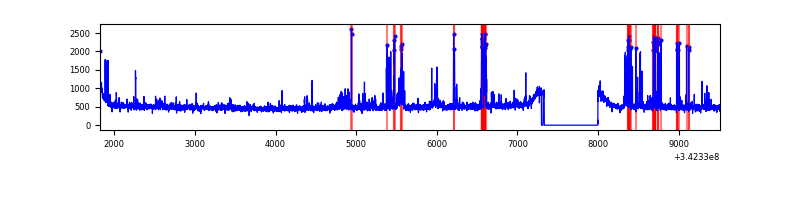 |
| C | 7690 | 7007 | 0 | 0 | 0.00% | 0.00% | 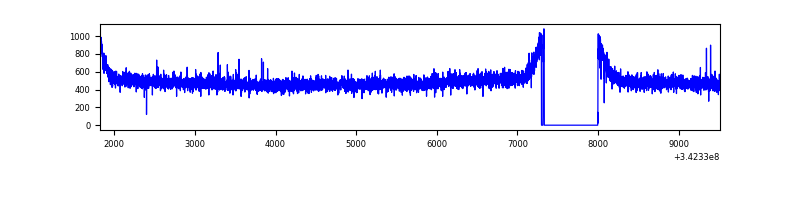 |
| D | 7690 | 7007 | 81 | 81 | 1.05% | 1.16% | 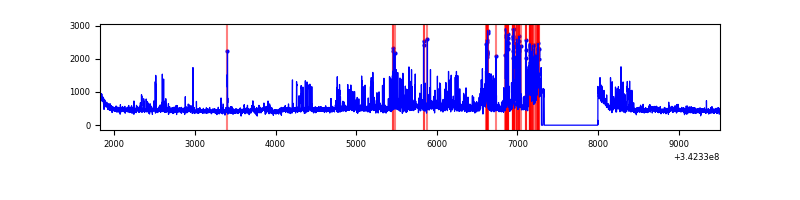 |
Top three noisy pixels from each quadrant. If the there are fewer than three noisy pixels in the level2.evt file, extra rows are filled as -1
| Pixel properties | Quadrant properties | ||||||
|---|---|---|---|---|---|---|---|
| Quadrant | DetID | PixID | Counts | Sigma | Mean | Median | Sigma |
| A | 12 | 96 | 16587 | 89.3 | 880 | 861 | 176.1 |
| A | 13 | 254 | 10299 | 53.6 | 880 | 861 | 176.1 |
| A | 3 | 137 | 8502 | 43.39 | 880 | 861 | 176.1 |
| B | 3 | 64 | 268272 | 1597.87 | 872 | 851 | 167.4 |
| B | 10 | 245 | 223620 | 1331.07 | 872 | 851 | 167.4 |
| B | 0 | 230 | 22047 | 126.65 | 872 | 851 | 167.4 |
| C | 14 | 238 | 137409 | 685.99 | 845 | 852 | 199.1 |
| C | 2 | 16 | 6707 | 29.41 | 845 | 852 | 199.1 |
| C | 13 | 61 | 5648 | 24.09 | 845 | 852 | 199.1 |
| D | 7 | 80 | 470240 | 2325.98 | 841 | 816 | 201.8 |
| D | 1 | 52 | 225535 | 1113.48 | 841 | 816 | 201.8 |
| D | 2 | 250 | 127460 | 627.52 | 841 | 816 | 201.8 |
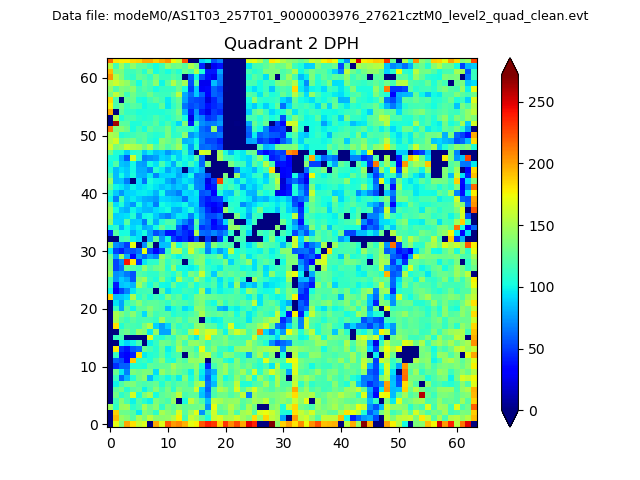
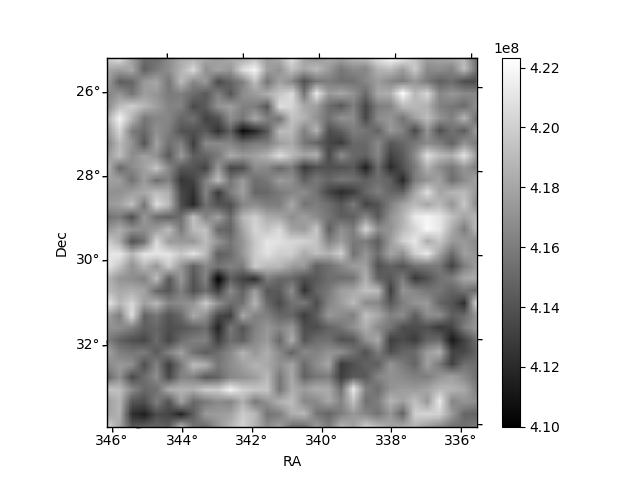
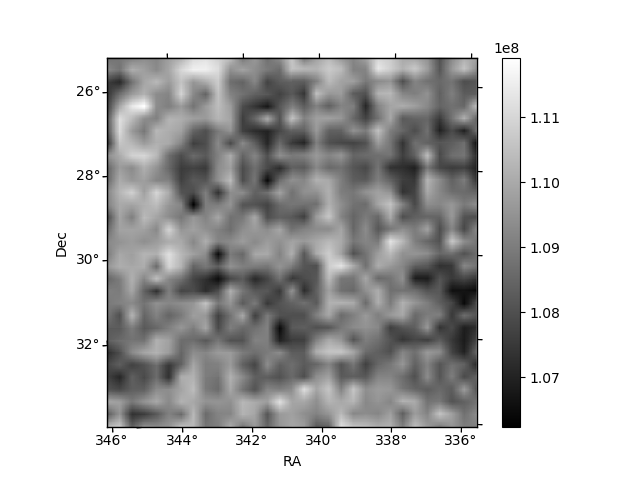
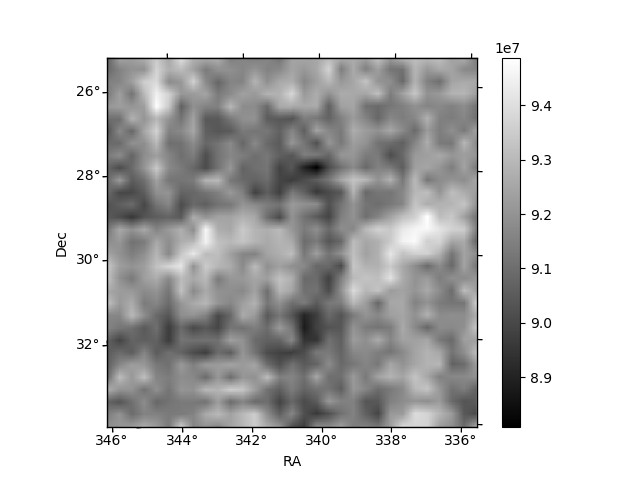
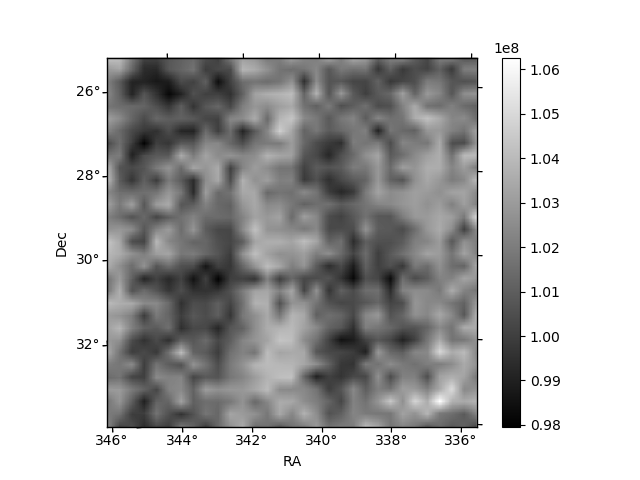
Histogram calculated using DETX and DETY for each event in the final _common_clean file
| Quadrant A | 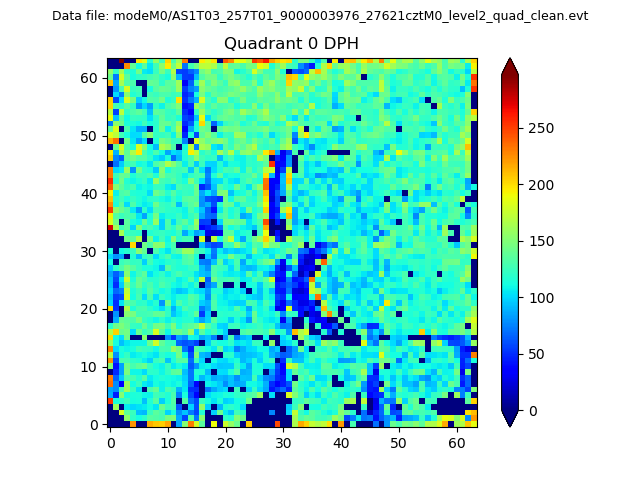 |
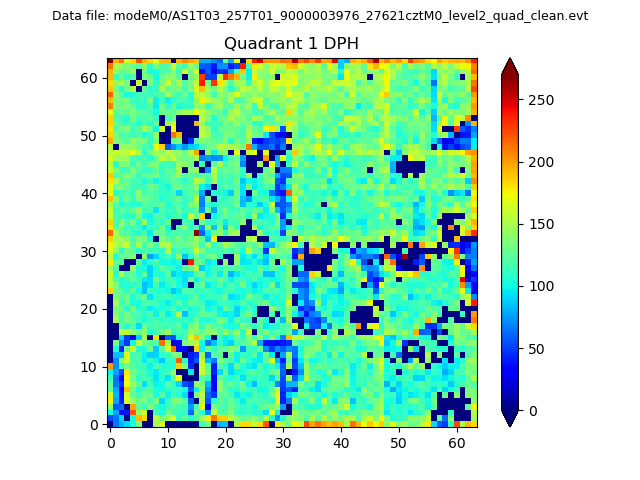 |
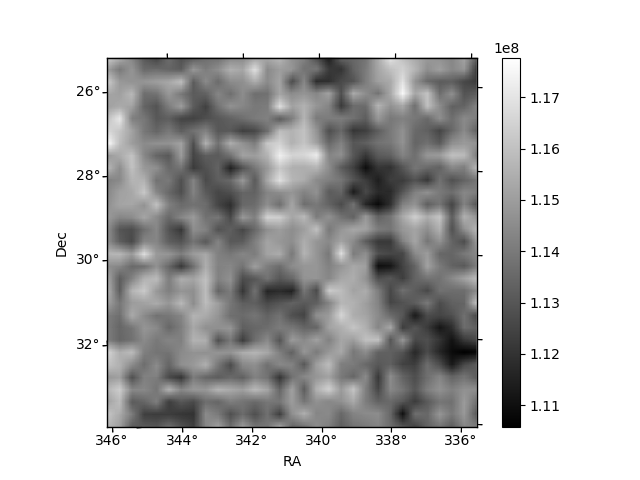
Quadrant B |
|---|---|---|---|
| Quadrant D | 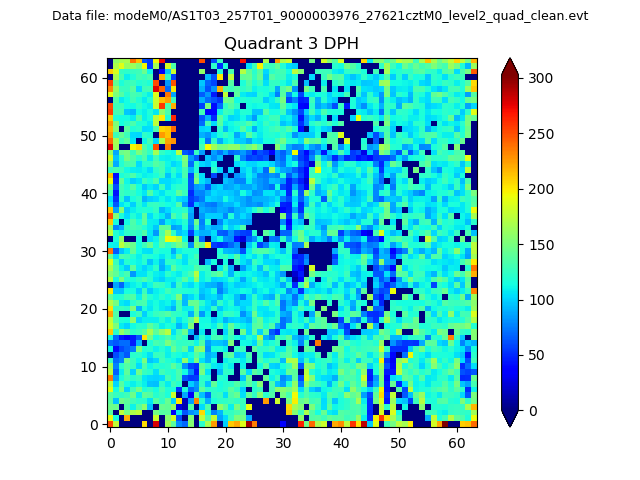 |
 |
Quadrant C |
| Plot type | Count rate plots | Images |
|---|---|---|
| Comparison with Poisson distribution Blue bars denote a histogram of data divided into 1 sec bins. Red curve is a Poisson curve with rate = median count rate of data. |
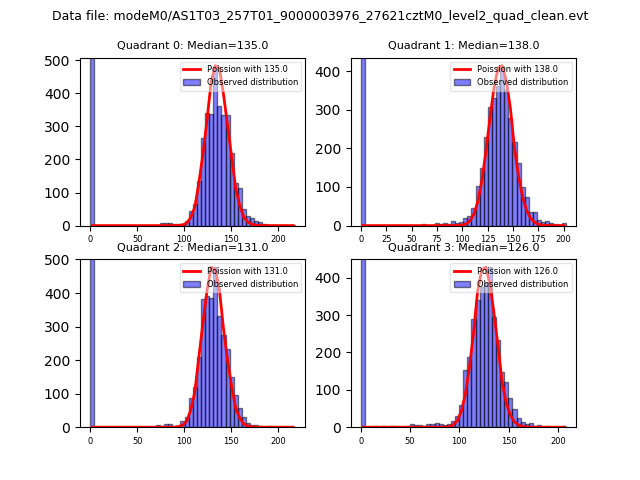 |
 |
| Quadrant-wise count rates Data is divided into 100 sec bins |
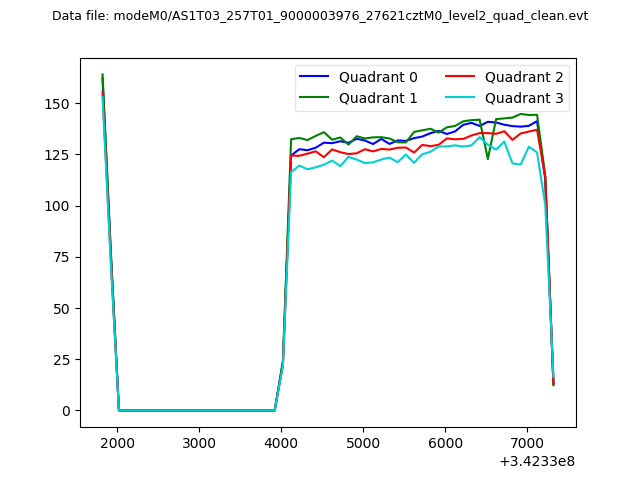 |
|
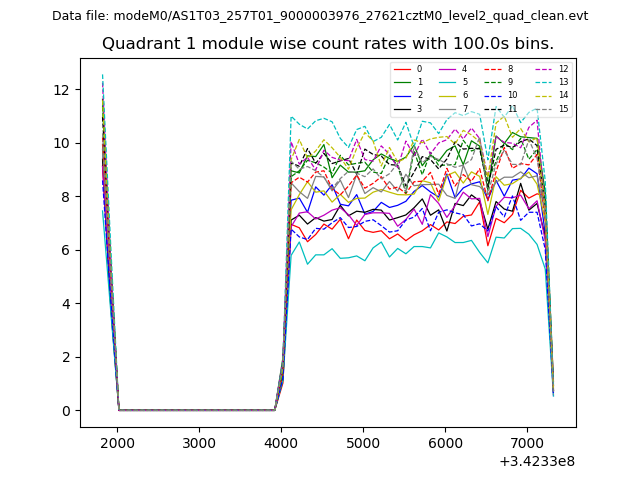
| Module-wise count rates for Quadrant A Data is divided into 100 sec bins |
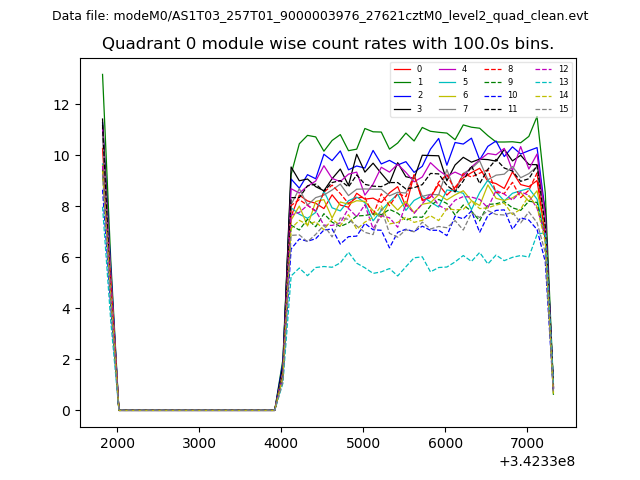 |
 |
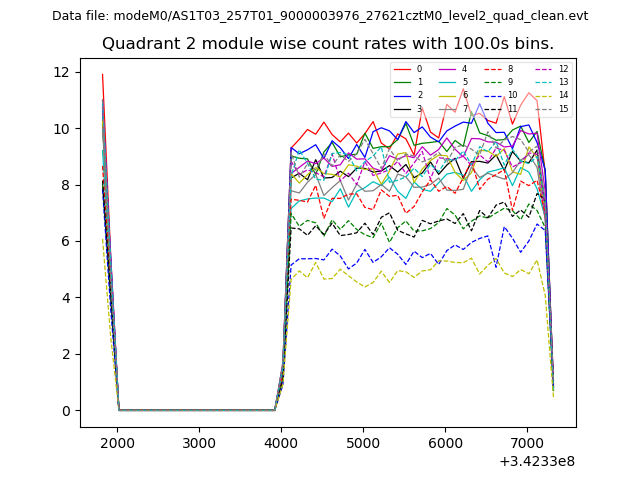
| Module-wise count rates for Quadrant B Data is divided into 100 sec bins |
 |
 |
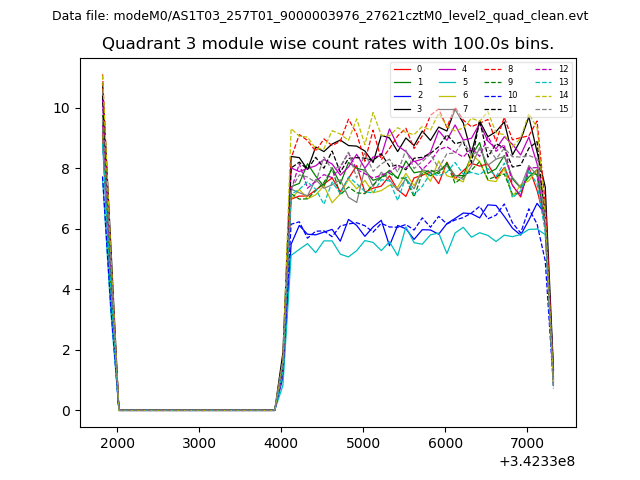
| Module-wise count rates for Quadrant C Data is divided into 100 sec bins |
 |
 |
| Module-wise count rates for Quadrant D Data is divided into 100 sec bins |
 |
 |
| Parameter | Plot |
|---|---|
| CZT HV Monitor | 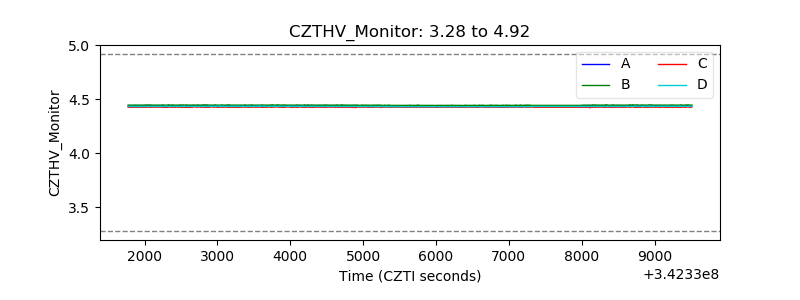 |
| D_VDD | 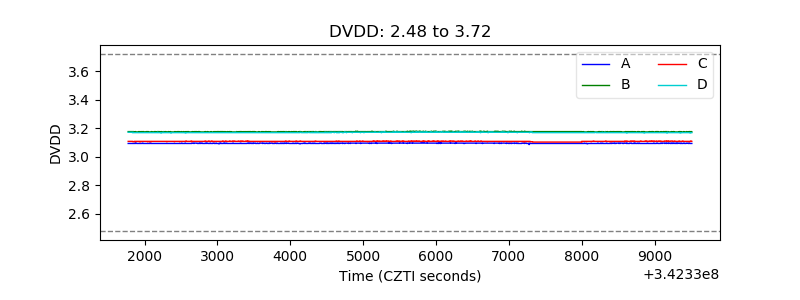 |
| Temperature 1 | 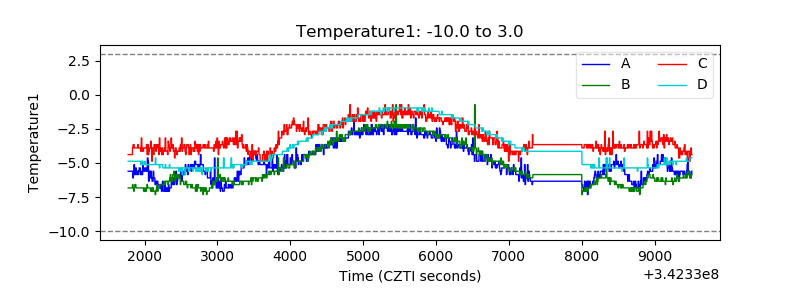 |
| Veto HV Monitor | 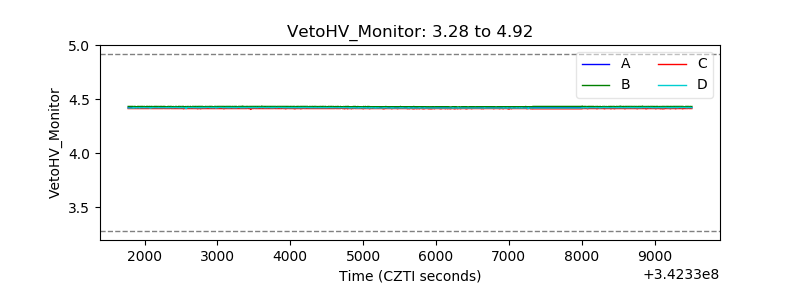 |
| Veto LLD | 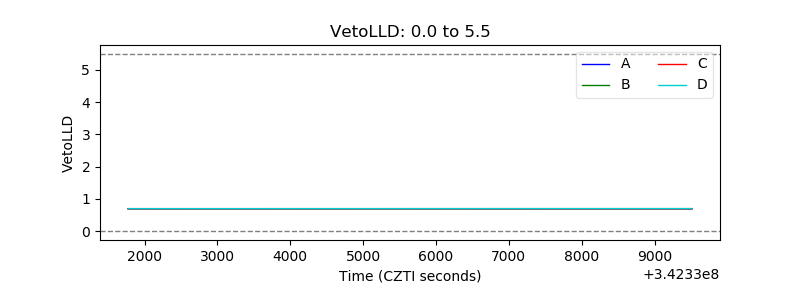 |
| Alpha Counter | 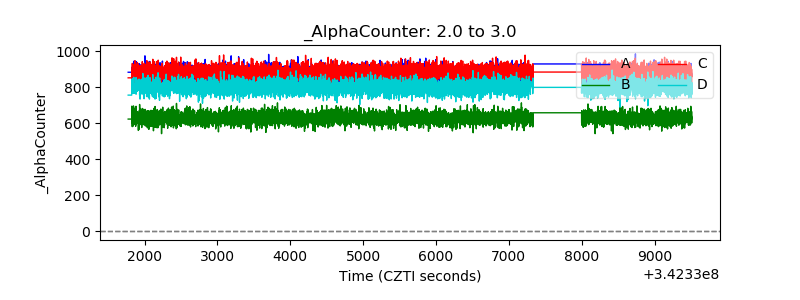 |
| _CPM_Rate | 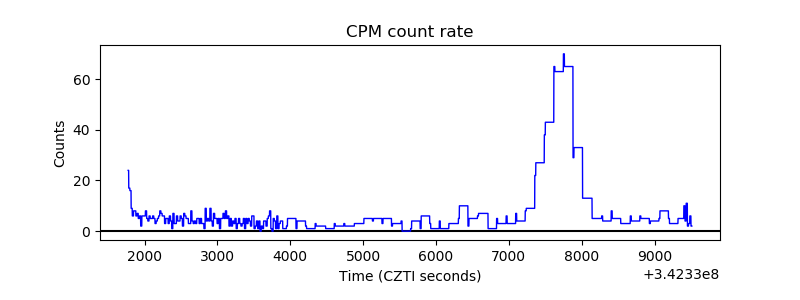 |
| CZT Counter | 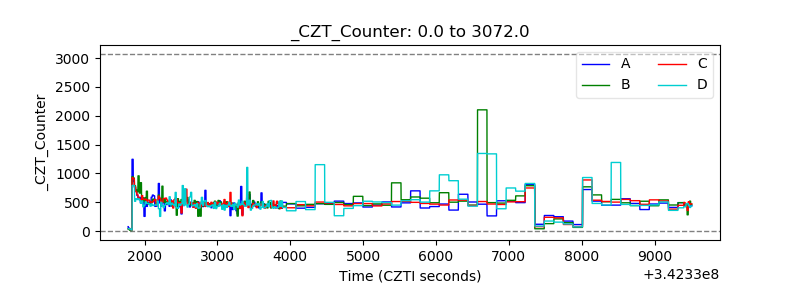 |
| +2.5 Volts monitor |  |
| +5 Volts monitor |  |
| _ROLL_ROT | 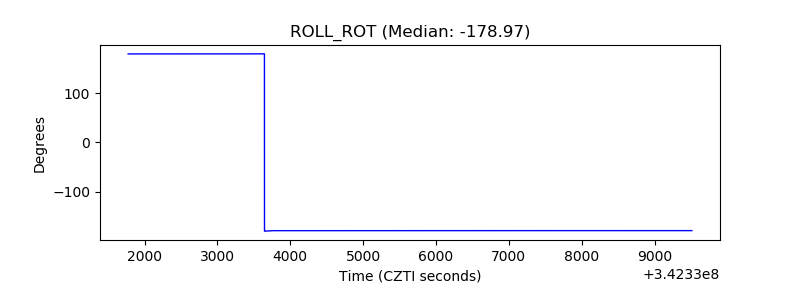 |
| _Roll_DEC | 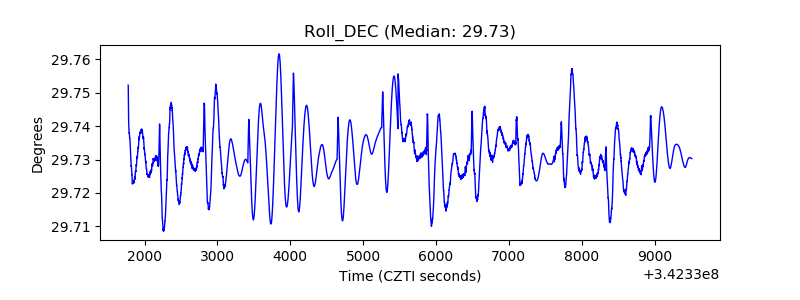 |
| _Roll_RA | 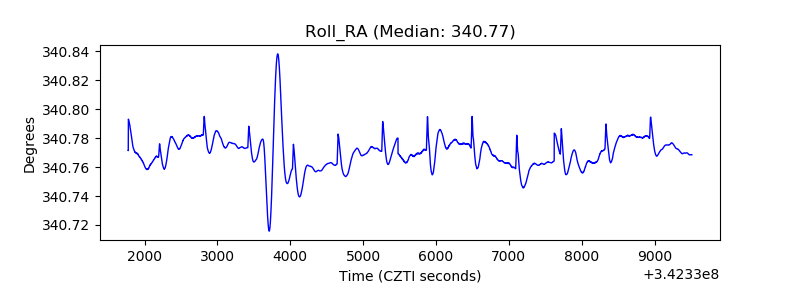 |
| Veto Counter | 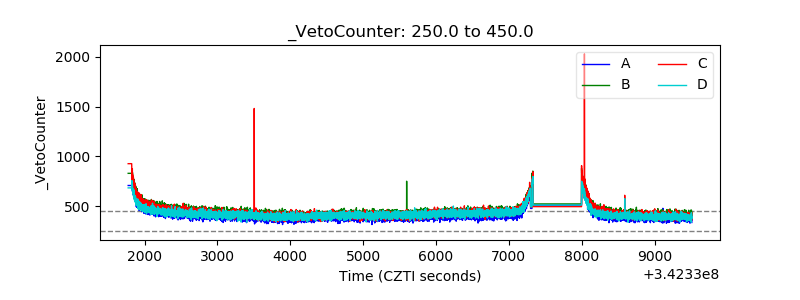 |