| Param | Original file | Final file |
|---|---|---|
| Filename | modeM0/AS1T03_257T01_9000003976_27622cztM0_level2.evt | modeM0/AS1T03_257T01_9000003976_27622cztM0_level2_quad_clean.evt |
| Size (bytes) | 604,779,840 | 87,615,360 |
| Size | 576.8 MB | 83.6 MB |
| Events in quadrant A | 3,923,293 | 536,485 |
| Events in quadrant B | 4,844,993 | 538,790 |
| Events in quadrant C | 4,013,409 | 519,066 |
| Events in quadrant D | 4,990,324 | 501,556 |
| Mode M9 | |||
|---|---|---|---|
| Quadrant | BADHDUFLAG | Total packets | Discarded packets |
| A | 0 | 9 | 0 |
| B | 0 | 9 | 0 |
| C | 0 | 9 | 0 |
| D | 0 | 9 | 0 |
| Mode M0 | |||
|---|---|---|---|
| Quadrant | BADHDUFLAG | Total packets | Discarded packets |
| A | 0 | 16815 | 0 |
| B | 0 | 19462 | 0 |
| C | 0 | 16963 | 0 |
| D | 0 | 20372 | 0 |
| Quadrant | Total seconds | Saturated seconds | Saturation percentage |
|---|---|---|---|
| A | 8016 | 251 | 3.131238% |
| B | 8017 | 488 | 6.087065% |
| C | 8017 | 315 | 3.929151% |
| D | 8017 | 296 | 3.692154% |
Noise dominated data is calculated using 1-second bins in cleaned event files. If a bin has >2000 counts, and if more than 50% of those come from <1% of pixels, then it is considered to be noise-dominated and hence unusable.
| Quadrant | # 1 sec bins | Bins with >0 counts | Bins with >2000 counts | High rate bins dominated by noise | Noise dominated (total time) | Noise dominated (detector-on time) | Marked lightcurve |
|---|---|---|---|---|---|---|---|
| A | 8896 | 8019 | 0 | 0 | 0.00% | 0.00% | 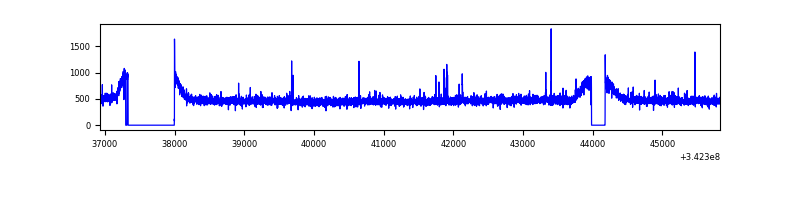 |
| B | 8897 | 8020 | 93 | 93 | 1.05% | 1.16% | 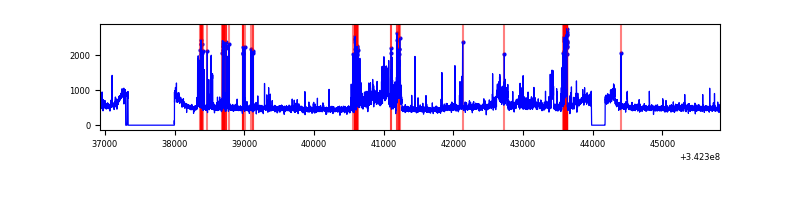 |
| C | 8897 | 8020 | 8 | 8 | 0.09% | 0.10% | 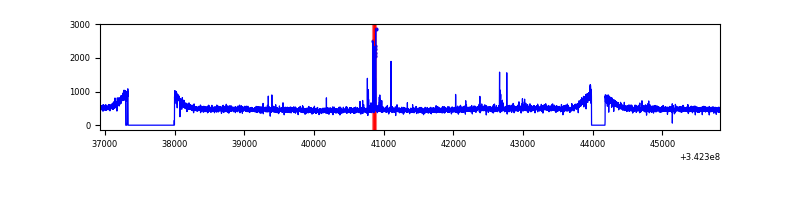 |
| D | 8897 | 8020 | 100 | 100 | 1.12% | 1.25% | 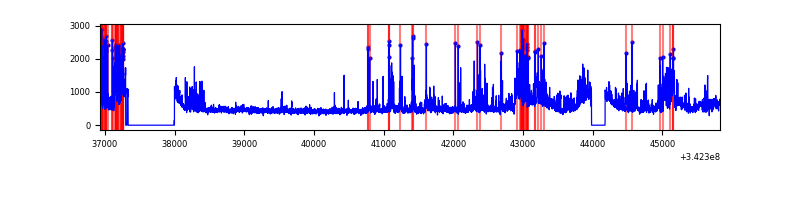 |
Top three noisy pixels from each quadrant. If the there are fewer than three noisy pixels in the level2.evt file, extra rows are filled as -1
| Pixel properties | Quadrant properties | ||||||
|---|---|---|---|---|---|---|---|
| Quadrant | DetID | PixID | Counts | Sigma | Mean | Median | Sigma |
| A | 12 | 96 | 18219 | 84.95 | 1008 | 983 | 202.9 |
| A | 13 | 254 | 12342 | 55.98 | 1008 | 983 | 202.9 |
| A | 3 | 137 | 10268 | 45.76 | 1008 | 983 | 202.9 |
| B | 3 | 64 | 710850 | 3686.62 | 996 | 970 | 192.6 |
| B | 10 | 245 | 132466 | 682.9 | 996 | 970 | 192.6 |
| B | 15 | 32 | 43109 | 218.84 | 996 | 970 | 192.6 |
| C | 14 | 238 | 154761 | 670.6 | 970 | 974 | 229.3 |
| C | 2 | 16 | 65869 | 282.98 | 970 | 974 | 229.3 |
| C | 3 | 233 | 8691 | 33.65 | 970 | 974 | 229.3 |
| D | 7 | 80 | 640548 | 2735.86 | 972 | 942 | 233.8 |
| D | 1 | 52 | 495078 | 2113.62 | 972 | 942 | 233.8 |
| D | 2 | 250 | 133330 | 566.28 | 972 | 942 | 233.8 |
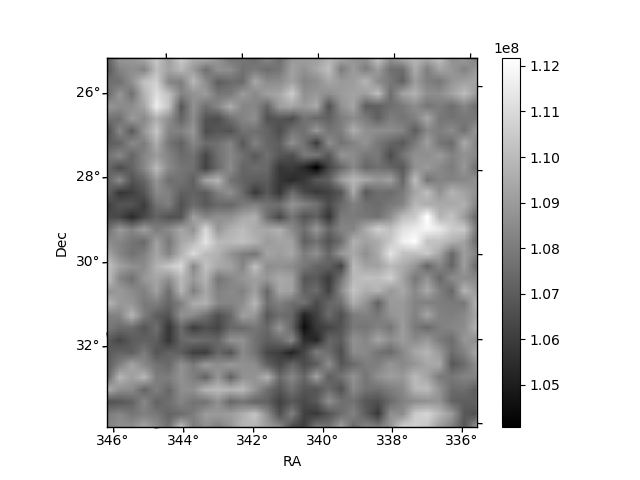
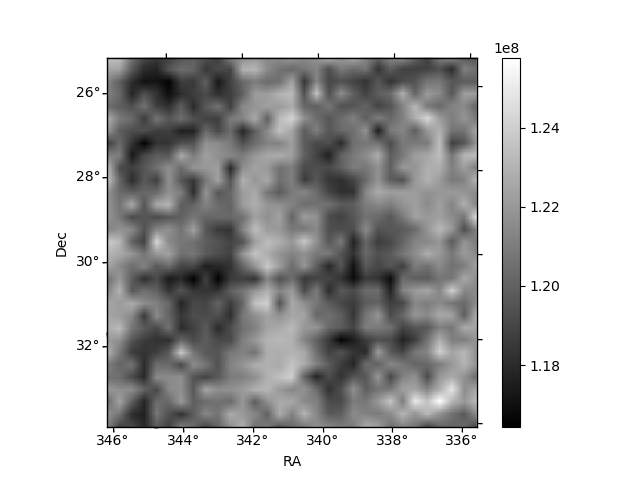
Histogram calculated using DETX and DETY for each event in the final _common_clean file
| Quadrant A |  |
 |
Quadrant B |
|---|---|---|---|
| Quadrant D |  |
 |
Quadrant C |
| Plot type | Count rate plots | Images |
|---|---|---|
| Comparison with Poisson distribution Blue bars denote a histogram of data divided into 1 sec bins. Red curve is a Poisson curve with rate = median count rate of data. |
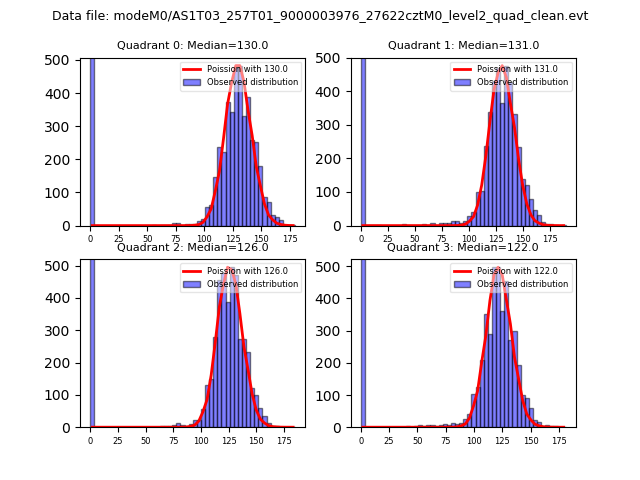 |
 |
| Quadrant-wise count rates Data is divided into 100 sec bins |
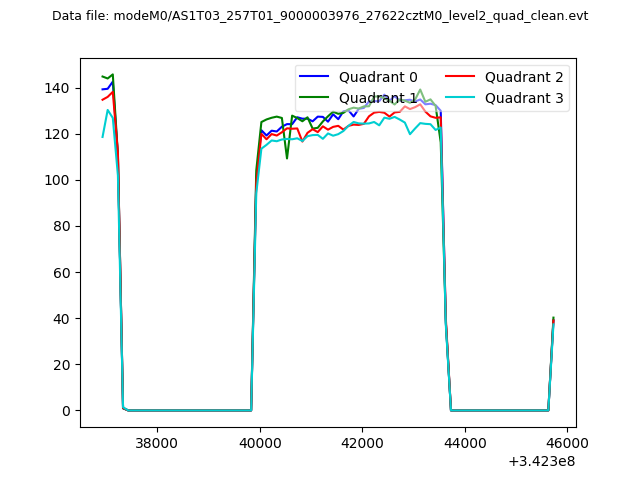 |
|
| Module-wise count rates for Quadrant A Data is divided into 100 sec bins |
 |
 |
| Module-wise count rates for Quadrant B Data is divided into 100 sec bins |
 |
 |
| Module-wise count rates for Quadrant C Data is divided into 100 sec bins |
 |
 |
| Module-wise count rates for Quadrant D Data is divided into 100 sec bins |
 |
 |
| Parameter | Plot |
|---|---|
| CZT HV Monitor |  |
| D_VDD | 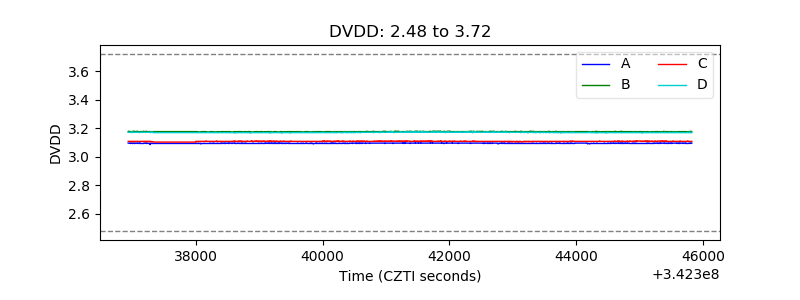 |
| Temperature 1 |  |
| Veto HV Monitor |  |
| Veto LLD |  |
| Alpha Counter |  |
| _CPM_Rate | 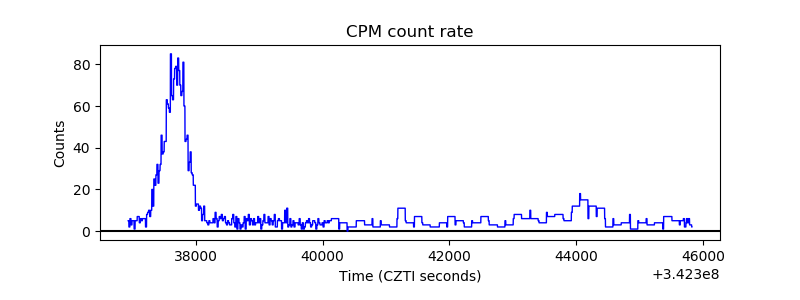 |
| CZT Counter |  |
| +2.5 Volts monitor |  |
| +5 Volts monitor |  |
| _ROLL_ROT |  |
| _Roll_DEC |  |
| _Roll_RA |  |
| Veto Counter |  |