| Param | Original file | Final file |
|---|---|---|
| Filename | modeM0/AS1T03_257T01_9000003976_27623cztM0_level2.evt | modeM0/AS1T03_257T01_9000003976_27623cztM0_level2_quad_clean.evt |
| Size (bytes) | 632,583,360 | 87,433,920 |
| Size | 603.3 MB | 83.4 MB |
| Events in quadrant A | 3,845,014 | 536,107 |
| Events in quadrant B | 6,519,197 | 529,154 |
| Events in quadrant C | 3,907,676 | 519,503 |
| Events in quadrant D | 4,343,357 | 507,125 |
| Mode M0 | |||
|---|---|---|---|
| Quadrant | BADHDUFLAG | Total packets | Discarded packets |
| A | 0 | 16651 | 0 |
| B | 0 | 24584 | 0 |
| C | 0 | 16697 | 0 |
| D | 0 | 18382 | 0 |
| Quadrant | Total seconds | Saturated seconds | Saturation percentage |
|---|---|---|---|
| A | 7993 | 286 | 3.578131% |
| B | 7994 | 1320 | 16.512384% |
| C | 7994 | 302 | 3.777833% |
| D | 7994 | 197 | 2.464348% |
Noise dominated data is calculated using 1-second bins in cleaned event files. If a bin has >2000 counts, and if more than 50% of those come from <1% of pixels, then it is considered to be noise-dominated and hence unusable.
| Quadrant | # 1 sec bins | Bins with >0 counts | Bins with >2000 counts | High rate bins dominated by noise | Noise dominated (total time) | Noise dominated (detector-on time) | Marked lightcurve |
|---|---|---|---|---|---|---|---|
| A | 8008 | 7994 | 2 | 2 | 0.02% | 0.03% | 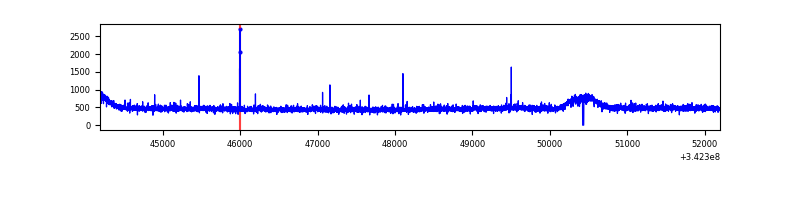 |
| B | 8009 | 7994 | 667 | 667 | 8.33% | 8.34% | 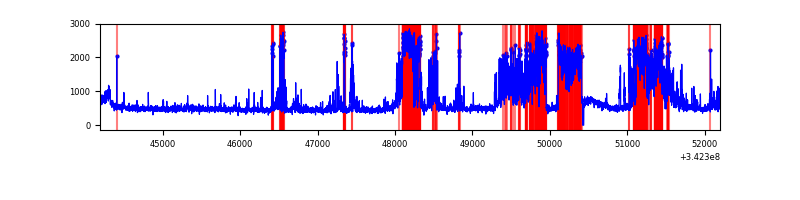 |
| C | 8009 | 7995 | 0 | 0 | 0.00% | 0.00% | 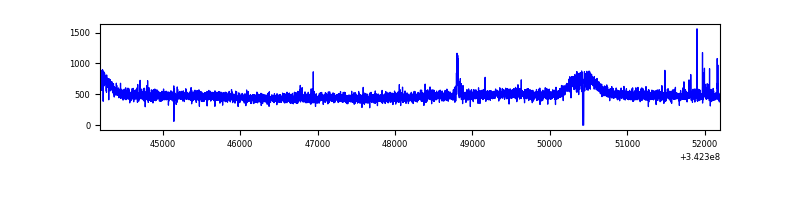 |
| D | 8009 | 7994 | 20 | 20 | 0.25% | 0.25% | 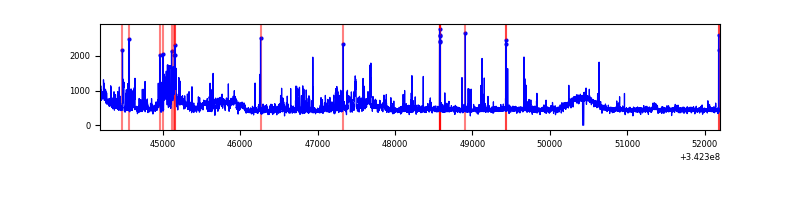 |
Top three noisy pixels from each quadrant. If the there are fewer than three noisy pixels in the level2.evt file, extra rows are filled as -1
| Pixel properties | Quadrant properties | ||||||
|---|---|---|---|---|---|---|---|
| Quadrant | DetID | PixID | Counts | Sigma | Mean | Median | Sigma |
| A | 12 | 96 | 17284 | 80.91 | 990 | 967 | 201.7 |
| A | 13 | 254 | 12522 | 57.3 | 990 | 967 | 201.7 |
| A | 3 | 137 | 10025 | 44.91 | 990 | 967 | 201.7 |
| B | 3 | 64 | 2083590 | 11649.15 | 926 | 900 | 178.8 |
| B | 10 | 245 | 704936 | 3937.9 | 926 | 900 | 178.8 |
| B | 15 | 222 | 36923 | 201.49 | 926 | 900 | 178.8 |
| C | 14 | 238 | 153279 | 680.22 | 951 | 955 | 223.9 |
| C | 2 | 16 | 20405 | 86.86 | 951 | 955 | 223.9 |
| C | 10 | 22 | 14821 | 61.92 | 951 | 955 | 223.9 |
| D | 1 | 52 | 446791 | 1936.7 | 958 | 929 | 230.2 |
| D | 7 | 80 | 184206 | 796.11 | 958 | 929 | 230.2 |
| D | 2 | 250 | 55281 | 236.09 | 958 | 929 | 230.2 |
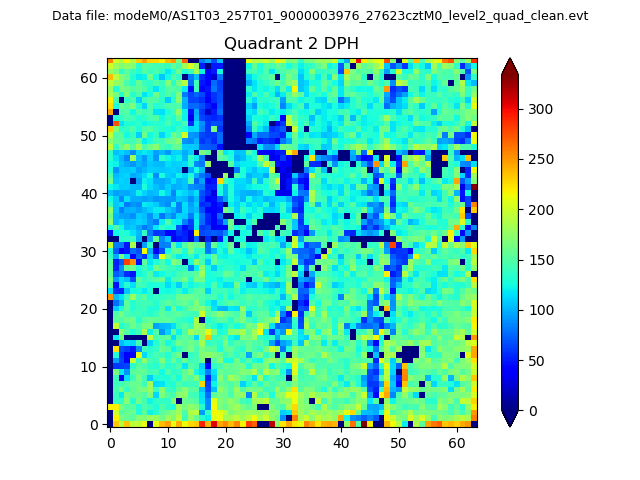
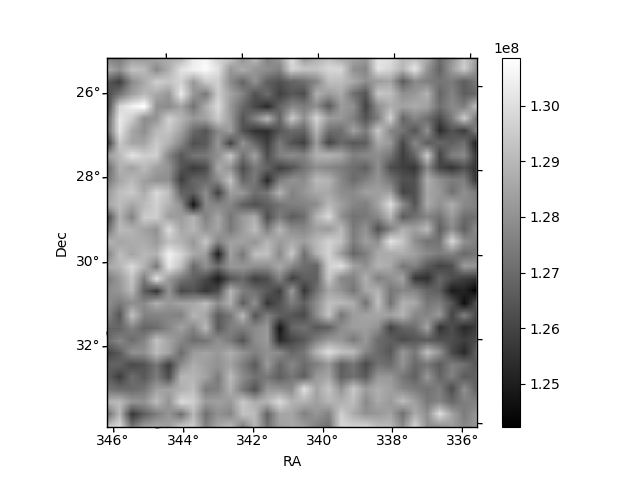
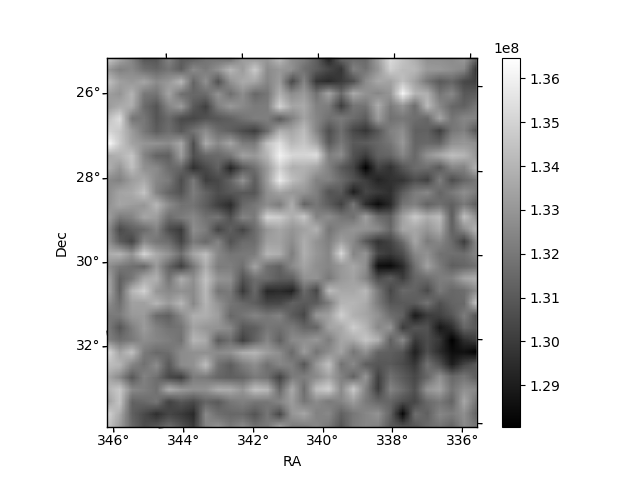
Histogram calculated using DETX and DETY for each event in the final _common_clean file
| Quadrant A |  |
 |
Quadrant B |
|---|---|---|---|
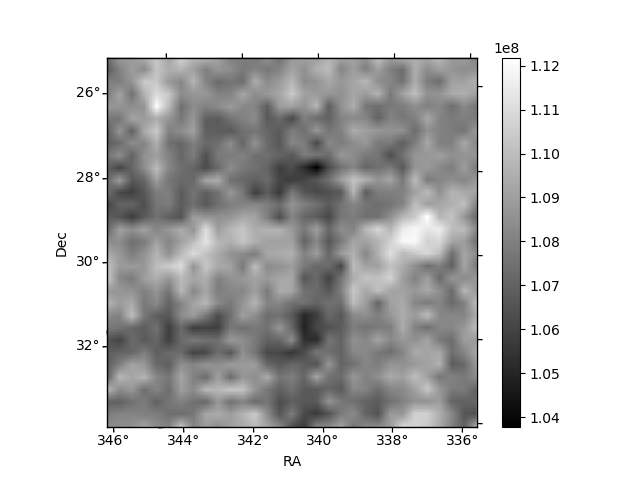
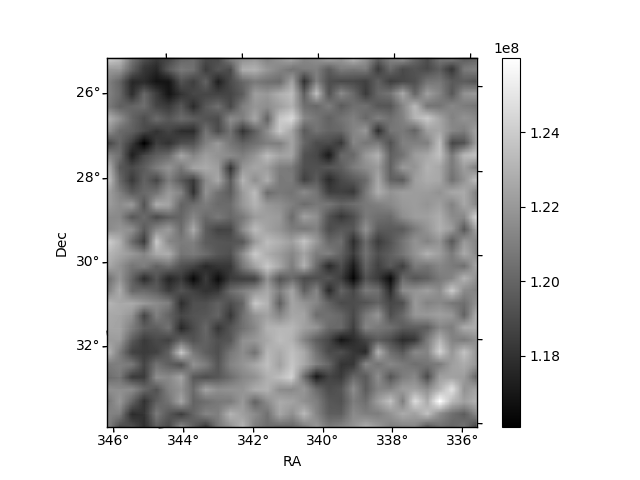
| Quadrant D | 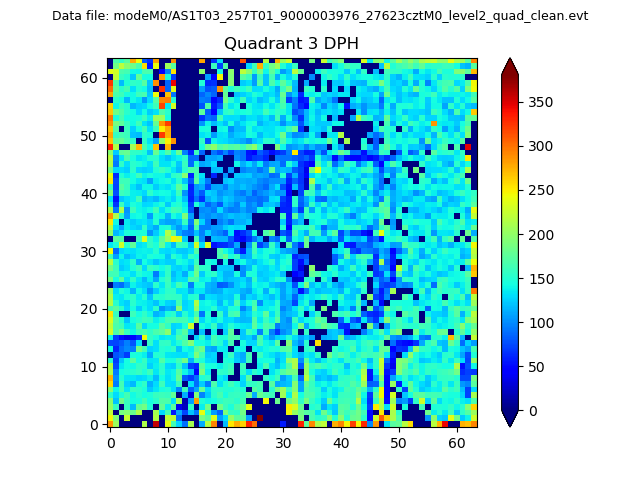 |
 |
Quadrant C |
| Plot type | Count rate plots | Images |
|---|---|---|
| Comparison with Poisson distribution Blue bars denote a histogram of data divided into 1 sec bins. Red curve is a Poisson curve with rate = median count rate of data. |
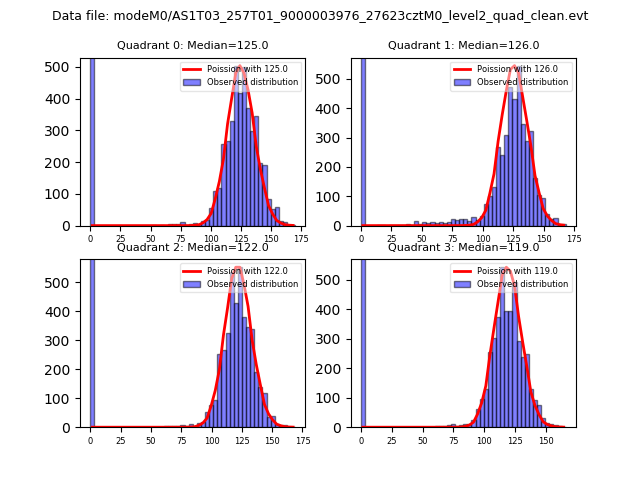 |
 |
| Quadrant-wise count rates Data is divided into 100 sec bins |
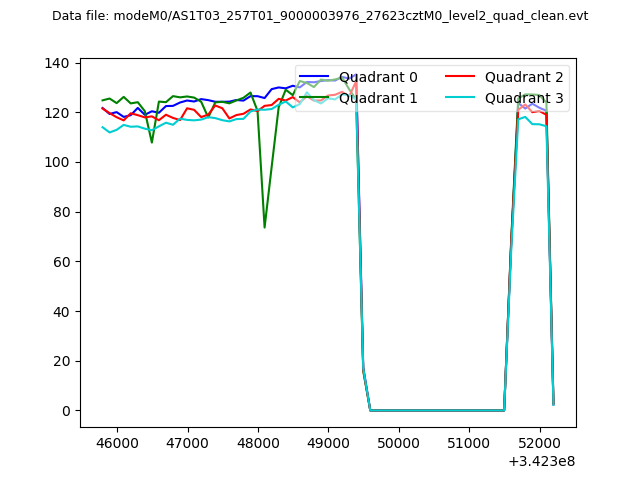 |
|
| Module-wise count rates for Quadrant A Data is divided into 100 sec bins |
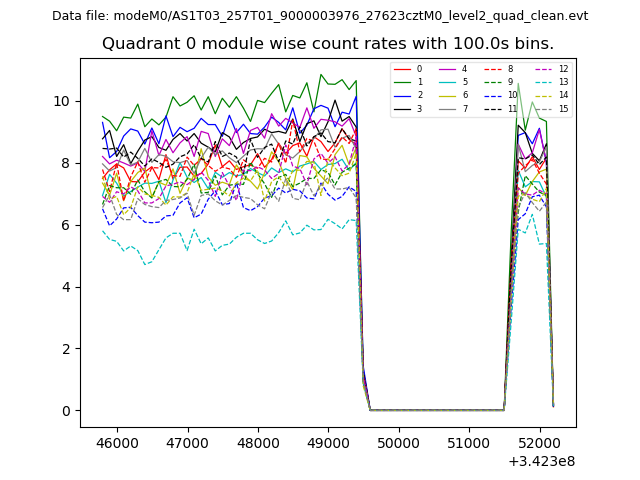 |
 |
| Module-wise count rates for Quadrant B Data is divided into 100 sec bins |
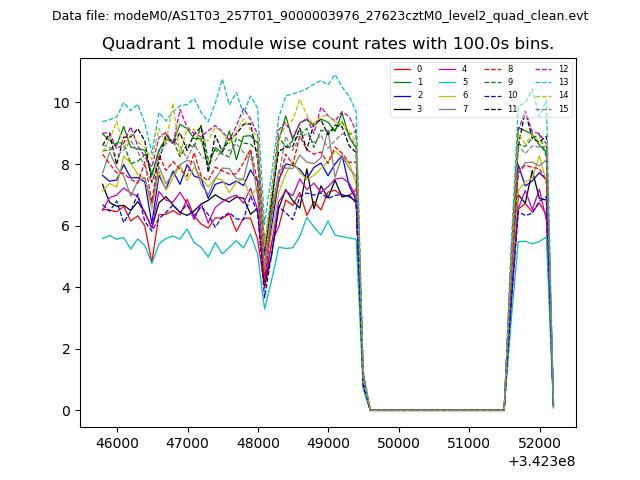 |
 |
| Module-wise count rates for Quadrant C Data is divided into 100 sec bins |
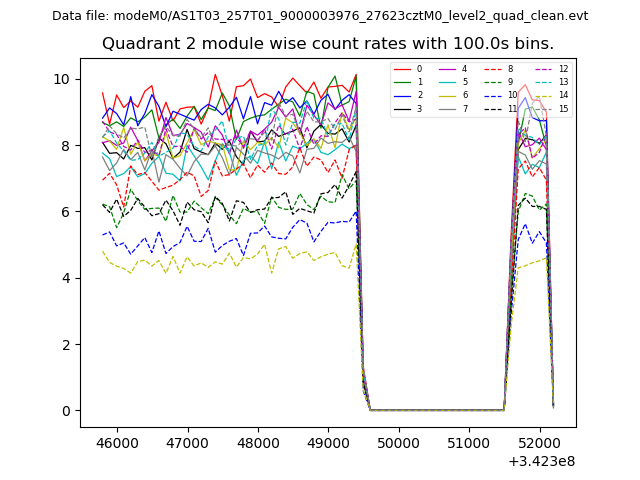 |
 |
| Module-wise count rates for Quadrant D Data is divided into 100 sec bins |
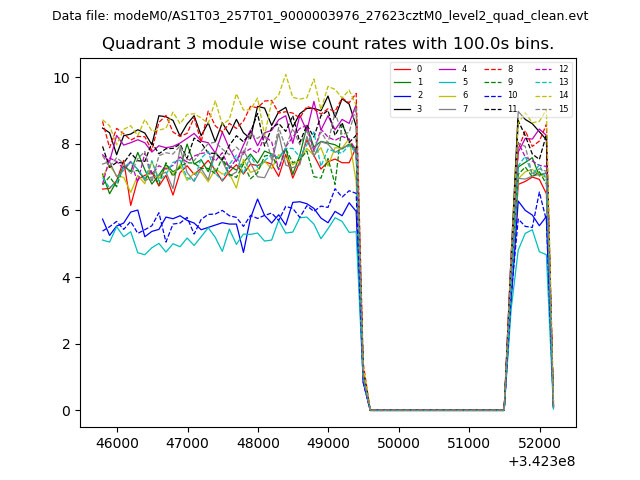 |
 |
| Parameter | Plot |
|---|---|
| CZT HV Monitor | 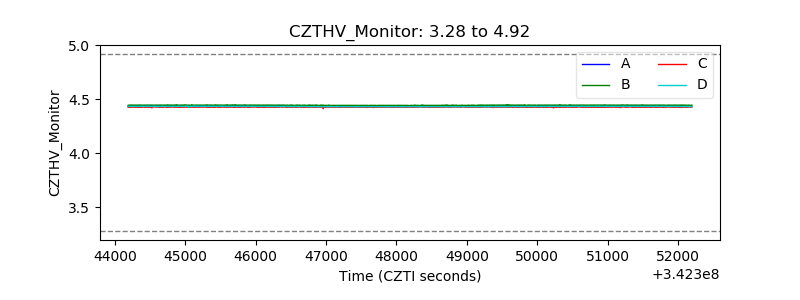 |
| D_VDD | 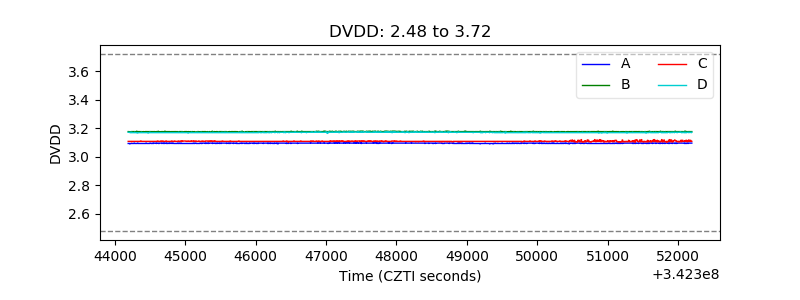 |
| Temperature 1 | 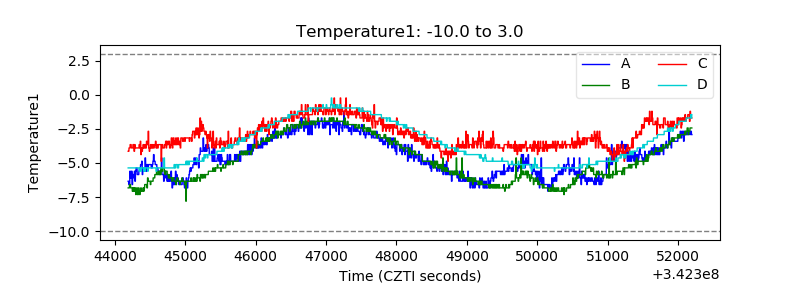 |
| Veto HV Monitor | 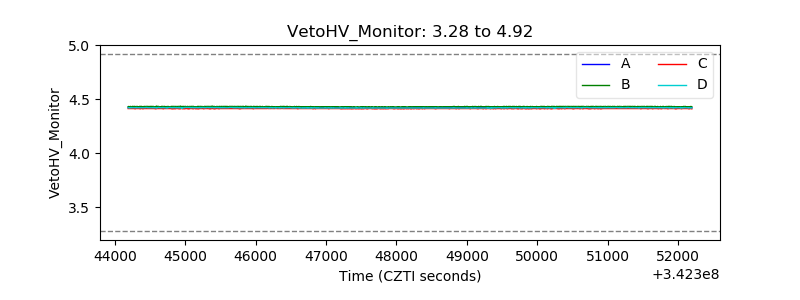 |
| Veto LLD |  |
| Alpha Counter | 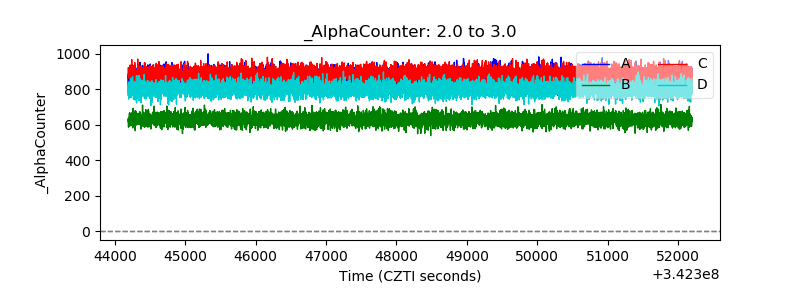 |
| _CPM_Rate | 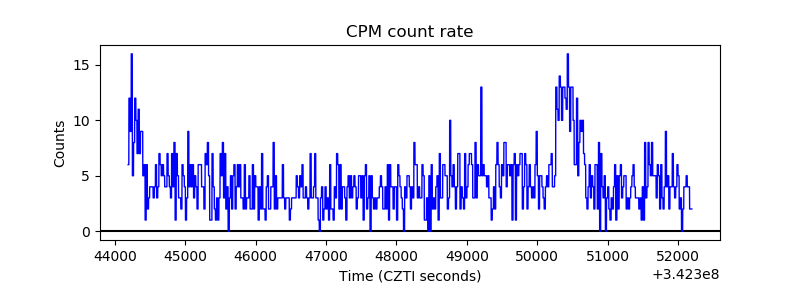 |
| CZT Counter | 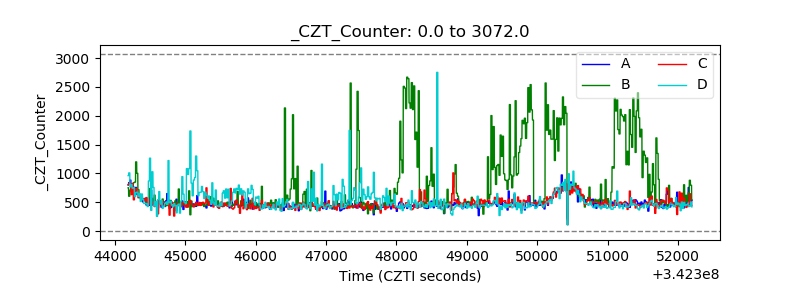 |
| +2.5 Volts monitor |  |
| +5 Volts monitor | 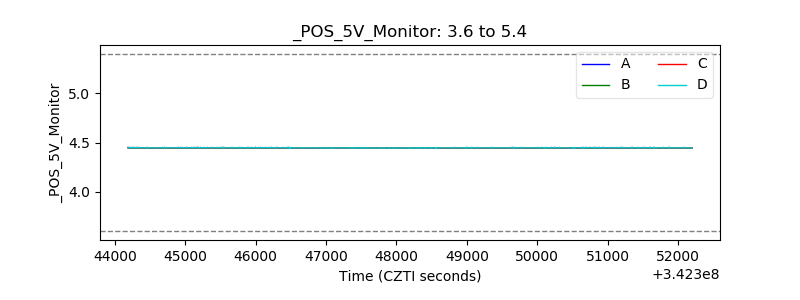 |
| _ROLL_ROT | 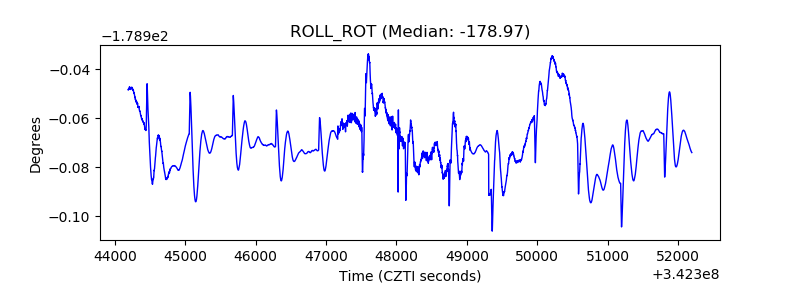 |
| _Roll_DEC | 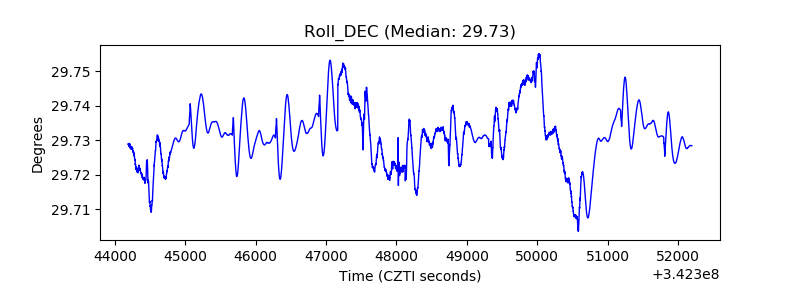 |
| _Roll_RA |  |
| Veto Counter | 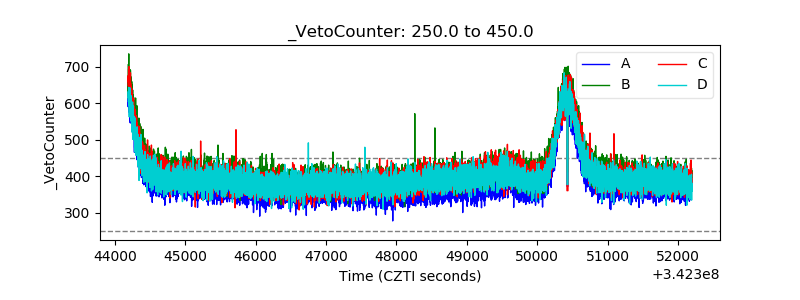 |