| Param | Original file | Final file |
|---|---|---|
| Filename | modeM0/AS1T03_257T01_9000003976_27627cztM0_level2.evt | modeM0/AS1T03_257T01_9000003976_27627cztM0_level2_quad_clean.evt |
| Size (bytes) | 2,121,289,920 | 381,139,200 |
| Size | 2.0 GB | 363.5 MB |
| Events in quadrant A | 13,163,460 | 2,470,358 |
| Events in quadrant B | 16,941,269 | 2,483,257 |
| Events in quadrant C | 13,305,081 | 2,390,193 |
| Events in quadrant D | 18,942,096 | 2,273,825 |
| Mode M9 | |||
|---|---|---|---|
| Quadrant | BADHDUFLAG | Total packets | Discarded packets |
| A | 0 | 16 | 0 |
| B | 0 | 16 | 0 |
| C | 0 | 16 | 0 |
| D | 0 | 16 | 0 |
| Mode M0 | |||
|---|---|---|---|
| Quadrant | BADHDUFLAG | Total packets | Discarded packets |
| A | 0 | 57773 | 0 |
| B | 0 | 68436 | 0 |
| C | 0 | 57693 | 0 |
| D | 0 | 75319 | 0 |
| Quadrant | Total seconds | Saturated seconds | Saturation percentage |
|---|---|---|---|
| A | 28013 | 506 | 1.806304% |
| B | 28014 | 1696 | 6.054116% |
| C | 28014 | 531 | 1.895481% |
| D | 28014 | 1558 | 5.561505% |
Noise dominated data is calculated using 1-second bins in cleaned event files. If a bin has >2000 counts, and if more than 50% of those come from <1% of pixels, then it is considered to be noise-dominated and hence unusable.
| Quadrant | # 1 sec bins | Bins with >0 counts | Bins with >2000 counts | High rate bins dominated by noise | Noise dominated (total time) | Noise dominated (detector-on time) | Marked lightcurve |
|---|---|---|---|---|---|---|---|
| A | 31752 | 28016 | 18 | 18 | 0.06% | 0.06% | 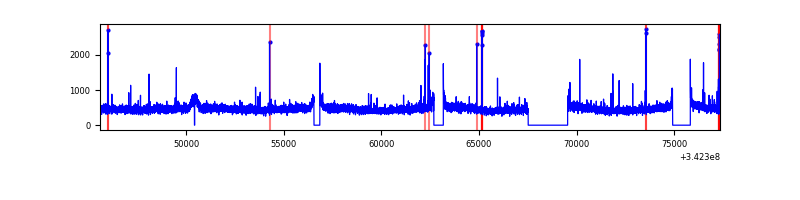 |
| B | 31752 | 28016 | 801 | 801 | 2.52% | 2.86% | 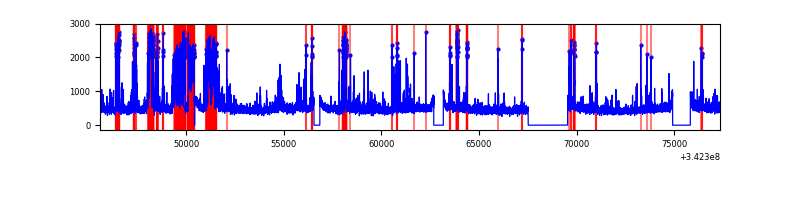 |
| C | 31751 | 28017 | 0 | 0 | 0.00% | 0.00% | 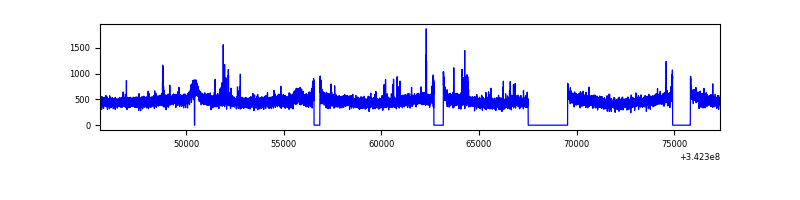 |
| D | 31752 | 28017 | 1162 | 1162 | 3.66% | 4.15% | 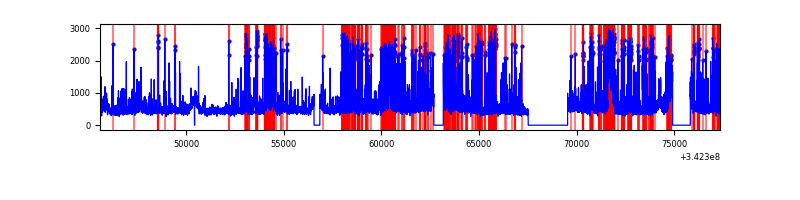 |
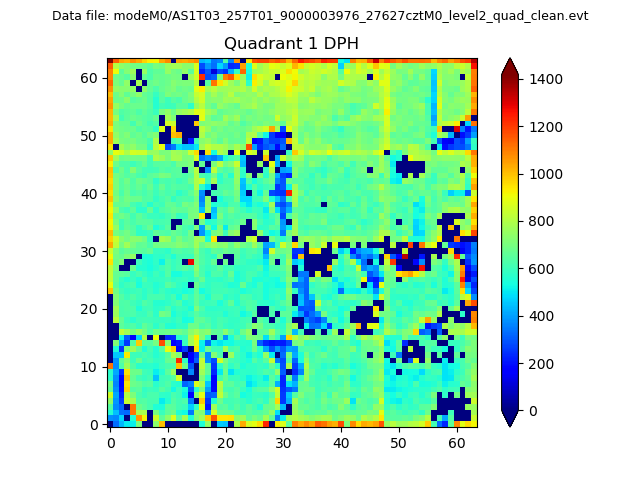
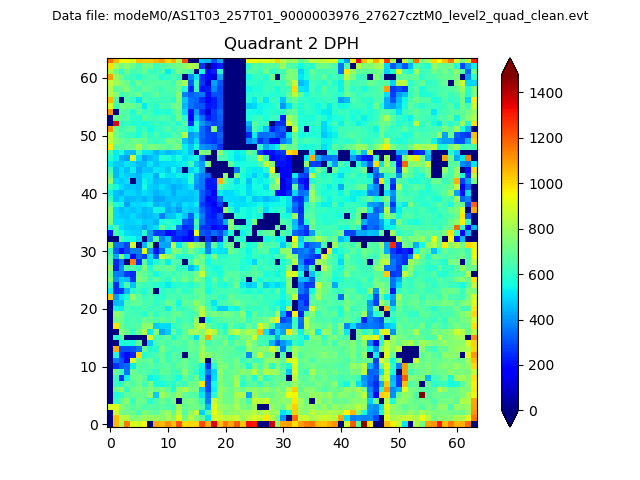
Top three noisy pixels from each quadrant. If the there are fewer than three noisy pixels in the level2.evt file, extra rows are filled as -1
| Pixel properties | Quadrant properties | ||||||
|---|---|---|---|---|---|---|---|
| Quadrant | DetID | PixID | Counts | Sigma | Mean | Median | Sigma |
| A | 12 | 96 | 82251 | 116.74 | 3369 | 3292 | 676.4 |
| A | 13 | 254 | 47067 | 64.72 | 3369 | 3292 | 676.4 |
| A | 3 | 137 | 32935 | 43.83 | 3369 | 3292 | 676.4 |
| B | 3 | 64 | 2211953 | 3543.62 | 3278 | 3188 | 623.3 |
| B | 10 | 245 | 1450594 | 2322.14 | 3278 | 3188 | 623.3 |
| B | 0 | 230 | 148592 | 233.28 | 3278 | 3188 | 623.3 |
| C | 14 | 238 | 518113 | 682.09 | 3233 | 3255 | 754.8 |
| C | 3 | 233 | 74263 | 94.07 | 3233 | 3255 | 754.8 |
| C | 2 | 16 | 41287 | 50.39 | 3233 | 3255 | 754.8 |
| D | 1 | 52 | 3007404 | 3904.54 | 3220 | 3126 | 769.4 |
| D | 7 | 80 | 2815033 | 3654.52 | 3220 | 3126 | 769.4 |
| D | 2 | 250 | 725434 | 938.75 | 3220 | 3126 | 769.4 |
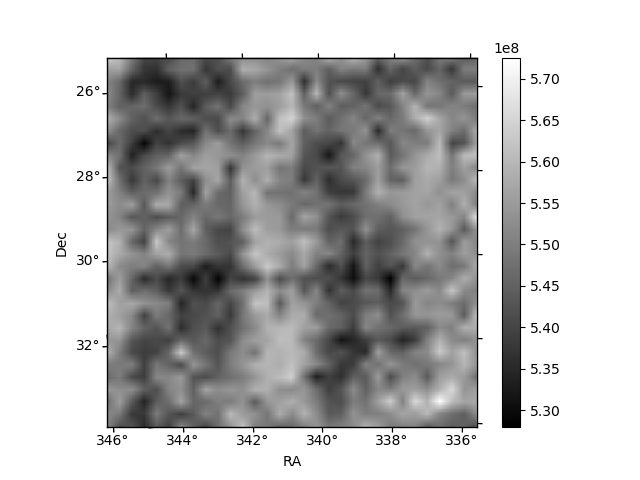
Histogram calculated using DETX and DETY for each event in the final _common_clean file
| Quadrant A | 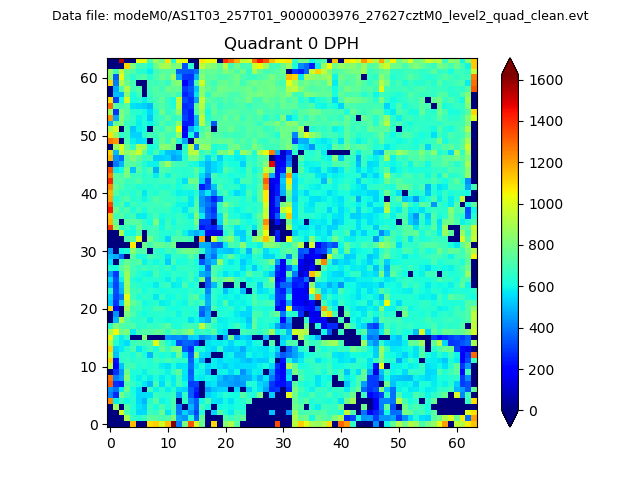 |
 |
Quadrant B |
|---|---|---|---|
| Quadrant D | 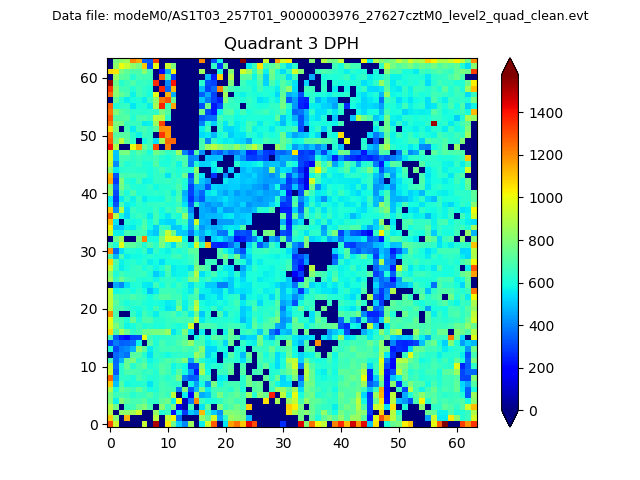 |
 |
Quadrant C |
| Plot type | Count rate plots | Images |
|---|---|---|
| Comparison with Poisson distribution Blue bars denote a histogram of data divided into 1 sec bins. Red curve is a Poisson curve with rate = median count rate of data. |
 |
 |
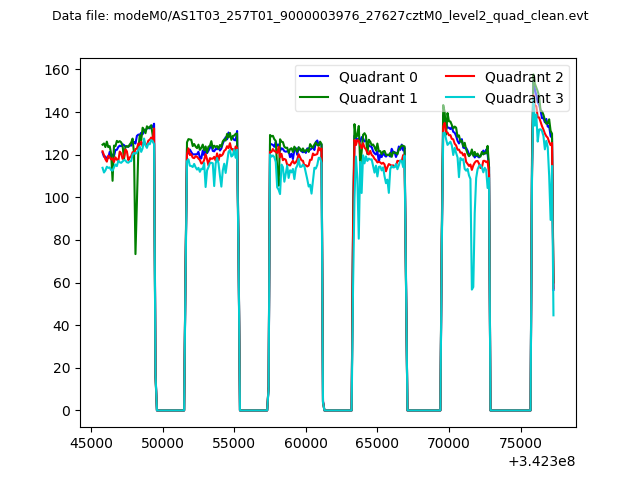
| Quadrant-wise count rates Data is divided into 100 sec bins |
 |
|
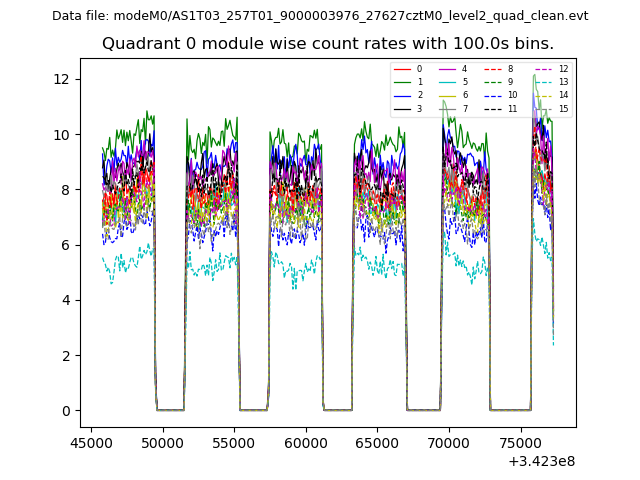
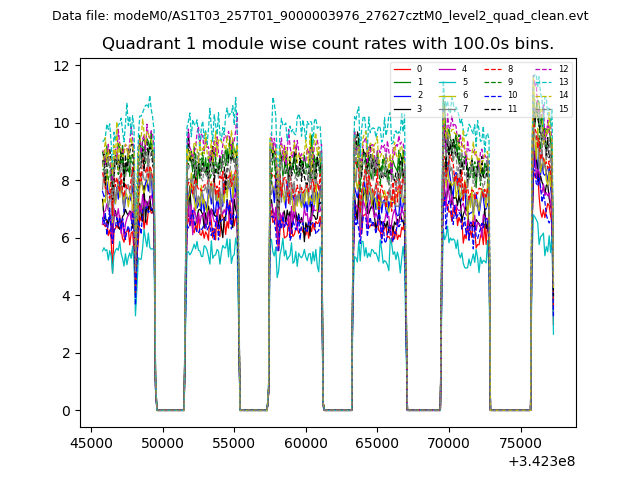
| Module-wise count rates for Quadrant A Data is divided into 100 sec bins |
 |
 |
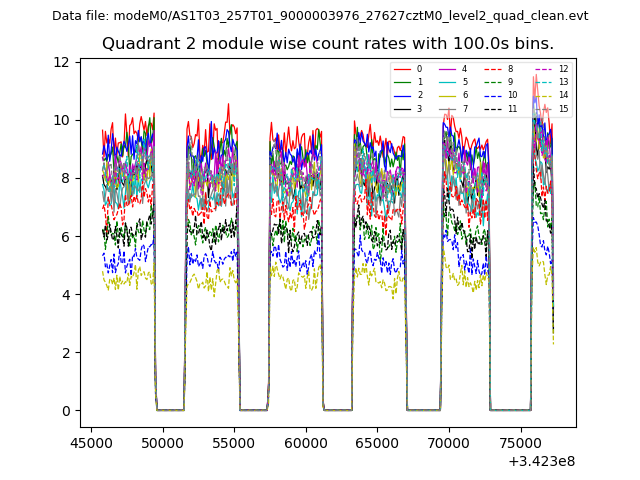
| Module-wise count rates for Quadrant B Data is divided into 100 sec bins |
 |
 |
| Module-wise count rates for Quadrant C Data is divided into 100 sec bins |
 |
 |
| Module-wise count rates for Quadrant D Data is divided into 100 sec bins |
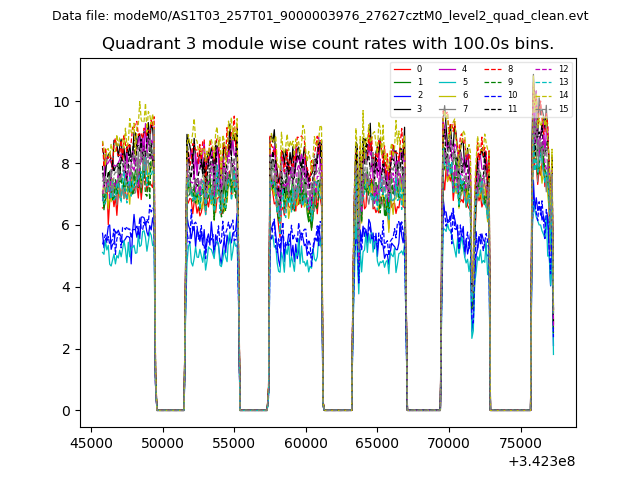 |
 |
| Parameter | Plot |
|---|---|
| CZT HV Monitor | 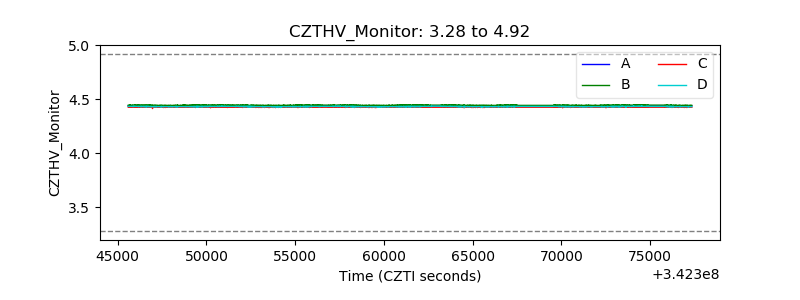 |
| D_VDD | 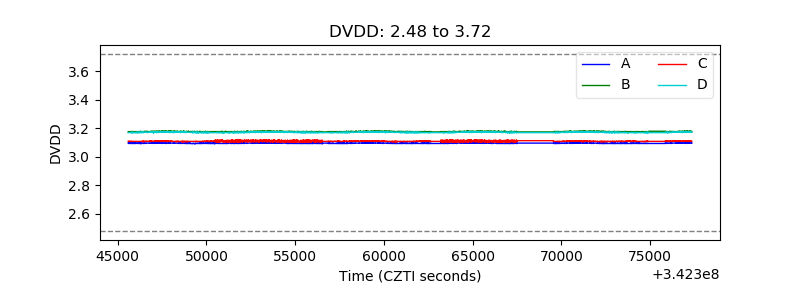 |
| Temperature 1 | 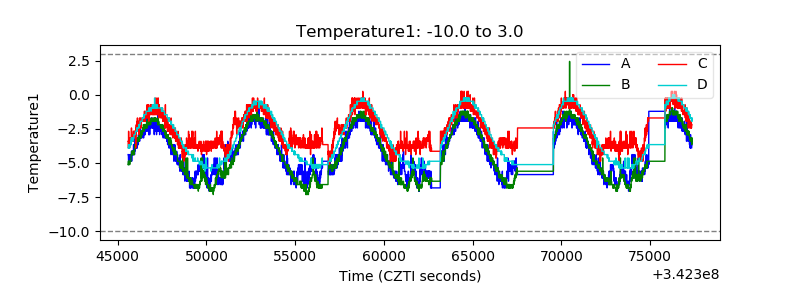 |
| Veto HV Monitor | 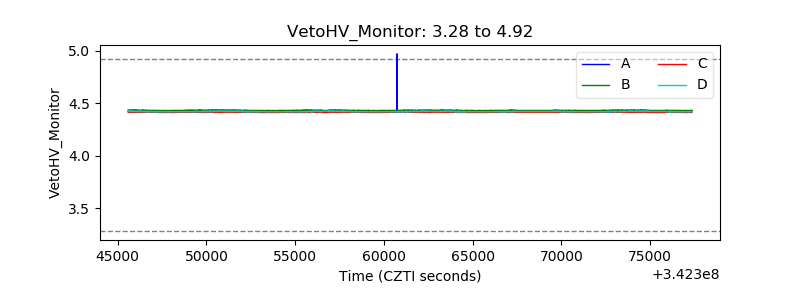 |
| Veto LLD | 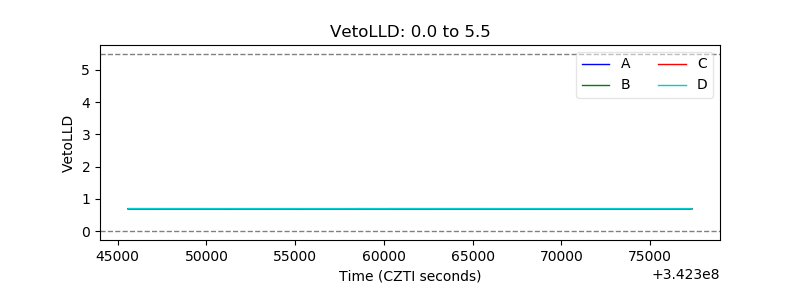 |
| Alpha Counter |  |
| _CPM_Rate | 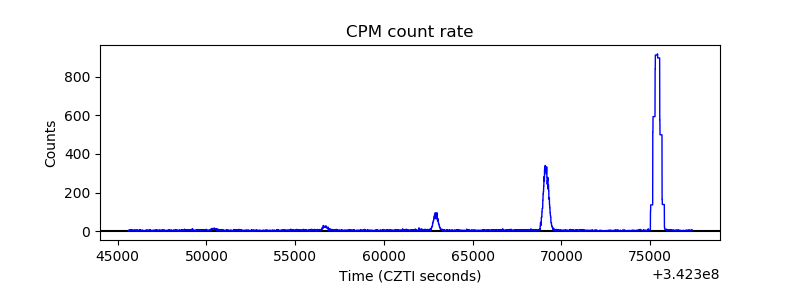 |
| CZT Counter | 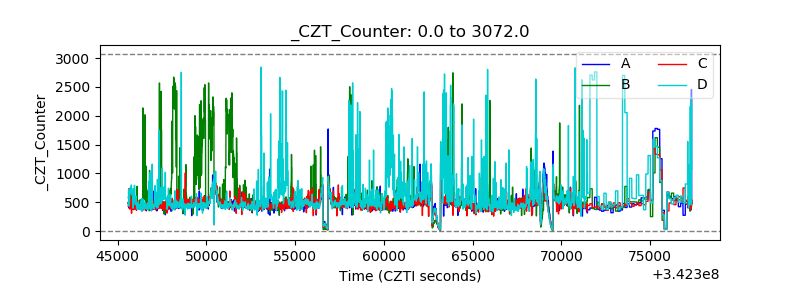 |
| +2.5 Volts monitor |  |
| +5 Volts monitor |  |
| _ROLL_ROT | 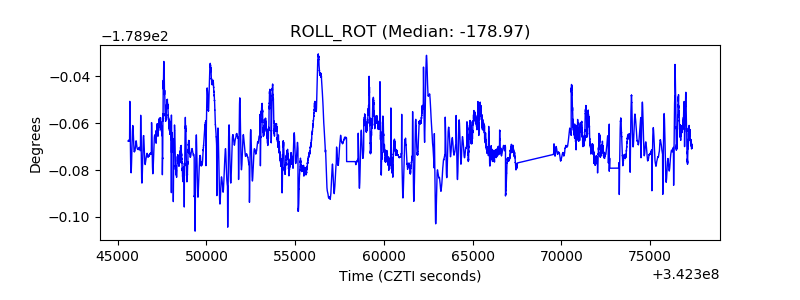 |
| _Roll_DEC | 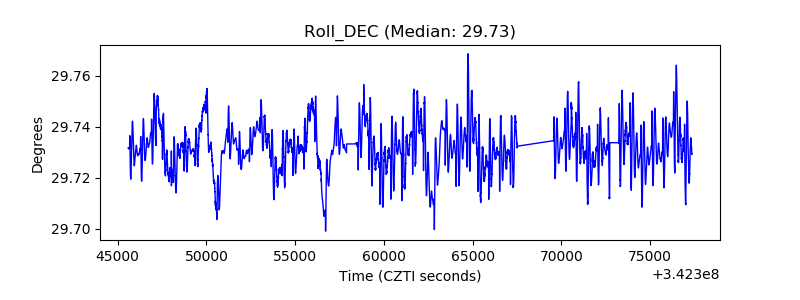 |
| _Roll_RA |  |
| Veto Counter | 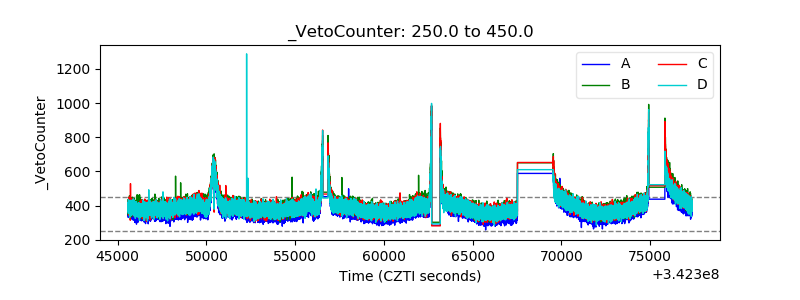 |