| Param | Original file | Final file |
|---|---|---|
| Filename | modeM0/AS1T03_257T01_9000003976_27628cztM0_level2.evt | modeM0/AS1T03_257T01_9000003976_27628cztM0_level2_quad_clean.evt |
| Size (bytes) | 489,974,400 | 94,210,560 |
| Size | 467.3 MB | 89.8 MB |
| Events in quadrant A | 3,204,243 | 618,187 |
| Events in quadrant B | 3,792,920 | 623,174 |
| Events in quadrant C | 3,191,788 | 594,374 |
| Events in quadrant D | 4,201,578 | 556,928 |
| Mode M9 | |||
|---|---|---|---|
| Quadrant | BADHDUFLAG | Total packets | Discarded packets |
| A | 0 | 15 | 0 |
| B | 0 | 16 | 0 |
| C | 0 | 16 | 0 |
| D | 0 | 16 | 0 |
| Mode M0 | |||
|---|---|---|---|
| Quadrant | BADHDUFLAG | Total packets | Discarded packets |
| A | 0 | 13878 | 0 |
| B | 0 | 15657 | 0 |
| C | 0 | 13686 | 0 |
| D | 0 | 16953 | 0 |
| Quadrant | Total seconds | Saturated seconds | Saturation percentage |
|---|---|---|---|
| A | 6601 | 52 | 0.787759% |
| B | 6601 | 124 | 1.878503% |
| C | 6601 | 49 | 0.742312% |
| D | 6600 | 407 | 6.166667% |
Noise dominated data is calculated using 1-second bins in cleaned event files. If a bin has >2000 counts, and if more than 50% of those come from <1% of pixels, then it is considered to be noise-dominated and hence unusable.
| Quadrant | # 1 sec bins | Bins with >0 counts | Bins with >2000 counts | High rate bins dominated by noise | Noise dominated (total time) | Noise dominated (detector-on time) | Marked lightcurve |
|---|---|---|---|---|---|---|---|
| A | 7695 | 6600 | 6 | 6 | 0.08% | 0.09% | 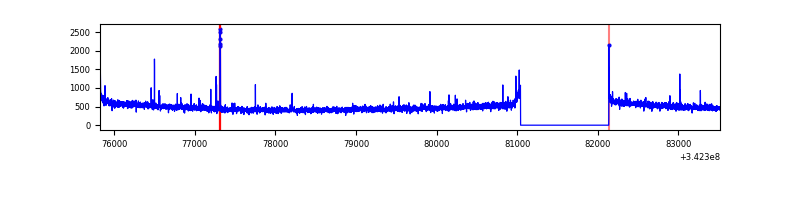 |
| B | 7695 | 6601 | 67 | 67 | 0.87% | 1.01% | 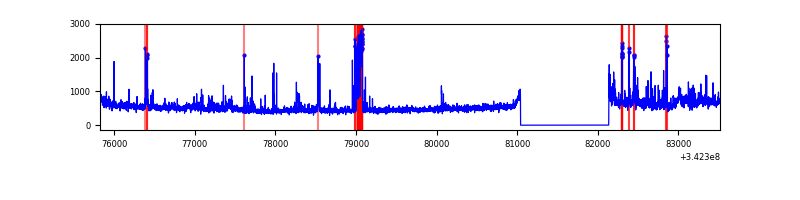 |
| C | 7696 | 6602 | 0 | 0 | 0.00% | 0.00% | 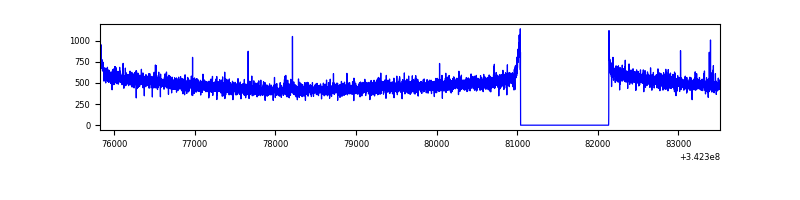 |
| D | 7695 | 6601 | 166 | 166 | 2.16% | 2.51% | 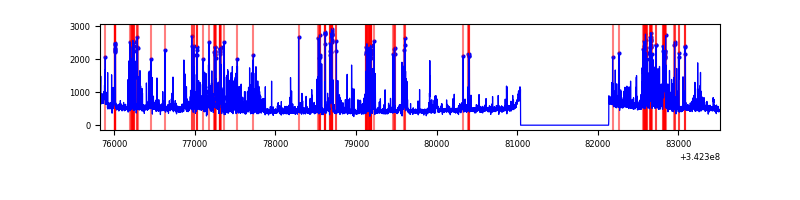 |
Top three noisy pixels from each quadrant. If the there are fewer than three noisy pixels in the level2.evt file, extra rows are filled as -1
| Pixel properties | Quadrant properties | ||||||
|---|---|---|---|---|---|---|---|
| Quadrant | DetID | PixID | Counts | Sigma | Mean | Median | Sigma |
| A | 12 | 96 | 30888 | 182.53 | 816 | 799 | 164.8 |
| A | 13 | 254 | 11693 | 66.09 | 816 | 799 | 164.8 |
| A | 8 | 192 | 11136 | 62.71 | 816 | 799 | 164.8 |
| B | 10 | 245 | 361752 | 2365.96 | 806 | 786 | 152.6 |
| B | 0 | 230 | 93369 | 606.84 | 806 | 786 | 152.6 |
| B | 0 | 190 | 76692 | 497.53 | 806 | 786 | 152.6 |
| C | 14 | 238 | 125328 | 680.18 | 782 | 787 | 183.1 |
| C | 3 | 233 | 7272 | 35.42 | 782 | 787 | 183.1 |
| C | 13 | 61 | 5452 | 25.48 | 782 | 787 | 183.1 |
| D | 1 | 52 | 649845 | 3519.13 | 770 | 748 | 184.4 |
| D | 2 | 250 | 341893 | 1849.54 | 770 | 748 | 184.4 |
| D | 7 | 80 | 201442 | 1088.08 | 770 | 748 | 184.4 |
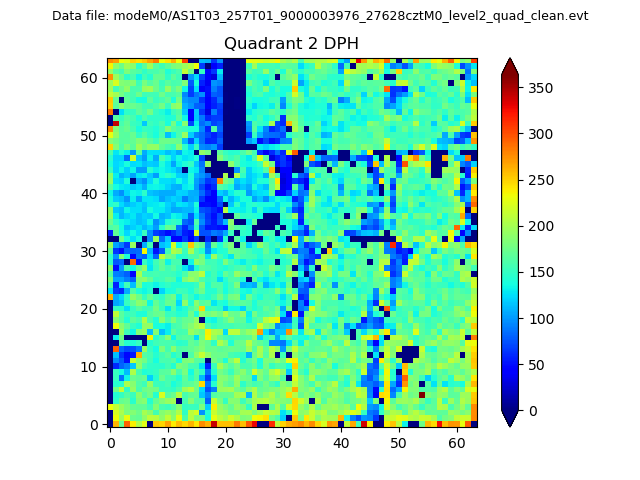
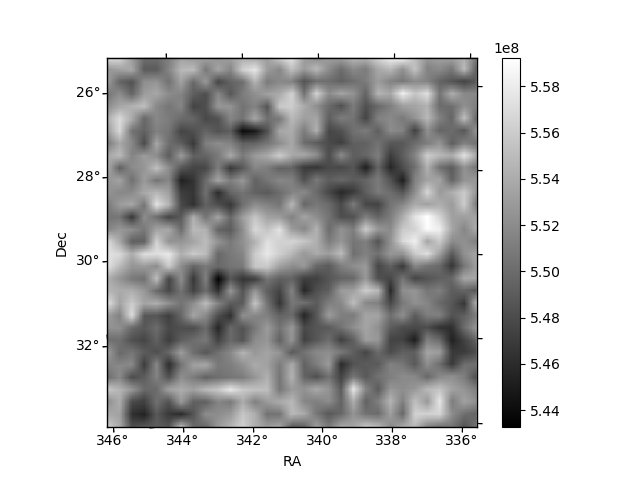
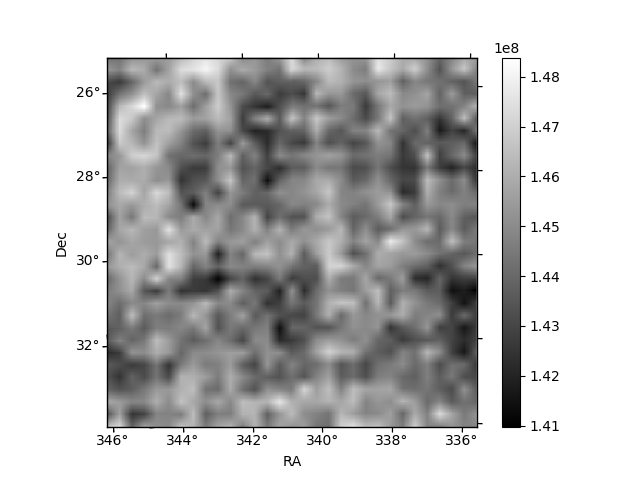
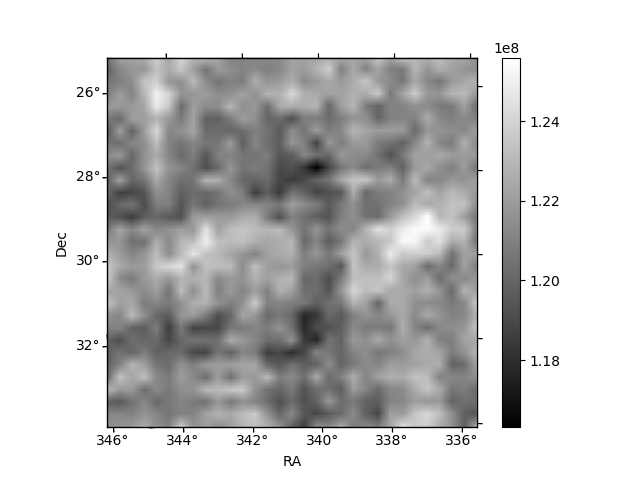
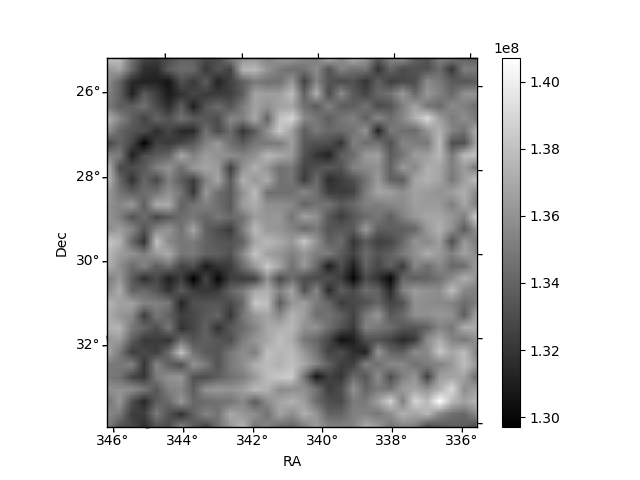
Histogram calculated using DETX and DETY for each event in the final _common_clean file
| Quadrant A | 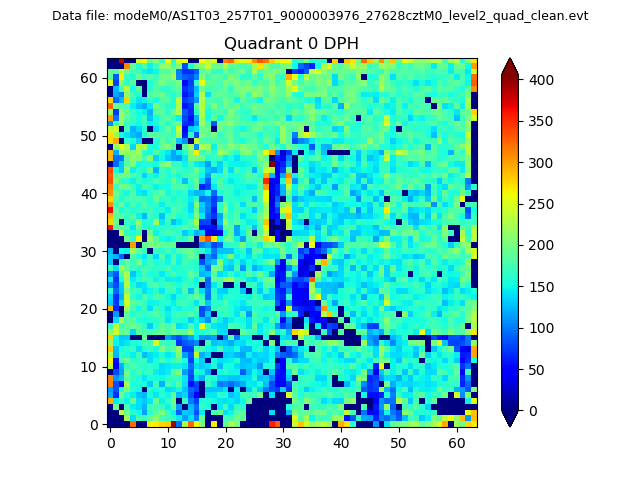 |
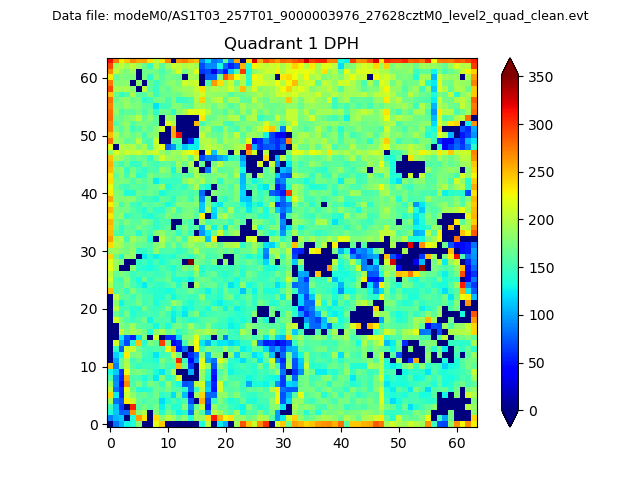 |
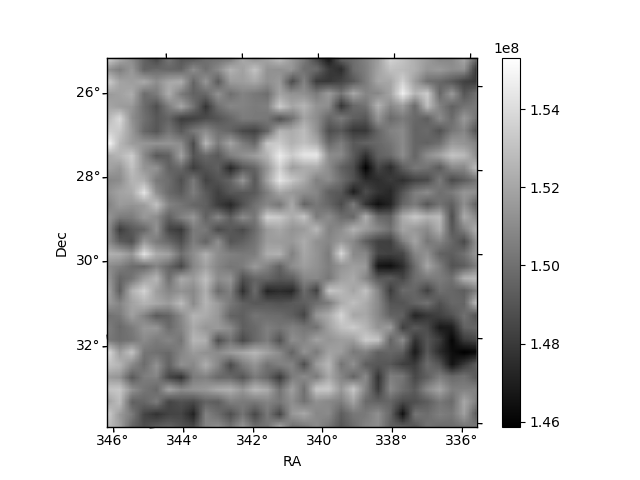
Quadrant B |
|---|---|---|---|
| Quadrant D | 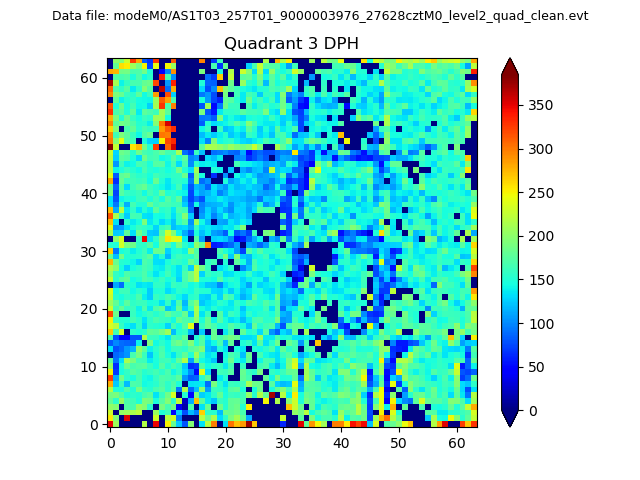 |
 |
Quadrant C |
| Plot type | Count rate plots | Images |
|---|---|---|
| Comparison with Poisson distribution Blue bars denote a histogram of data divided into 1 sec bins. Red curve is a Poisson curve with rate = median count rate of data. |
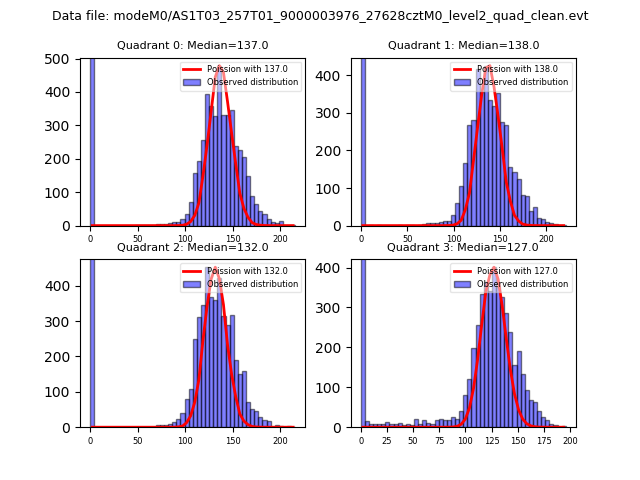 |
 |
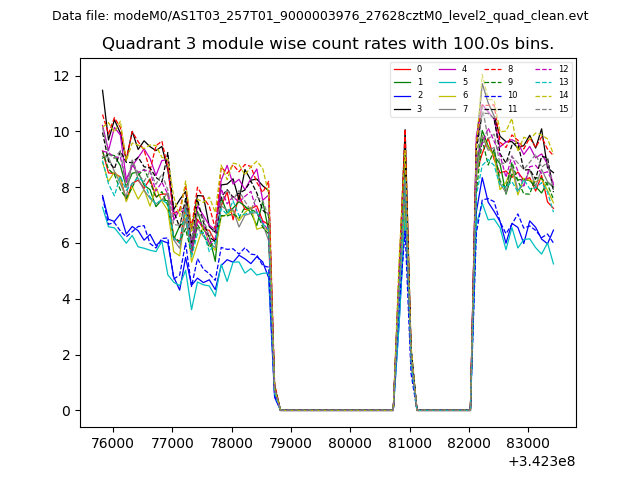
| Quadrant-wise count rates Data is divided into 100 sec bins |
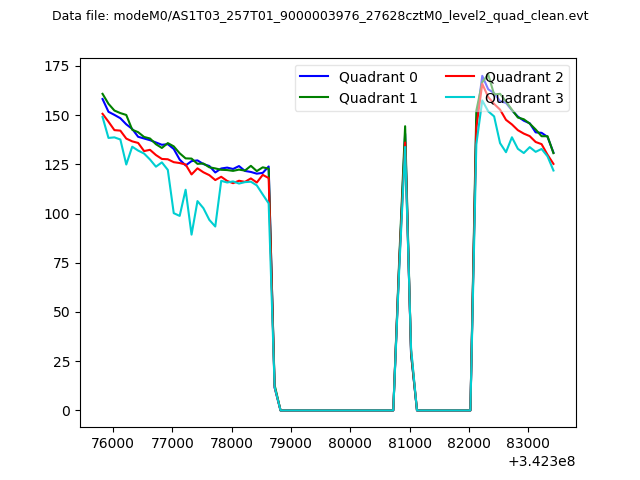 |
|
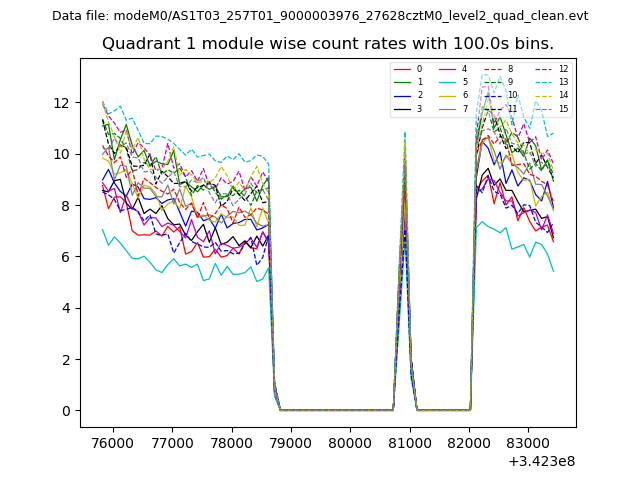
| Module-wise count rates for Quadrant A Data is divided into 100 sec bins |
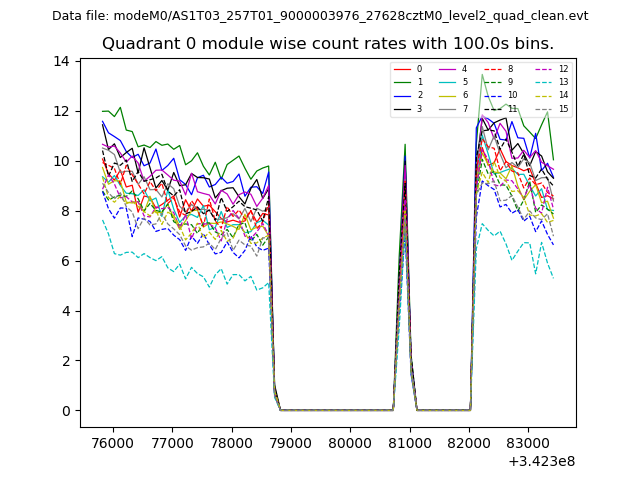 |
 |
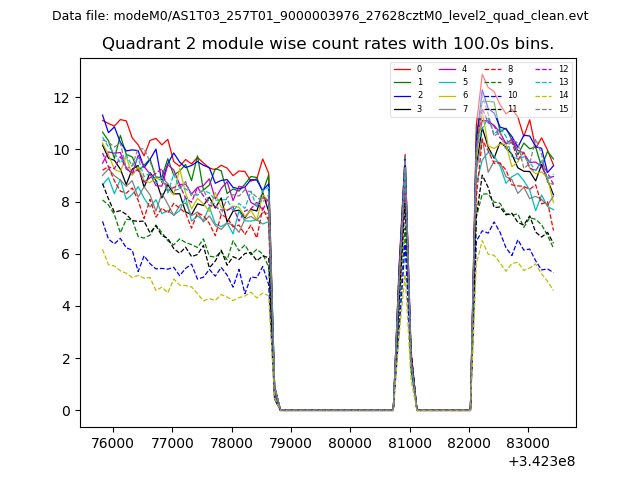
| Module-wise count rates for Quadrant B Data is divided into 100 sec bins |
 |
 |
| Module-wise count rates for Quadrant C Data is divided into 100 sec bins |
 |
 |
| Module-wise count rates for Quadrant D Data is divided into 100 sec bins |
 |
 |
| Parameter | Plot |
|---|---|
| CZT HV Monitor | 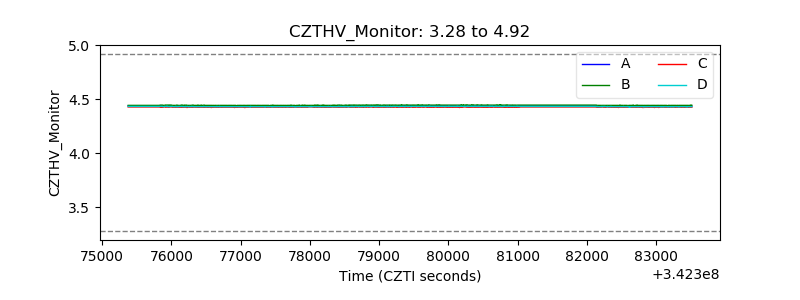 |
| D_VDD | 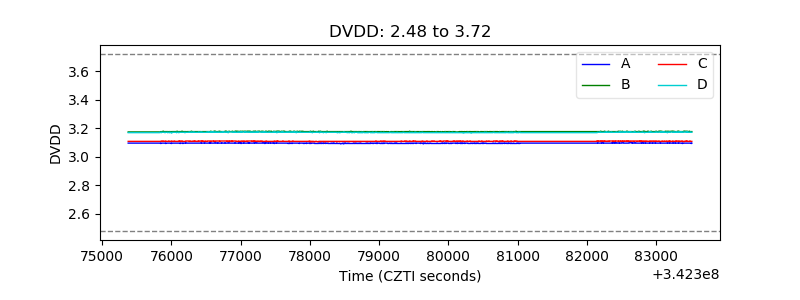 |
| Temperature 1 | 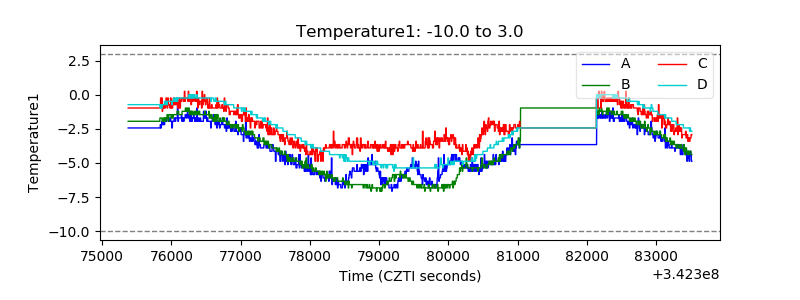 |
| Veto HV Monitor | 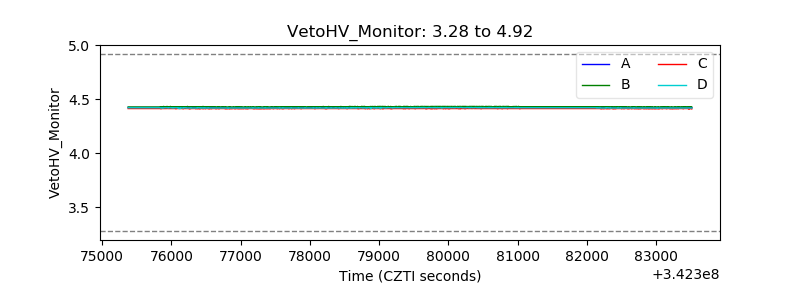 |
| Veto LLD | 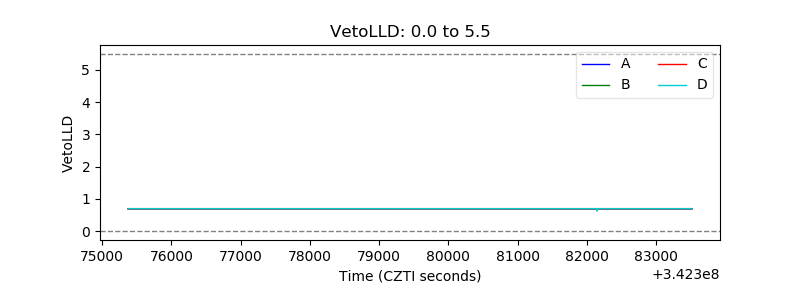 |
| Alpha Counter | 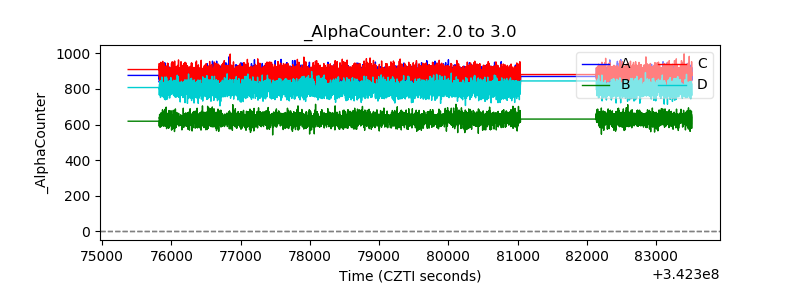 |
| _CPM_Rate | 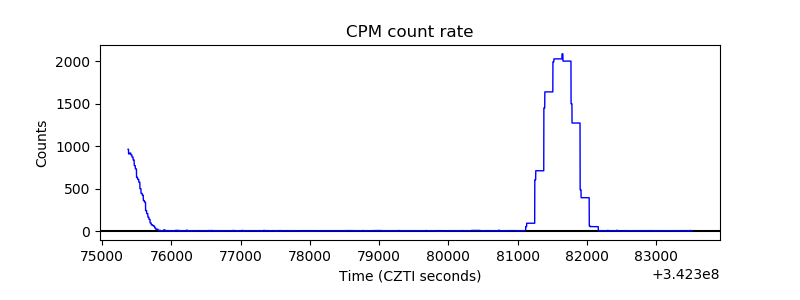 |
| CZT Counter | 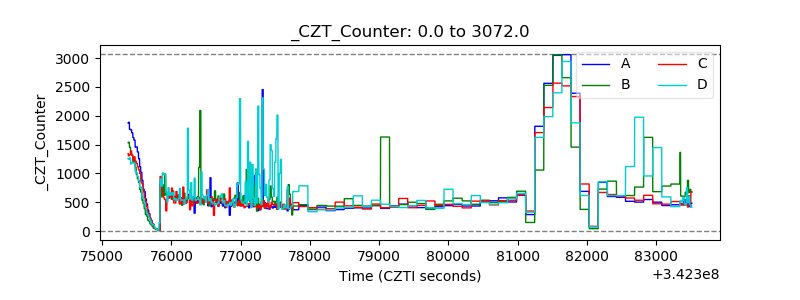 |
| +2.5 Volts monitor |  |
| +5 Volts monitor |  |
| _ROLL_ROT | 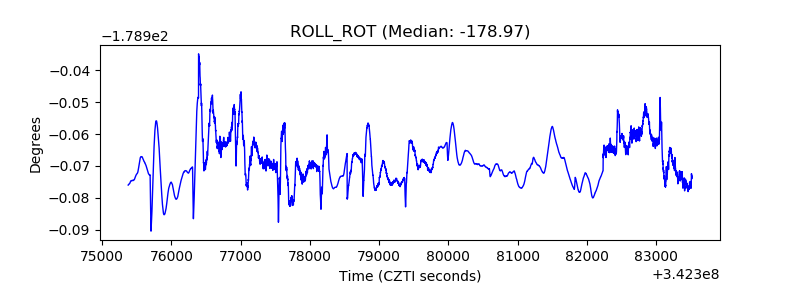 |
| _Roll_DEC | 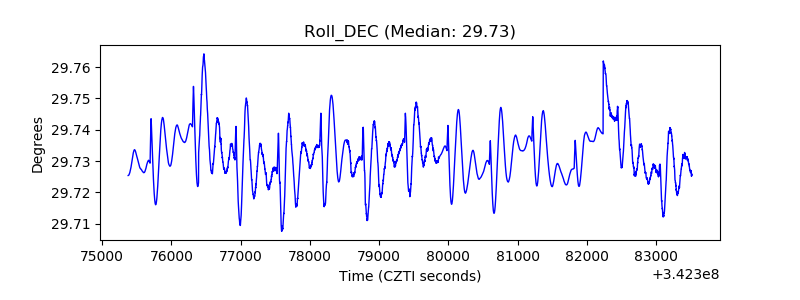 |
| _Roll_RA | 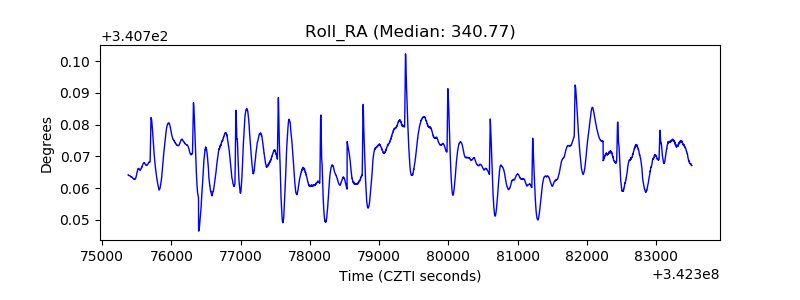 |
| Veto Counter | 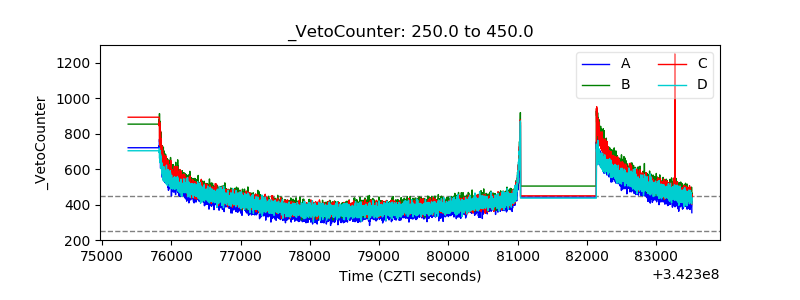 |