| Param | Original file | Final file |
|---|---|---|
| Filename | modeM0/AS1T03_257T01_9000003976_27631cztM0_level2.evt | modeM0/AS1T03_257T01_9000003976_27631cztM0_level2_quad_clean.evt |
| Size (bytes) | 493,502,400 | 98,478,720 |
| Size | 470.6 MB | 93.9 MB |
| Events in quadrant A | 3,172,548 | 650,975 |
| Events in quadrant B | 3,716,596 | 671,120 |
| Events in quadrant C | 3,272,820 | 629,303 |
| Events in quadrant D | 4,361,643 | 596,851 |
| Mode M9 | |||
|---|---|---|---|
| Quadrant | BADHDUFLAG | Total packets | Discarded packets |
| A | 0 | 23 | 0 |
| B | 0 | 24 | 0 |
| C | 0 | 24 | 0 |
| D | 0 | 24 | 0 |
| Mode M0 | |||
|---|---|---|---|
| Quadrant | BADHDUFLAG | Total packets | Discarded packets |
| A | 0 | 13316 | 0 |
| B | 0 | 15094 | 0 |
| C | 0 | 13584 | 0 |
| D | 0 | 17225 | 0 |
| Quadrant | Total seconds | Saturated seconds | Saturation percentage |
|---|---|---|---|
| A | 6223 | 37 | 0.594569% |
| B | 6223 | 153 | 2.458621% |
| C | 6223 | 85 | 1.365901% |
| D | 6223 | 157 | 2.522899% |
Noise dominated data is calculated using 1-second bins in cleaned event files. If a bin has >2000 counts, and if more than 50% of those come from <1% of pixels, then it is considered to be noise-dominated and hence unusable.
| Quadrant | # 1 sec bins | Bins with >0 counts | Bins with >2000 counts | High rate bins dominated by noise | Noise dominated (total time) | Noise dominated (detector-on time) | Marked lightcurve |
|---|---|---|---|---|---|---|---|
| A | 7542 | 6222 | 1 | 1 | 0.01% | 0.02% | 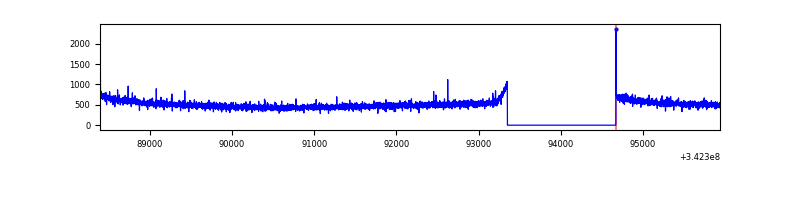 |
| B | 7542 | 6222 | 67 | 67 | 0.89% | 1.08% | 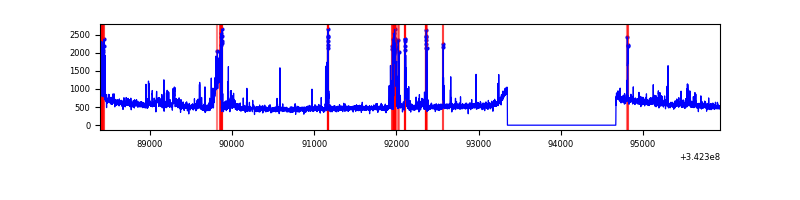 |
| C | 7542 | 6222 | 5 | 5 | 0.07% | 0.08% | 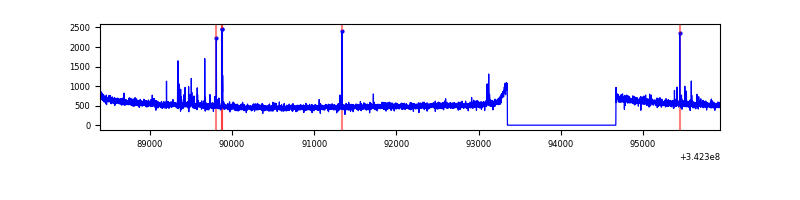 |
| D | 7543 | 6224 | 100 | 100 | 1.33% | 1.61% | 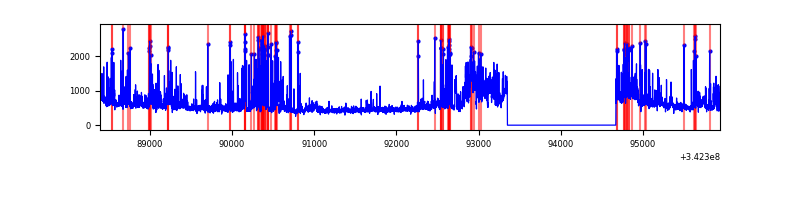 |
Top three noisy pixels from each quadrant. If the there are fewer than three noisy pixels in the level2.evt file, extra rows are filled as -1
| Pixel properties | Quadrant properties | ||||||
|---|---|---|---|---|---|---|---|
| Quadrant | DetID | PixID | Counts | Sigma | Mean | Median | Sigma |
| A | 13 | 254 | 11216 | 64.24 | 817 | 803 | 162.1 |
| A | 8 | 192 | 10939 | 62.53 | 817 | 803 | 162.1 |
| A | 3 | 137 | 7161 | 39.22 | 817 | 803 | 162.1 |
| B | 10 | 245 | 227548 | 1497.88 | 817 | 798 | 151.4 |
| B | 15 | 222 | 115553 | 758.05 | 817 | 798 | 151.4 |
| B | 0 | 190 | 76967 | 503.16 | 817 | 798 | 151.4 |
| C | 14 | 238 | 127955 | 691.46 | 790 | 798 | 183.9 |
| C | 2 | 16 | 50762 | 271.7 | 790 | 798 | 183.9 |
| C | 14 | 67 | 6421 | 30.58 | 790 | 798 | 183.9 |
| D | 1 | 52 | 1081193 | 5921.95 | 783 | 766 | 182.4 |
| D | 2 | 250 | 202784 | 1107.28 | 783 | 766 | 182.4 |
| D | 12 | 233 | 45767 | 246.65 | 783 | 766 | 182.4 |
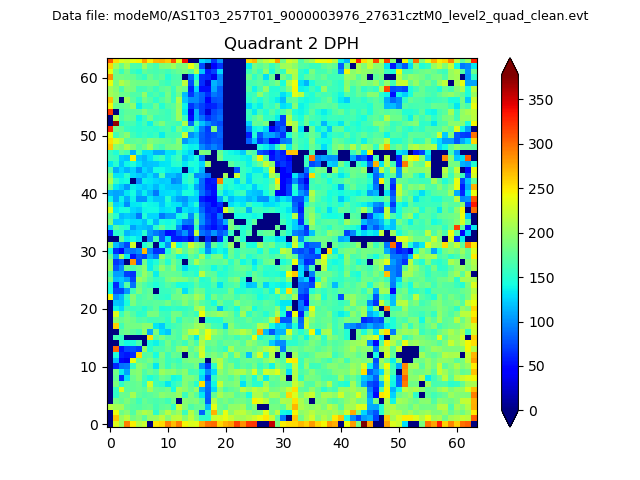
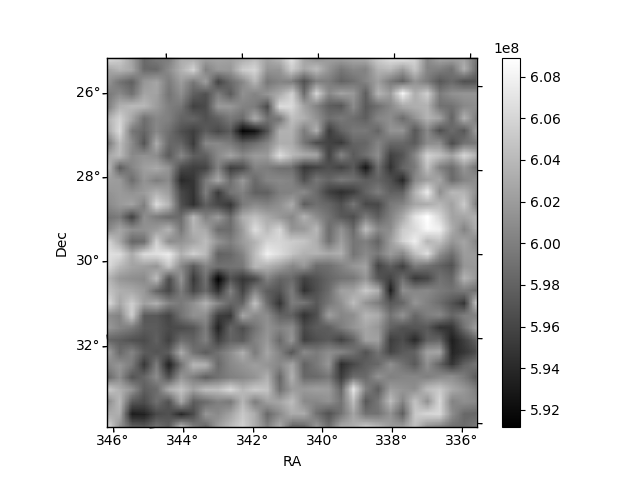
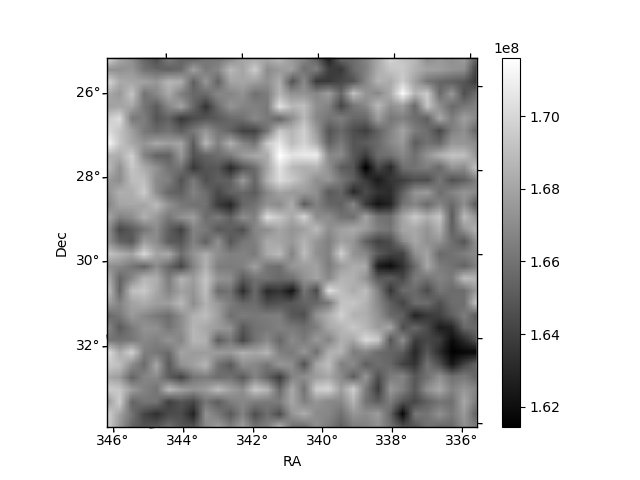
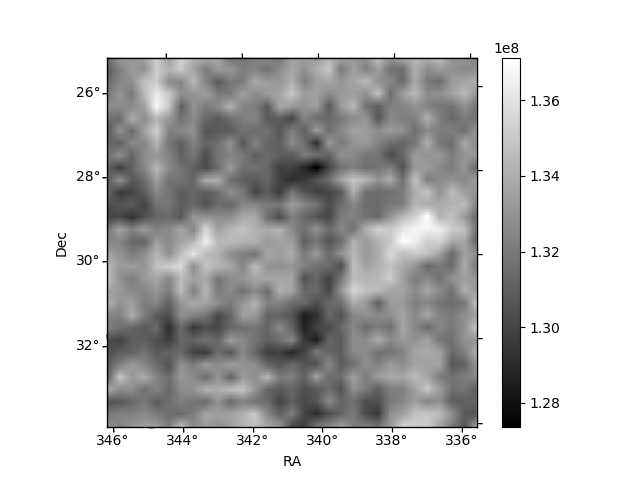
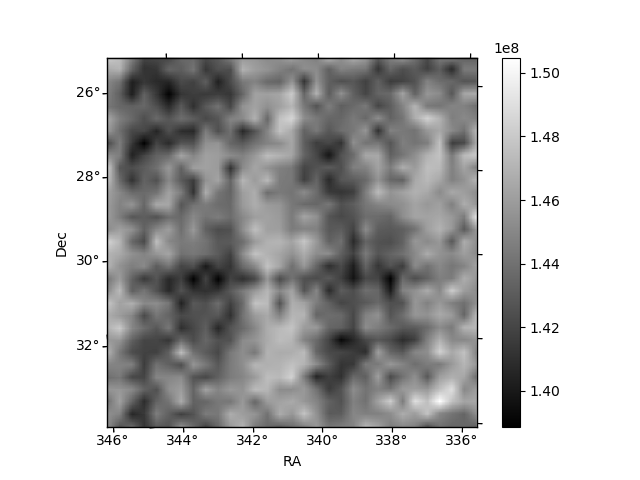
Histogram calculated using DETX and DETY for each event in the final _common_clean file
| Quadrant A | 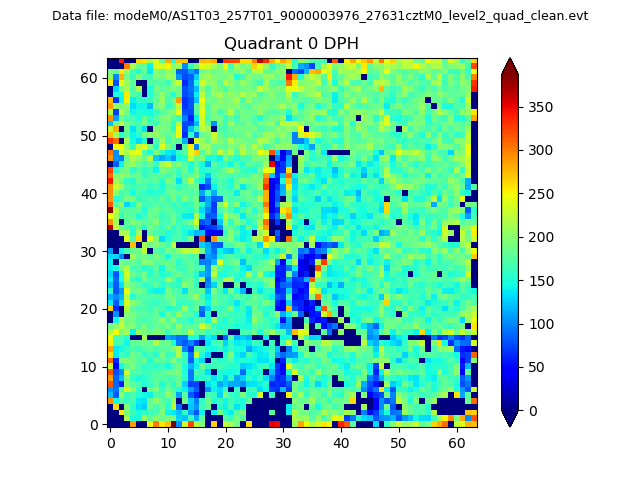 |
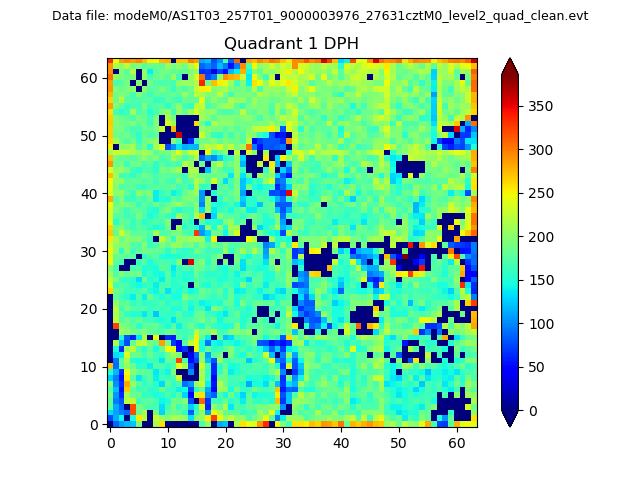 |
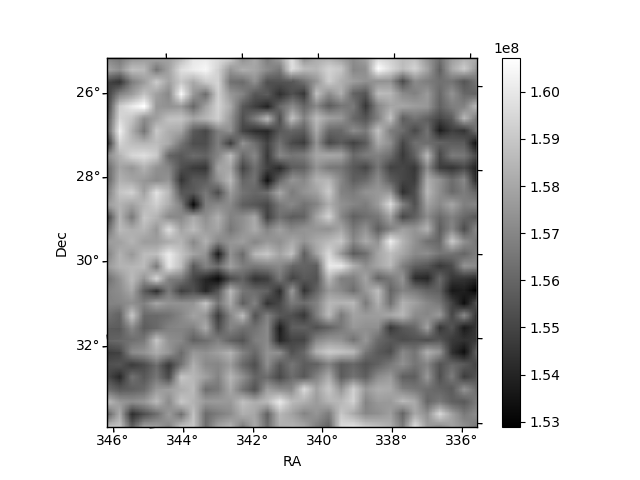
Quadrant B |
|---|---|---|---|
| Quadrant D | 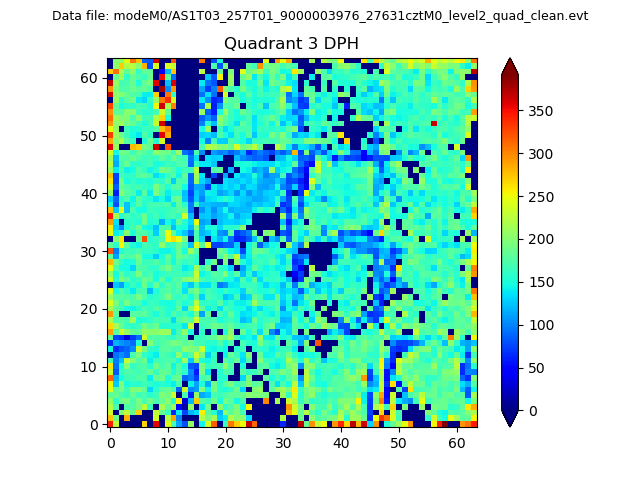 |
 |
Quadrant C |
| Plot type | Count rate plots | Images |
|---|---|---|
| Comparison with Poisson distribution Blue bars denote a histogram of data divided into 1 sec bins. Red curve is a Poisson curve with rate = median count rate of data. |
 |
 |
| Quadrant-wise count rates Data is divided into 100 sec bins |
 |
|
| Module-wise count rates for Quadrant A Data is divided into 100 sec bins |
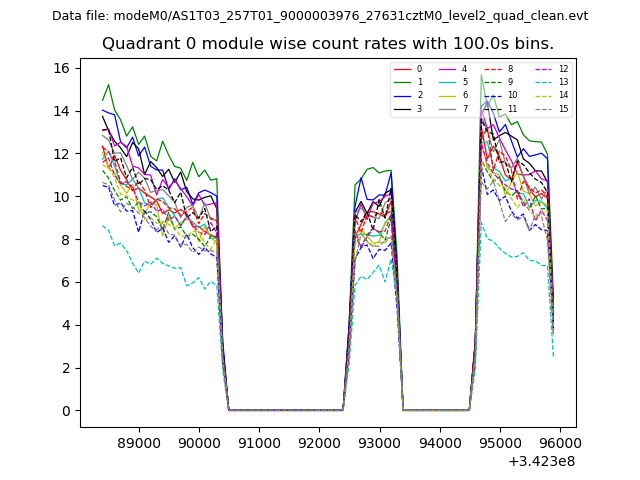 |
 |
| Module-wise count rates for Quadrant B Data is divided into 100 sec bins |
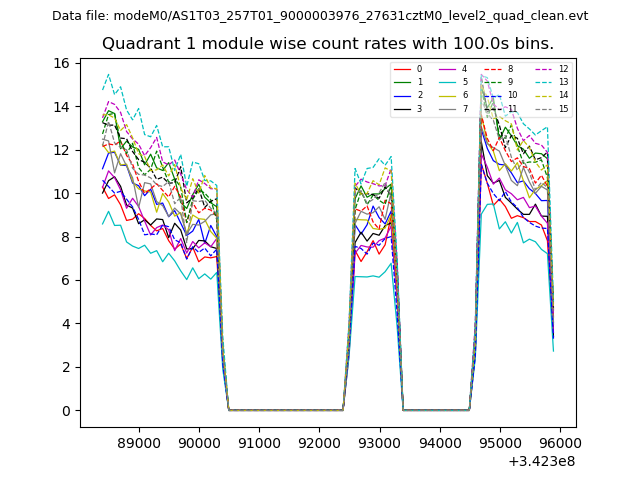 |
 |
| Module-wise count rates for Quadrant C Data is divided into 100 sec bins |
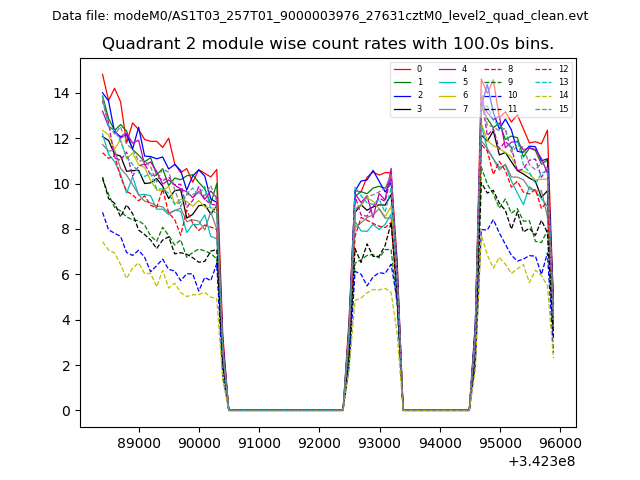 |
 |
| Module-wise count rates for Quadrant D Data is divided into 100 sec bins |
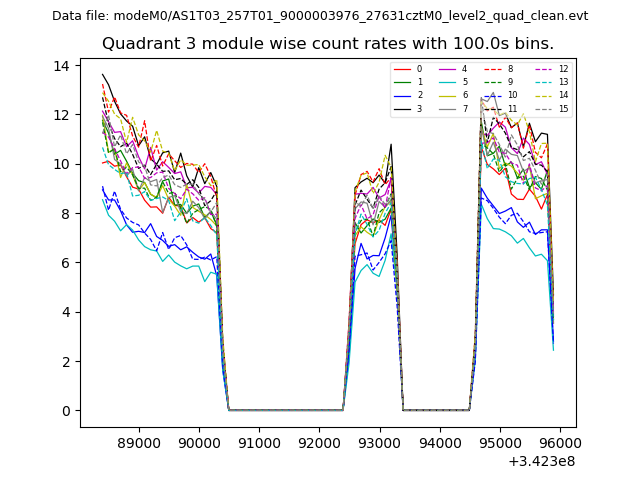 |
 |
| Parameter | Plot |
|---|---|
| CZT HV Monitor | 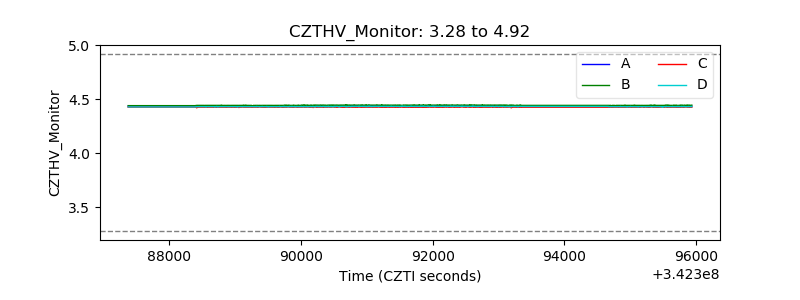 |
| D_VDD |  |
| Temperature 1 | 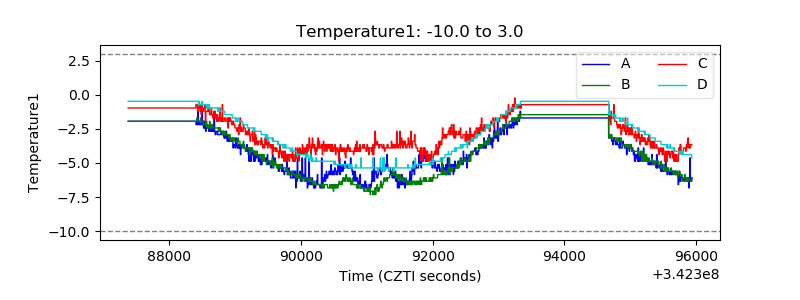 |
| Veto HV Monitor | 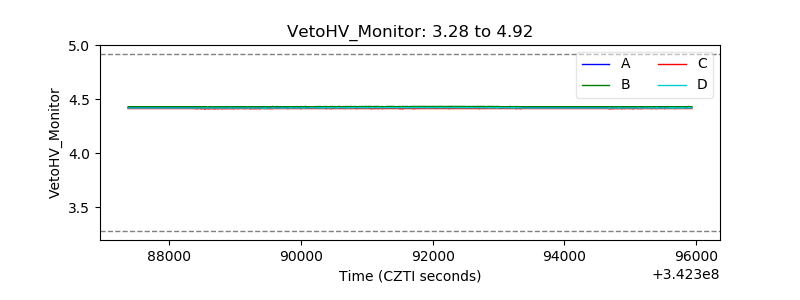 |
| Veto LLD | 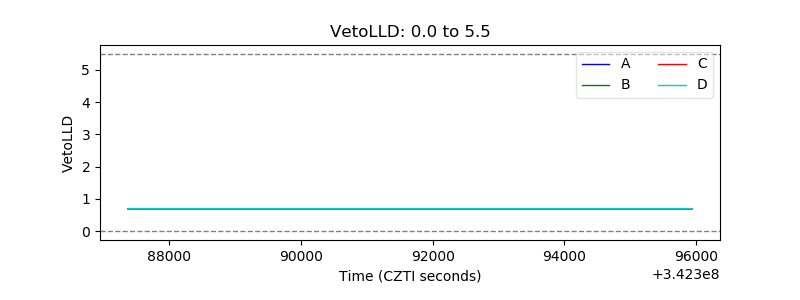 |
| Alpha Counter |  |
| _CPM_Rate | 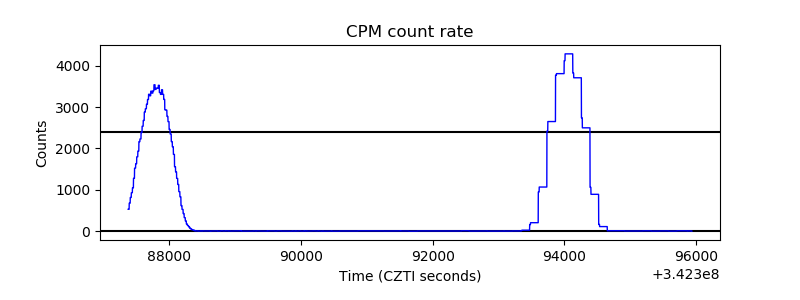 |
| CZT Counter | 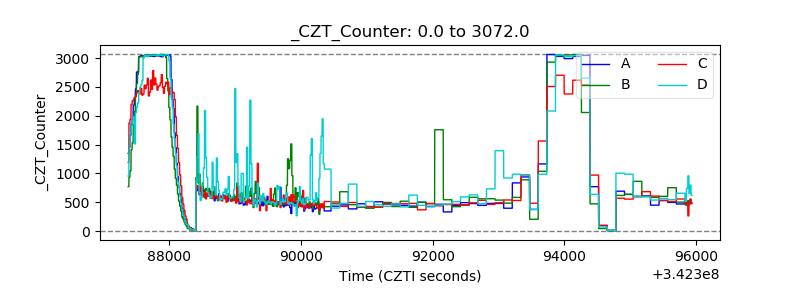 |
| +2.5 Volts monitor |  |
| +5 Volts monitor |  |
| _ROLL_ROT | 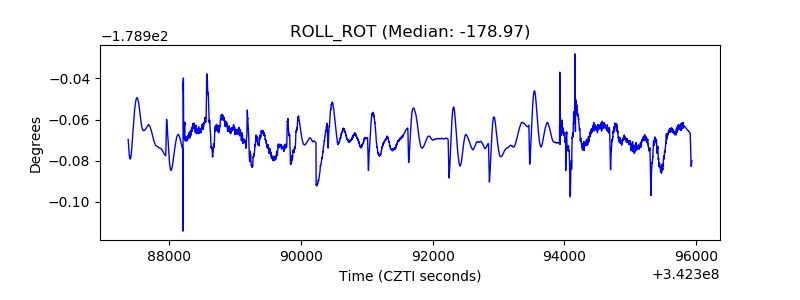 |
| _Roll_DEC | 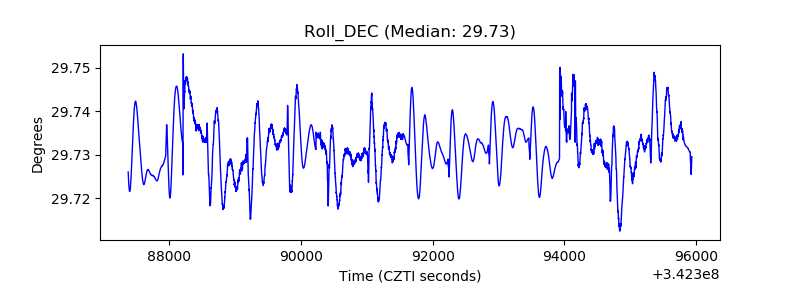 |
| _Roll_RA | 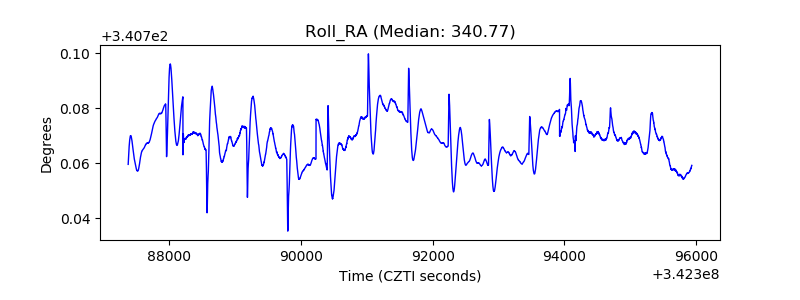 |
| Veto Counter | 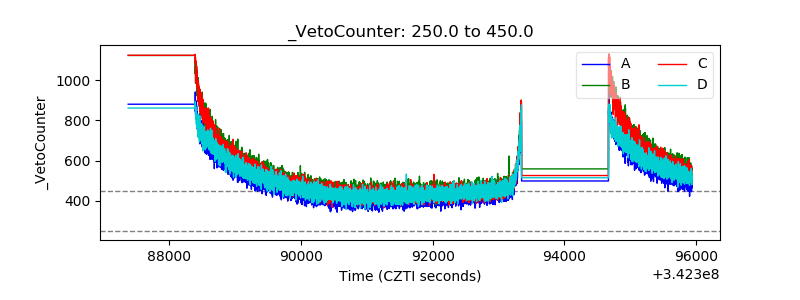 |