| Param | Original file | Final file |
|---|---|---|
| Filename | modeM0/AS1T03_257T01_9000003976_27632cztM0_level2.evt | modeM0/AS1T03_257T01_9000003976_27632cztM0_level2_quad_clean.evt |
| Size (bytes) | 490,374,720 | 97,024,320 |
| Size | 467.7 MB | 92.5 MB |
| Events in quadrant A | 3,167,488 | 640,447 |
| Events in quadrant B | 3,489,117 | 667,947 |
| Events in quadrant C | 3,349,844 | 620,096 |
| Events in quadrant D | 4,428,088 | 581,073 |
| Mode M9 | |||
|---|---|---|---|
| Quadrant | BADHDUFLAG | Total packets | Discarded packets |
| A | 0 | 17 | 0 |
| B | 0 | 18 | 0 |
| C | 0 | 18 | 0 |
| D | 0 | 18 | 0 |
| Mode M0 | |||
|---|---|---|---|
| Quadrant | BADHDUFLAG | Total packets | Discarded packets |
| A | 0 | 13092 | 0 |
| B | 0 | 14137 | 0 |
| C | 0 | 13658 | 0 |
| D | 0 | 17219 | 0 |
| Quadrant | Total seconds | Saturated seconds | Saturation percentage |
|---|---|---|---|
| A | 6138 | 20 | 0.325839% |
| B | 6138 | 56 | 0.912349% |
| C | 6138 | 90 | 1.466276% |
| D | 6138 | 165 | 2.688172% |
Noise dominated data is calculated using 1-second bins in cleaned event files. If a bin has >2000 counts, and if more than 50% of those come from <1% of pixels, then it is considered to be noise-dominated and hence unusable.
| Quadrant | # 1 sec bins | Bins with >0 counts | Bins with >2000 counts | High rate bins dominated by noise | Noise dominated (total time) | Noise dominated (detector-on time) | Marked lightcurve |
|---|---|---|---|---|---|---|---|
| A | 7532 | 6137 | 3 | 3 | 0.04% | 0.05% | 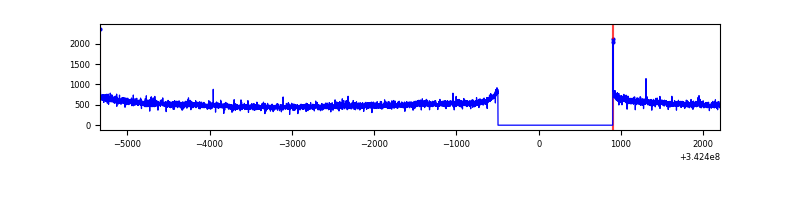 |
| B | 7532 | 6137 | 28 | 28 | 0.37% | 0.46% | 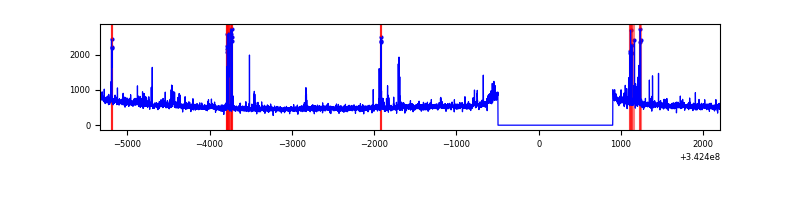 |
| C | 7532 | 6137 | 14 | 14 | 0.19% | 0.23% | 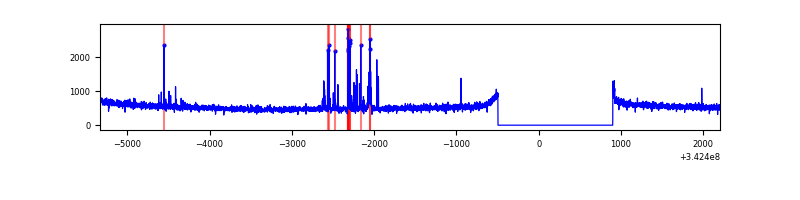 |
| D | 7533 | 6138 | 153 | 153 | 2.03% | 2.49% | 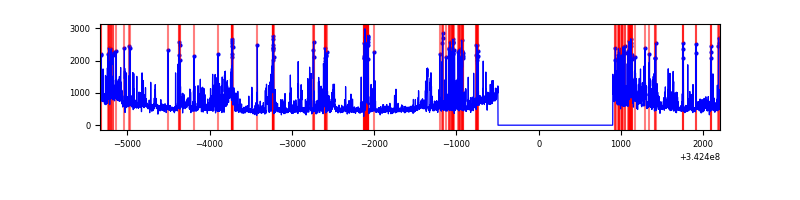 |
Top three noisy pixels from each quadrant. If the there are fewer than three noisy pixels in the level2.evt file, extra rows are filled as -1
| Pixel properties | Quadrant properties | ||||||
|---|---|---|---|---|---|---|---|
| Quadrant | DetID | PixID | Counts | Sigma | Mean | Median | Sigma |
| A | 8 | 192 | 12479 | 71.57 | 818 | 802 | 163.2 |
| A | 13 | 254 | 10904 | 61.91 | 818 | 802 | 163.2 |
| A | 3 | 137 | 7139 | 38.84 | 818 | 802 | 163.2 |
| B | 10 | 245 | 109436 | 709.53 | 826 | 806 | 153.1 |
| B | 3 | 64 | 55607 | 357.94 | 826 | 806 | 153.1 |
| B | 0 | 230 | 41258 | 264.22 | 826 | 806 | 153.1 |
| C | 14 | 238 | 130699 | 711.33 | 791 | 798 | 182.6 |
| C | 2 | 16 | 105274 | 572.1 | 791 | 798 | 182.6 |
| C | 3 | 233 | 19953 | 104.89 | 791 | 798 | 182.6 |
| D | 1 | 52 | 721845 | 3933.34 | 778 | 759 | 183.3 |
| D | 7 | 80 | 620895 | 3382.68 | 778 | 759 | 183.3 |
| D | 2 | 250 | 68657 | 370.37 | 778 | 759 | 183.3 |
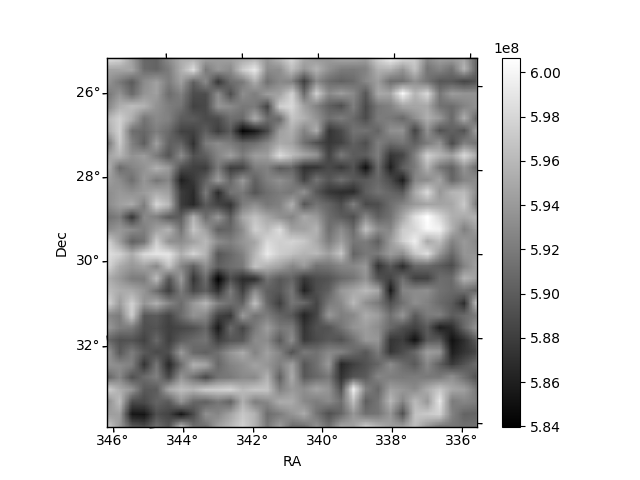
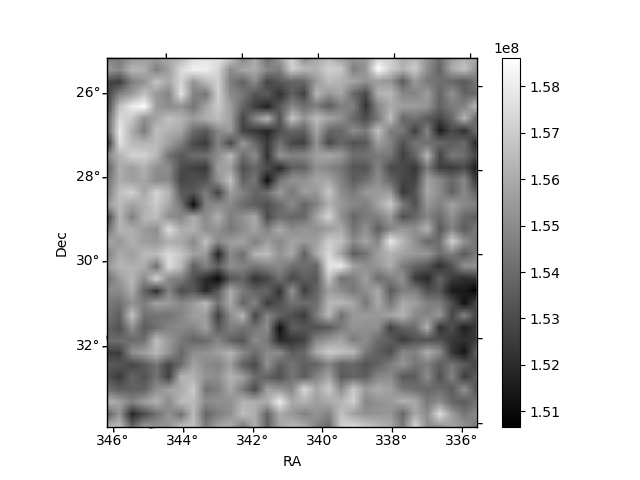
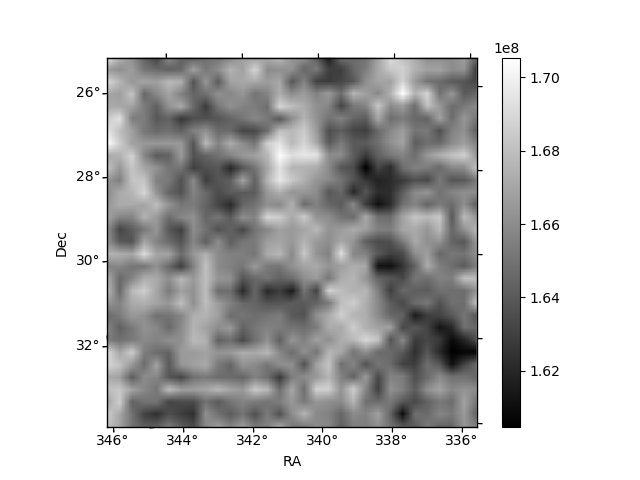
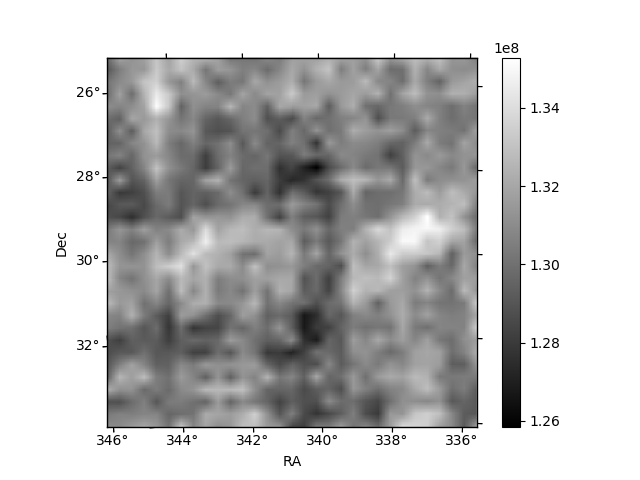
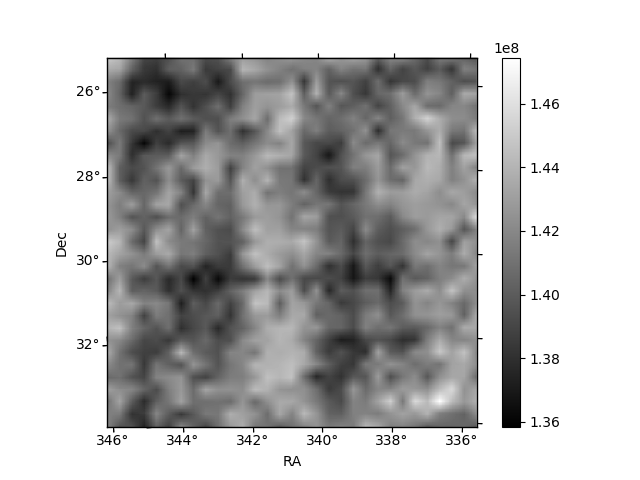
Histogram calculated using DETX and DETY for each event in the final _common_clean file
| Quadrant A | 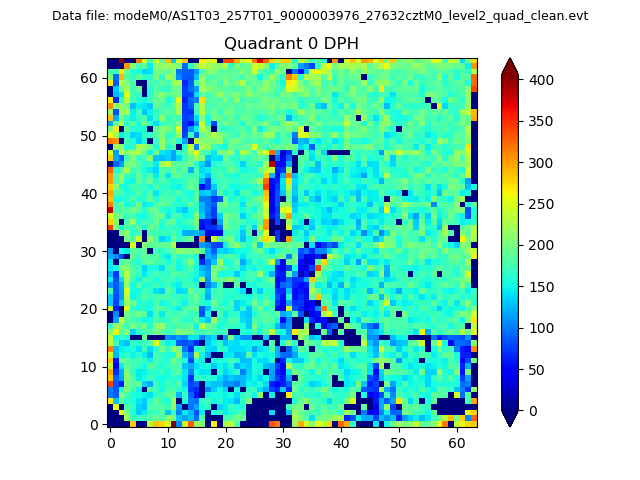 |
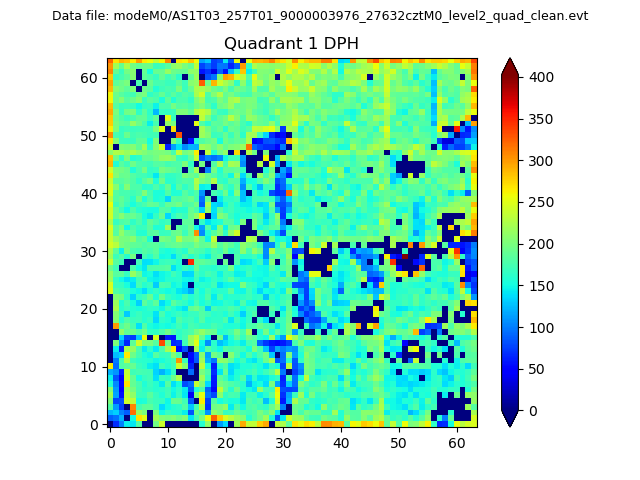 |
Quadrant B |
|---|---|---|---|
| Quadrant D | 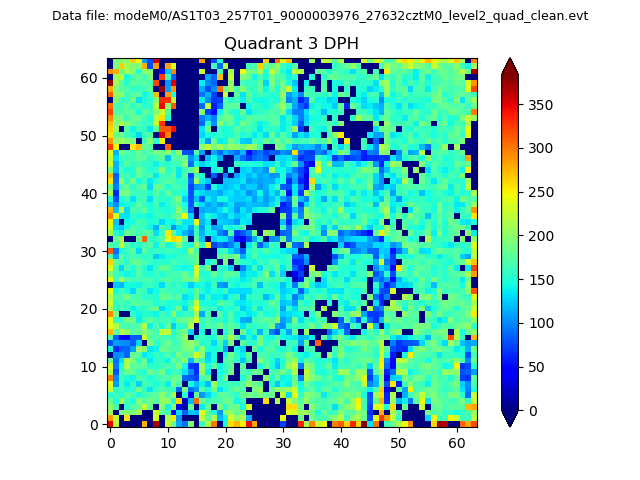 |
 |
Quadrant C |
| Plot type | Count rate plots | Images |
|---|---|---|
| Comparison with Poisson distribution Blue bars denote a histogram of data divided into 1 sec bins. Red curve is a Poisson curve with rate = median count rate of data. |
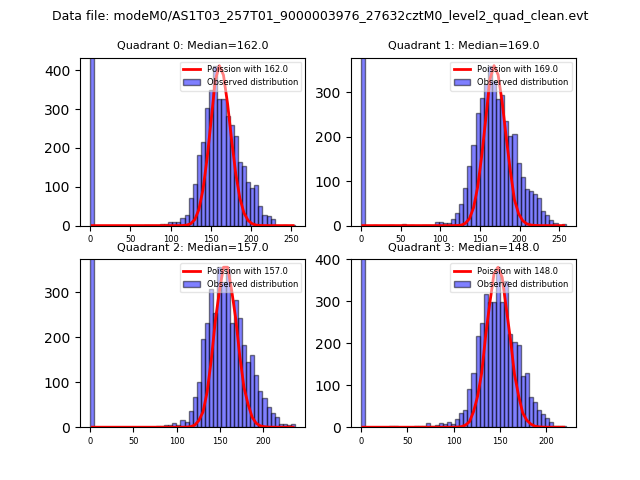 |
 |
| Quadrant-wise count rates Data is divided into 100 sec bins |
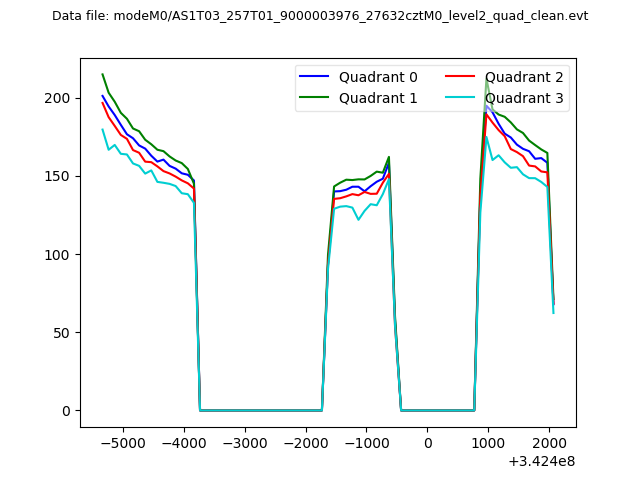 |
|
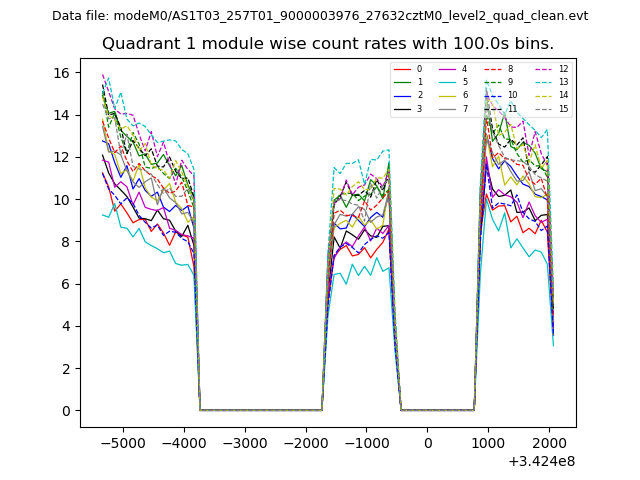
| Module-wise count rates for Quadrant A Data is divided into 100 sec bins |
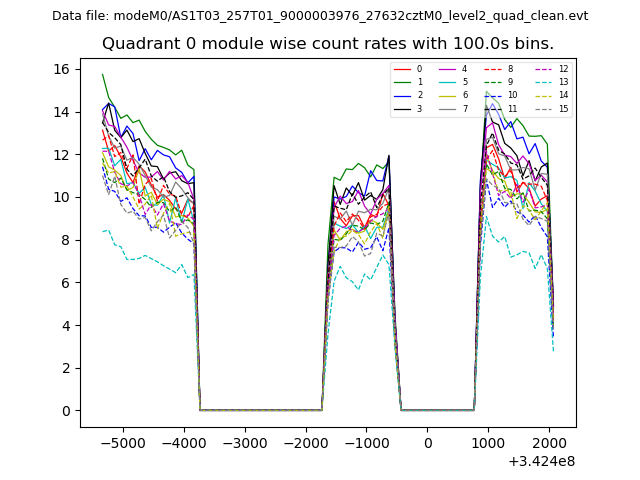 |
 |
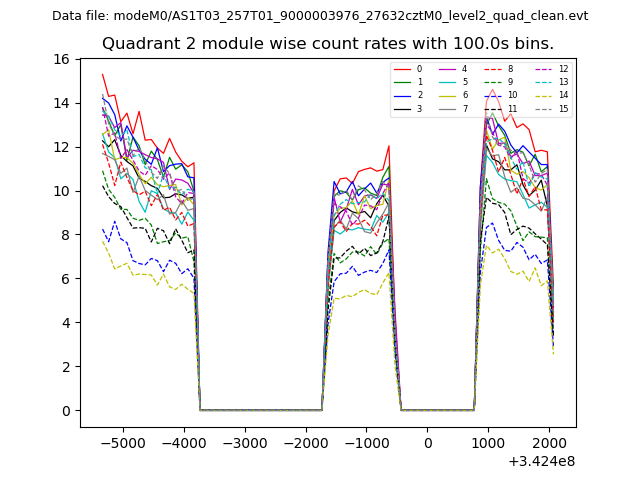
| Module-wise count rates for Quadrant B Data is divided into 100 sec bins |
 |
 |
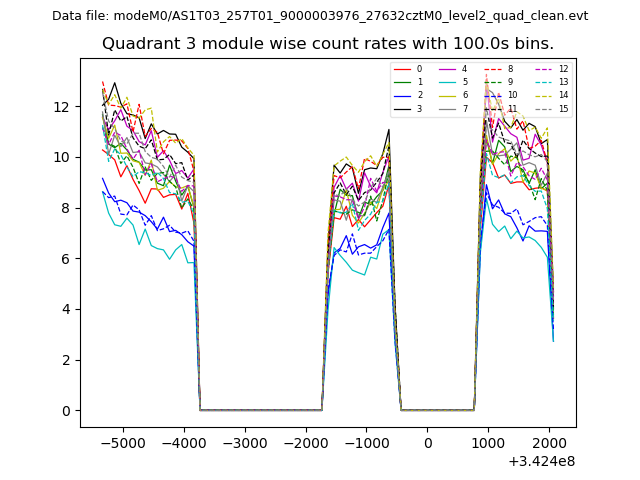
| Module-wise count rates for Quadrant C Data is divided into 100 sec bins |
 |
 |
| Module-wise count rates for Quadrant D Data is divided into 100 sec bins |
 |
 |
| Parameter | Plot |
|---|---|
| CZT HV Monitor | 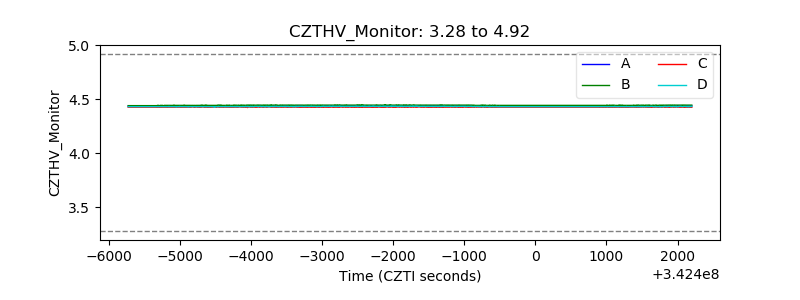 |
| D_VDD | 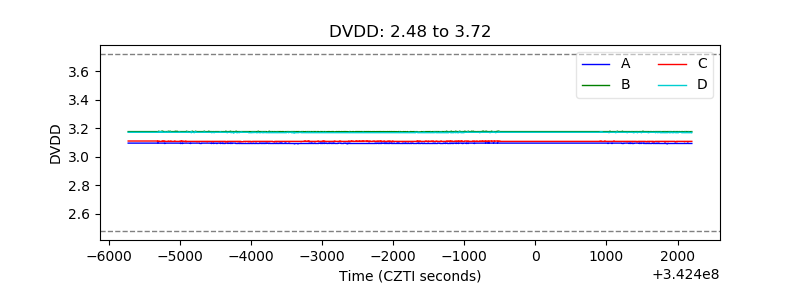 |
| Temperature 1 | 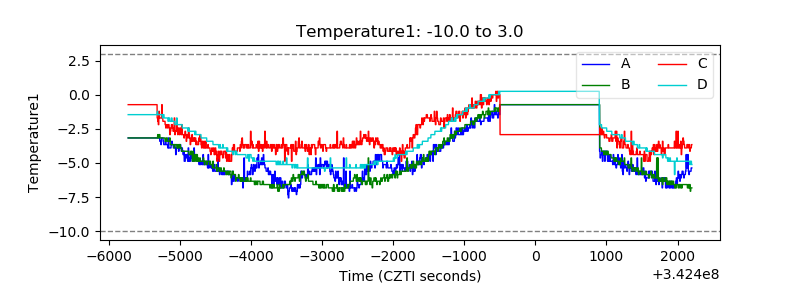 |
| Veto HV Monitor | 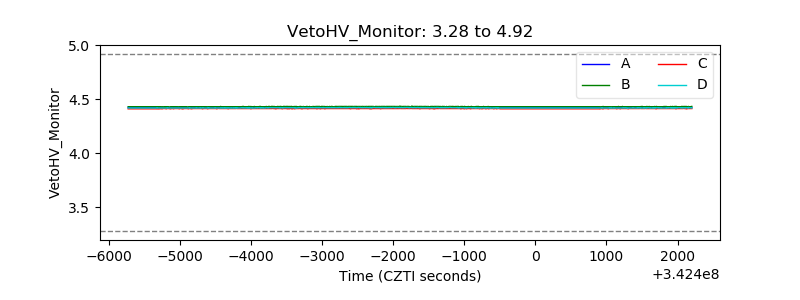 |
| Veto LLD | 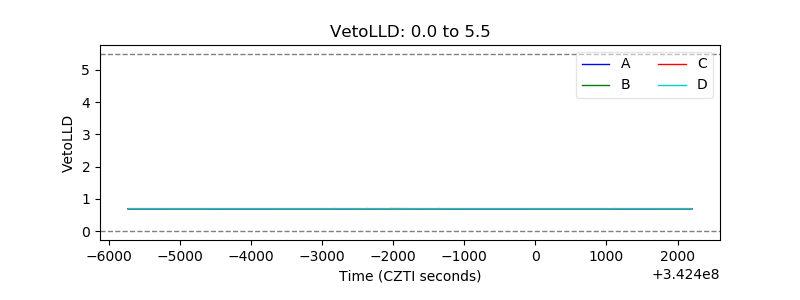 |
| Alpha Counter | 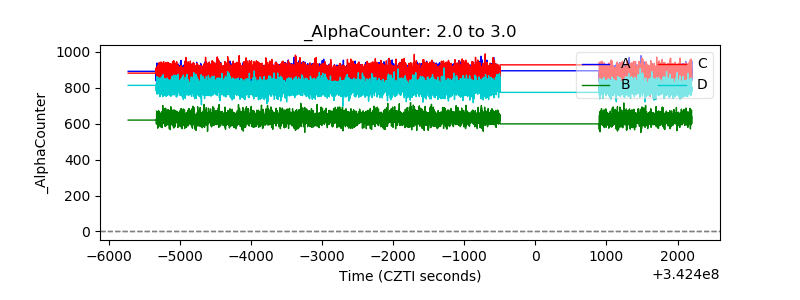 |
| _CPM_Rate |  |
| CZT Counter | 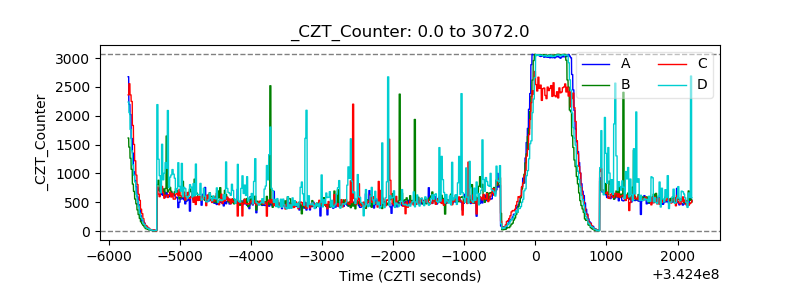 |
| +2.5 Volts monitor |  |
| +5 Volts monitor | 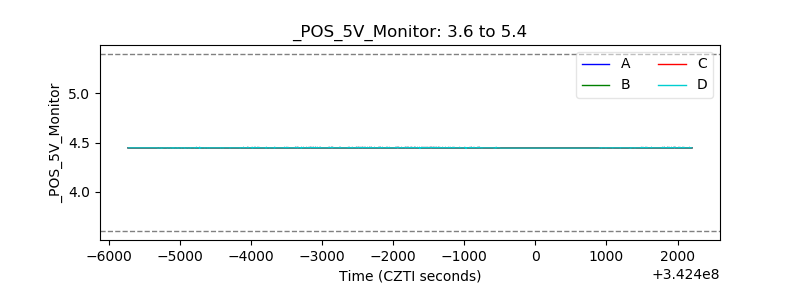 |
| _ROLL_ROT | 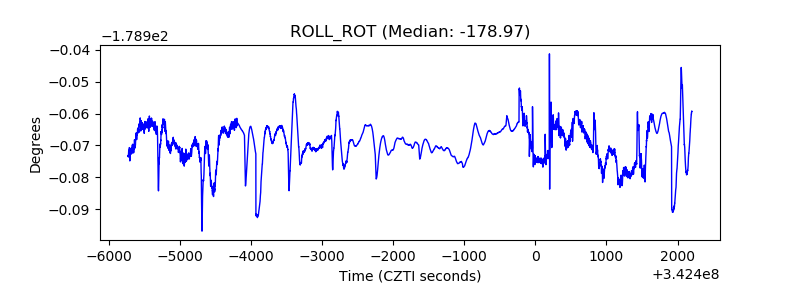 |
| _Roll_DEC | 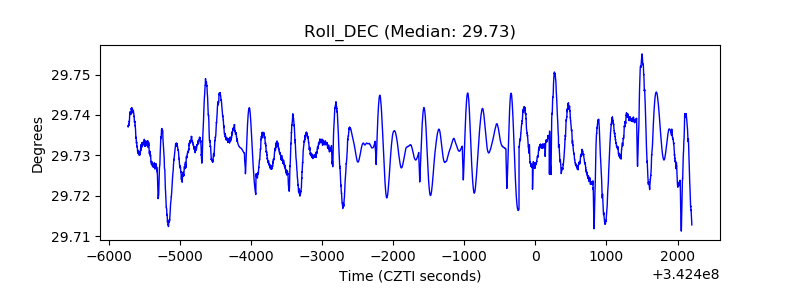 |
| _Roll_RA | 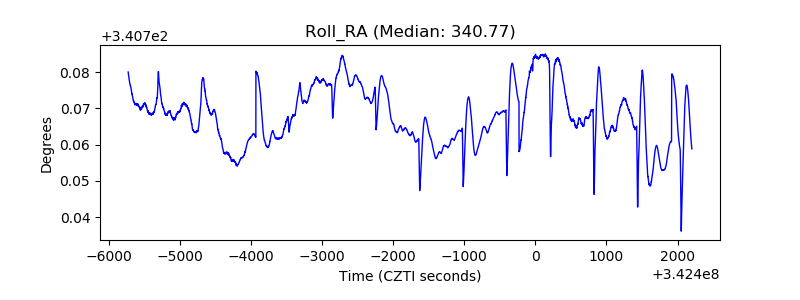 |
| Veto Counter | 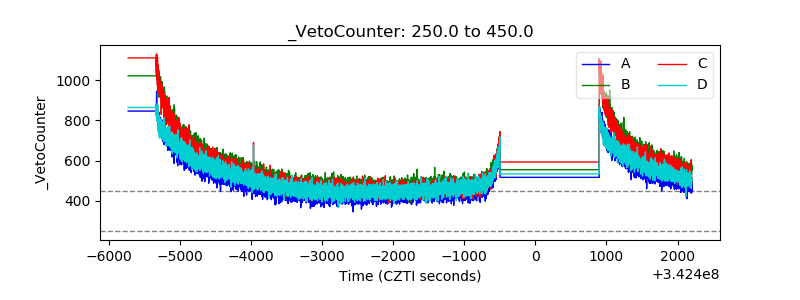 |