| Param | Original file | Final file |
|---|---|---|
| Filename | modeM0/AS1T03_257T01_9000003976_27633cztM0_level2.evt | modeM0/AS1T03_257T01_9000003976_27633cztM0_level2_quad_clean.evt |
| Size (bytes) | 507,692,160 | 88,254,720 |
| Size | 484.2 MB | 84.2 MB |
| Events in quadrant A | 3,229,410 | 573,600 |
| Events in quadrant B | 3,494,164 | 595,918 |
| Events in quadrant C | 3,285,471 | 554,266 |
| Events in quadrant D | 4,943,542 | 513,439 |
| Mode M9 | |||
|---|---|---|---|
| Quadrant | BADHDUFLAG | Total packets | Discarded packets |
| A | 0 | 21 | 0 |
| B | 0 | 22 | 0 |
| C | 0 | 22 | 0 |
| D | 0 | 22 | 0 |
| Mode M0 | |||
|---|---|---|---|
| Quadrant | BADHDUFLAG | Total packets | Discarded packets |
| A | 0 | 13270 | 0 |
| B | 0 | 14079 | 0 |
| C | 0 | 13392 | 0 |
| D | 0 | 18775 | 0 |
| Quadrant | Total seconds | Saturated seconds | Saturation percentage |
|---|---|---|---|
| A | 6232 | 62 | 0.994865% |
| B | 6232 | 108 | 1.732991% |
| C | 6232 | 109 | 1.749037% |
| D | 6232 | 335 | 5.375481% |
Noise dominated data is calculated using 1-second bins in cleaned event files. If a bin has >2000 counts, and if more than 50% of those come from <1% of pixels, then it is considered to be noise-dominated and hence unusable.
| Quadrant | # 1 sec bins | Bins with >0 counts | Bins with >2000 counts | High rate bins dominated by noise | Noise dominated (total time) | Noise dominated (detector-on time) | Marked lightcurve |
|---|---|---|---|---|---|---|---|
| A | 7581 | 6231 | 7 | 7 | 0.09% | 0.11% |  |
| B | 7581 | 6231 | 20 | 20 | 0.26% | 0.32% |  |
| C | 7581 | 6231 | 1 | 1 | 0.01% | 0.02% |  |
| D | 7581 | 6231 | 263 | 263 | 3.47% | 4.22% |  |
Top three noisy pixels from each quadrant. If the there are fewer than three noisy pixels in the level2.evt file, extra rows are filled as -1
| Pixel properties | Quadrant properties | ||||||
|---|---|---|---|---|---|---|---|
| Quadrant | DetID | PixID | Counts | Sigma | Mean | Median | Sigma |
| A | 8 | 192 | 11350 | 64.62 | 831 | 817 | 163.0 |
| A | 13 | 254 | 11156 | 63.43 | 831 | 817 | 163.0 |
| A | 14 | 223 | 7624 | 41.76 | 831 | 817 | 163.0 |
| B | 3 | 64 | 100464 | 642.71 | 837 | 818 | 155.0 |
| B | 10 | 245 | 62128 | 395.45 | 837 | 818 | 155.0 |
| B | 0 | 230 | 23667 | 147.37 | 837 | 818 | 155.0 |
| C | 14 | 238 | 132189 | 712.73 | 801 | 809 | 184.3 |
| C | 3 | 233 | 24087 | 126.28 | 801 | 809 | 184.3 |
| C | 2 | 16 | 6011 | 28.22 | 801 | 809 | 184.3 |
| D | 1 | 52 | 1742088 | 9403.08 | 781 | 759 | 185.2 |
| D | 7 | 80 | 145007 | 778.93 | 781 | 759 | 185.2 |
| D | 2 | 250 | 85600 | 458.14 | 781 | 759 | 185.2 |
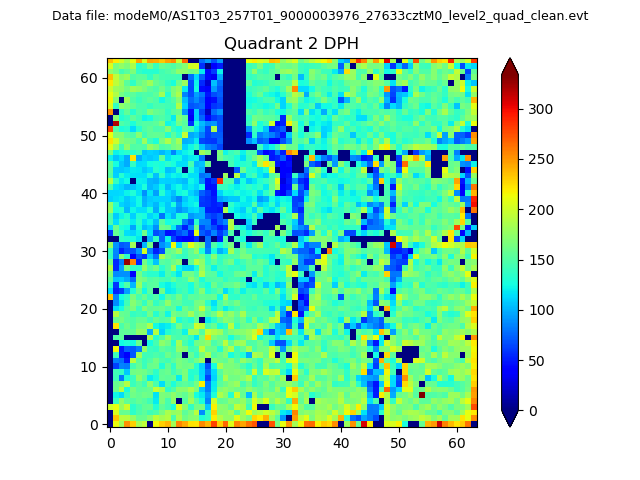
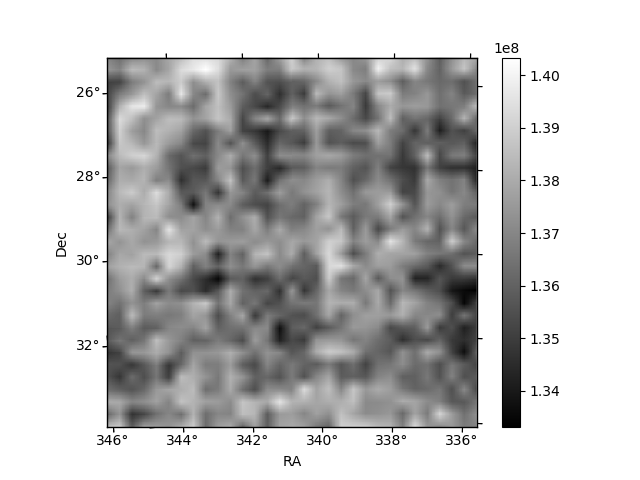
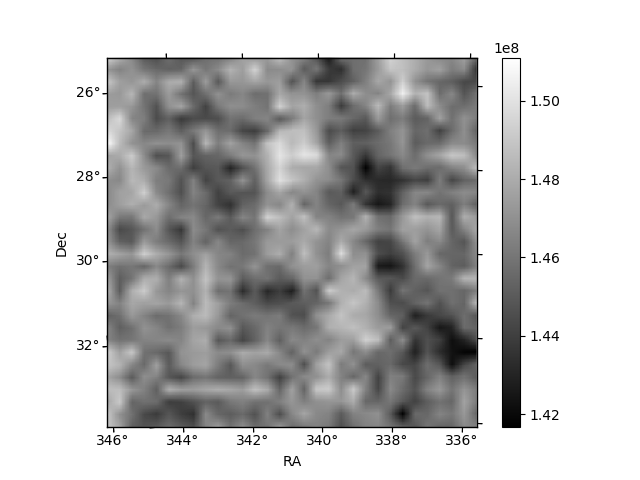
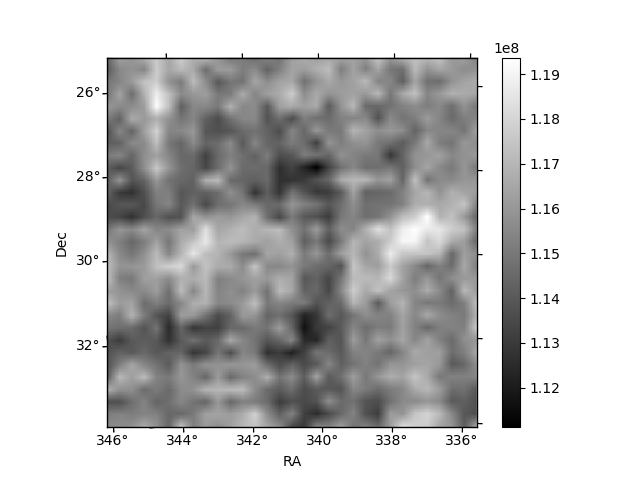
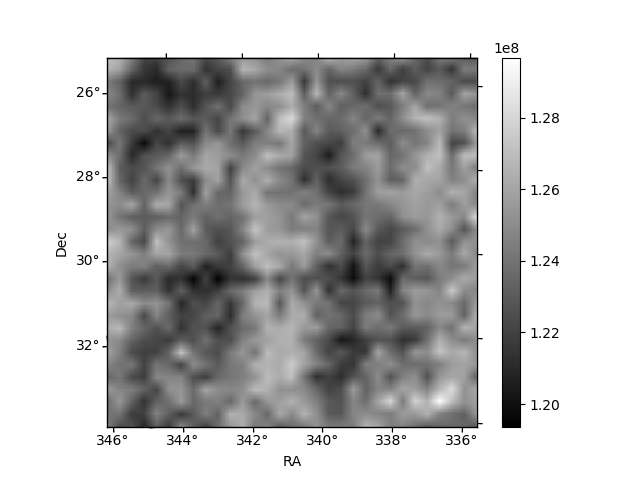
Histogram calculated using DETX and DETY for each event in the final _common_clean file
| Quadrant A | 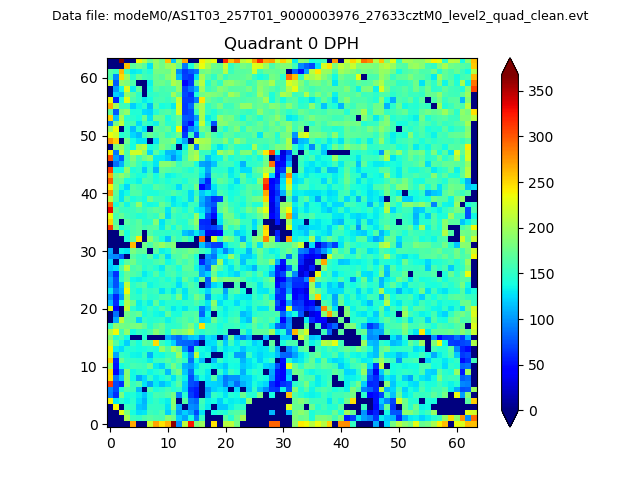 |
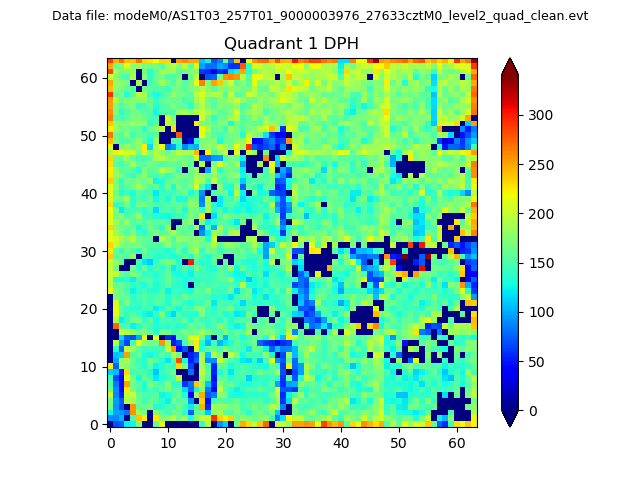 |
Quadrant B |
|---|---|---|---|
| Quadrant D | 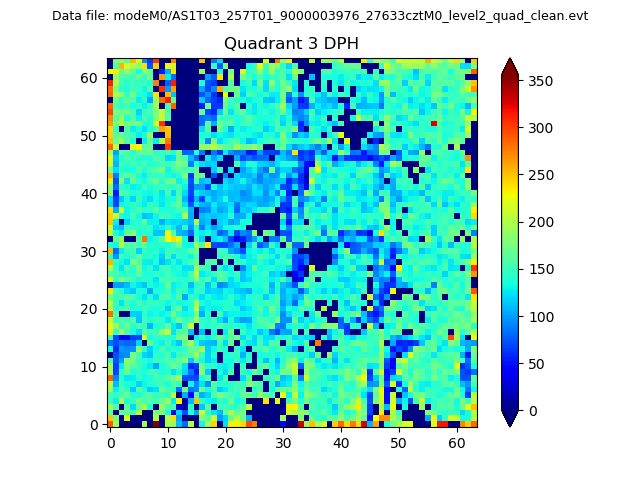 |
 |
Quadrant C |
| Plot type | Count rate plots | Images |
|---|---|---|
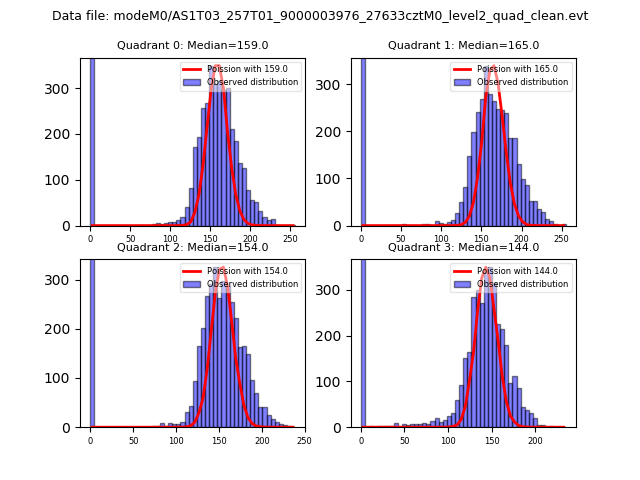
| Comparison with Poisson distribution Blue bars denote a histogram of data divided into 1 sec bins. Red curve is a Poisson curve with rate = median count rate of data. |
 |
 |
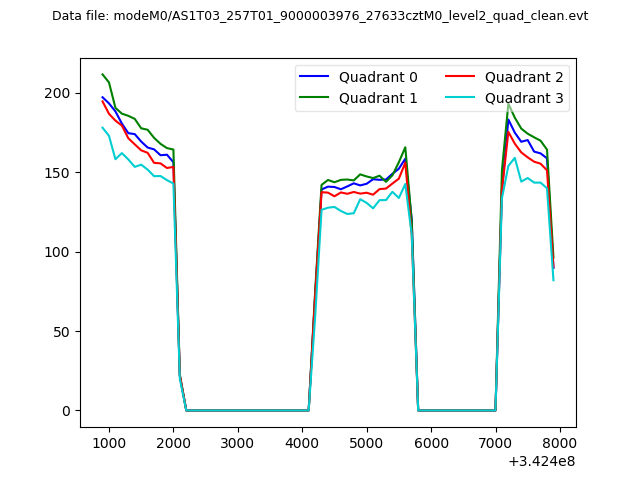
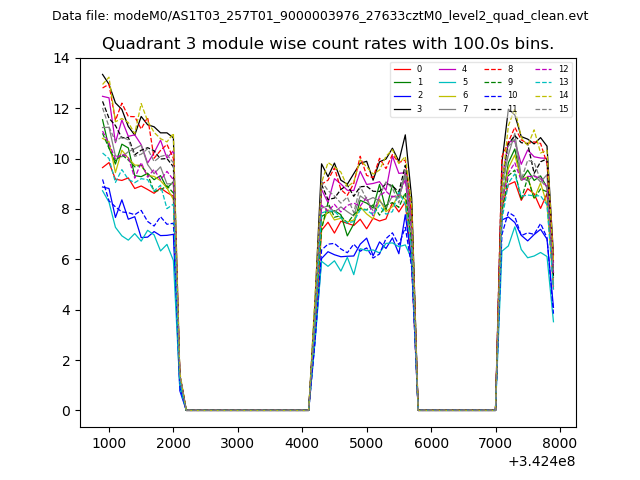
| Quadrant-wise count rates Data is divided into 100 sec bins |
 |
|
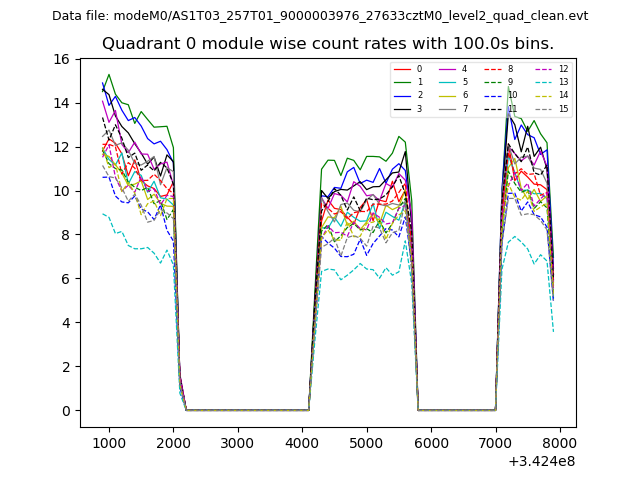
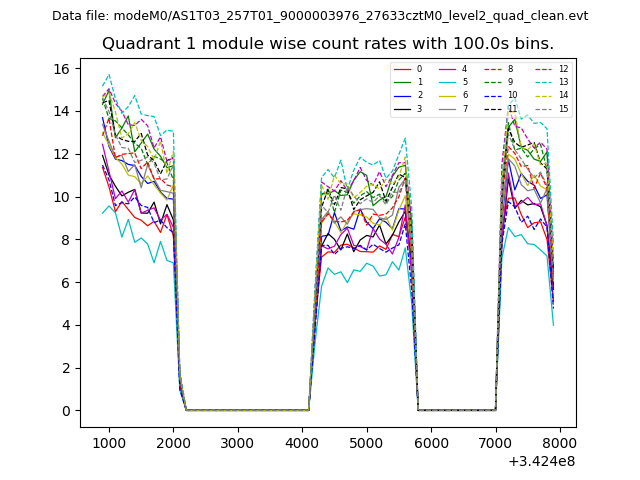
| Module-wise count rates for Quadrant A Data is divided into 100 sec bins |
 |
 |
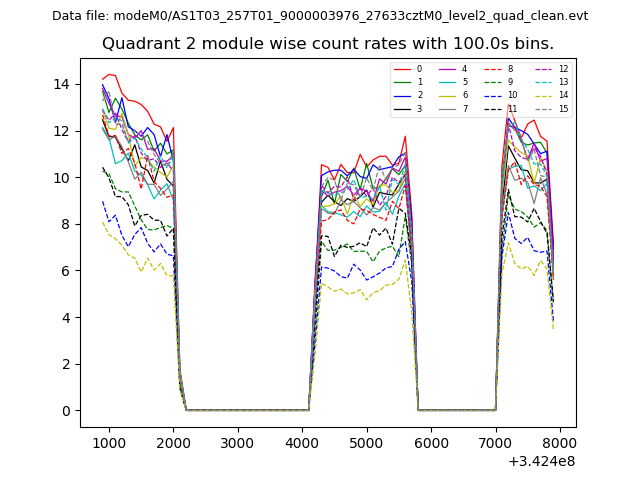
| Module-wise count rates for Quadrant B Data is divided into 100 sec bins |
 |
 |
| Module-wise count rates for Quadrant C Data is divided into 100 sec bins |
 |
 |
| Module-wise count rates for Quadrant D Data is divided into 100 sec bins |
 |
 |
| Parameter | Plot |
|---|---|
| CZT HV Monitor | 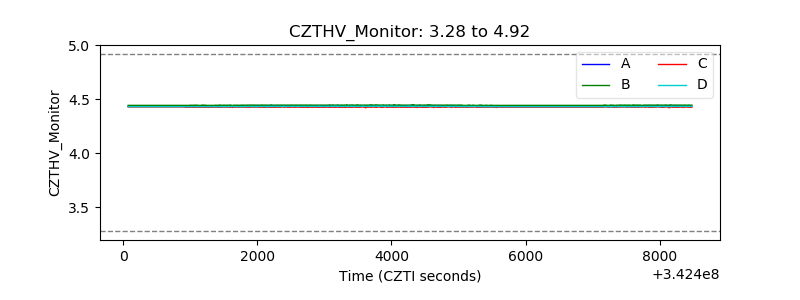 |
| D_VDD | 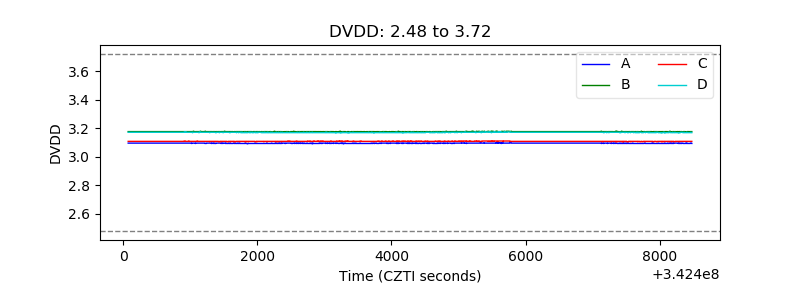 |
| Temperature 1 | 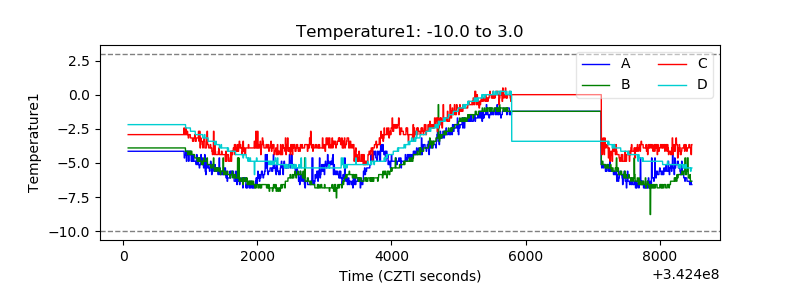 |
| Veto HV Monitor |  |
| Veto LLD | 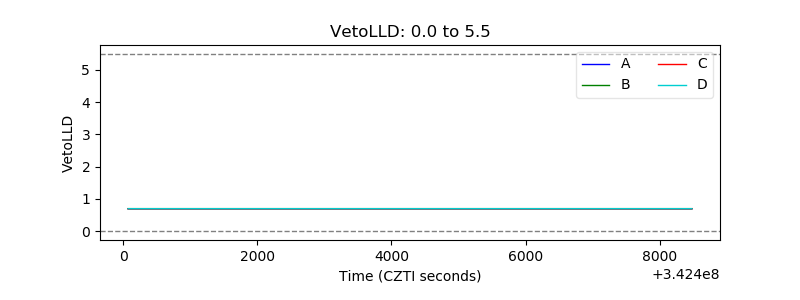 |
| Alpha Counter | 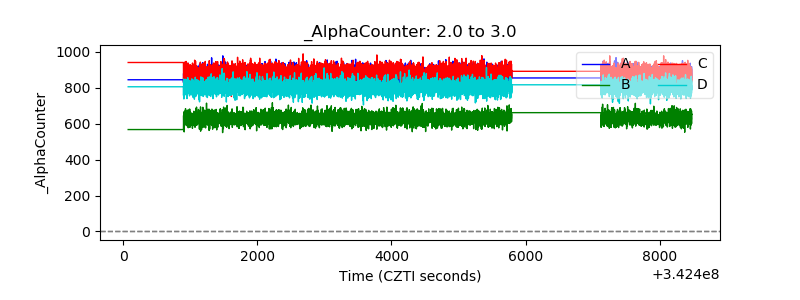 |
| _CPM_Rate | 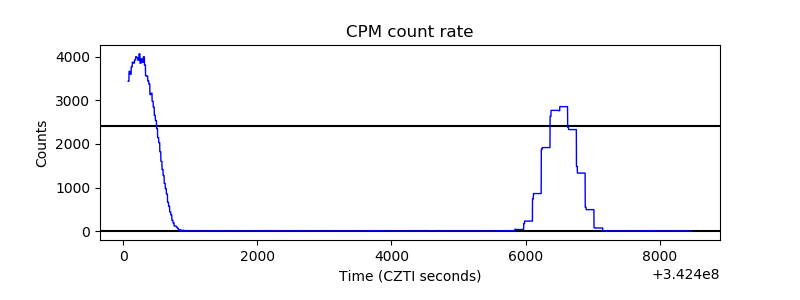 |
| CZT Counter | 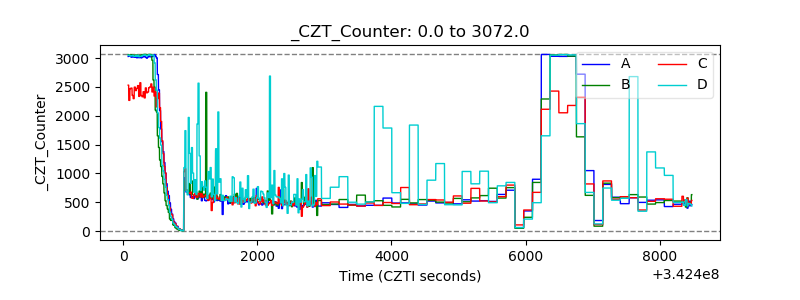 |
| +2.5 Volts monitor | 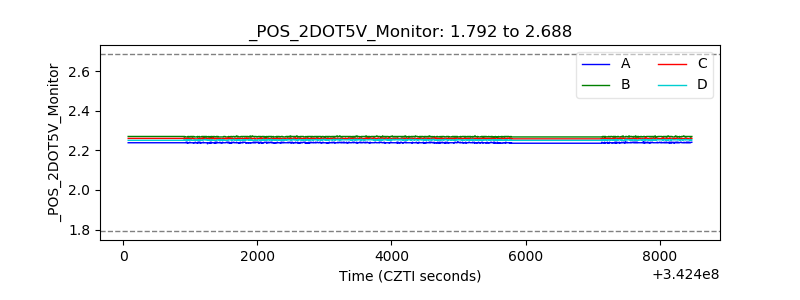 |
| +5 Volts monitor |  |
| _ROLL_ROT | 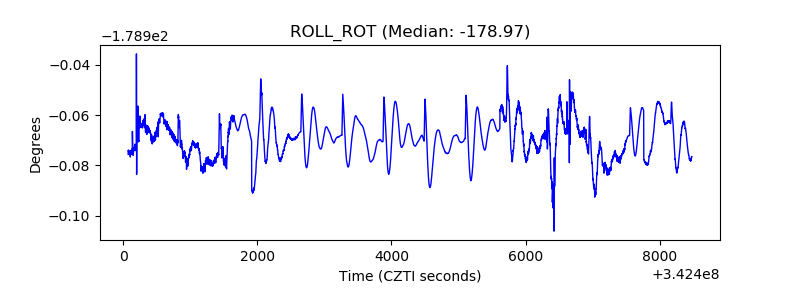 |
| _Roll_DEC | 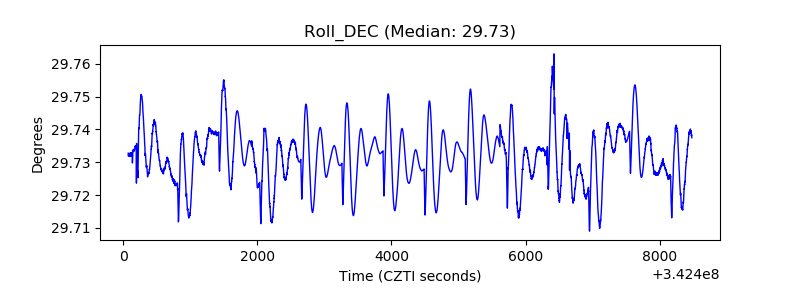 |
| _Roll_RA | 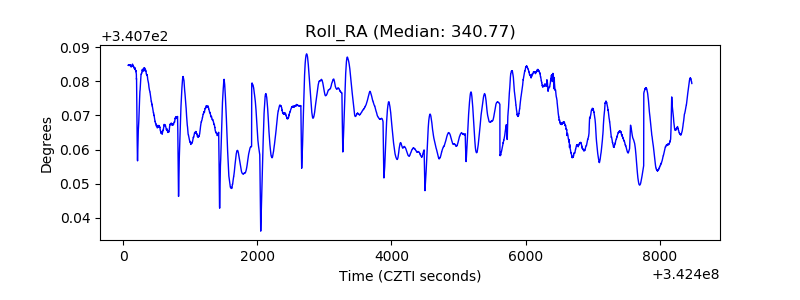 |
| Veto Counter | 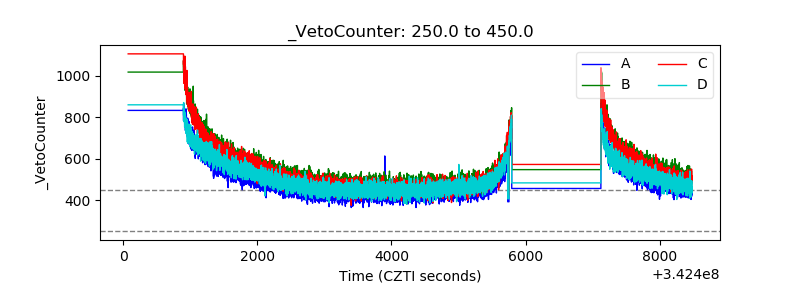 |