| Param | Original file | Final file |
|---|---|---|
| Filename | modeM0/AS1T03_257T01_9000003976_27634cztM0_level2.evt | modeM0/AS1T03_257T01_9000003976_27634cztM0_level2_quad_clean.evt |
| Size (bytes) | 507,012,480 | 77,515,200 |
| Size | 483.5 MB | 73.9 MB |
| Events in quadrant A | 3,260,776 | 485,463 |
| Events in quadrant B | 3,682,755 | 503,254 |
| Events in quadrant C | 3,357,045 | 469,064 |
| Events in quadrant D | 4,612,703 | 435,281 |
| Mode M9 | |||
|---|---|---|---|
| Quadrant | BADHDUFLAG | Total packets | Discarded packets |
| A | 0 | 20 | 0 |
| B | 0 | 21 | 0 |
| C | 0 | 21 | 0 |
| D | 0 | 21 | 0 |
| Mode M0 | |||
|---|---|---|---|
| Quadrant | BADHDUFLAG | Total packets | Discarded packets |
| A | 0 | 13558 | 0 |
| B | 0 | 14810 | 0 |
| C | 0 | 13767 | 0 |
| D | 0 | 18033 | 0 |
| Quadrant | Total seconds | Saturated seconds | Saturation percentage |
|---|---|---|---|
| A | 6518 | 19 | 0.291500% |
| B | 6518 | 76 | 1.166002% |
| C | 6518 | 56 | 0.859159% |
| D | 6518 | 282 | 4.326481% |
Noise dominated data is calculated using 1-second bins in cleaned event files. If a bin has >2000 counts, and if more than 50% of those come from <1% of pixels, then it is considered to be noise-dominated and hence unusable.
| Quadrant | # 1 sec bins | Bins with >0 counts | Bins with >2000 counts | High rate bins dominated by noise | Noise dominated (total time) | Noise dominated (detector-on time) | Marked lightcurve |
|---|---|---|---|---|---|---|---|
| A | 7842 | 6517 | 5 | 5 | 0.06% | 0.08% | 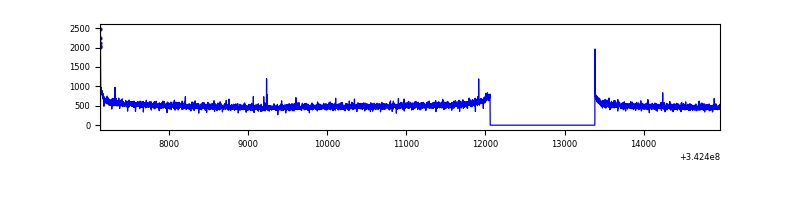 |
| B | 7842 | 6517 | 41 | 41 | 0.52% | 0.63% | 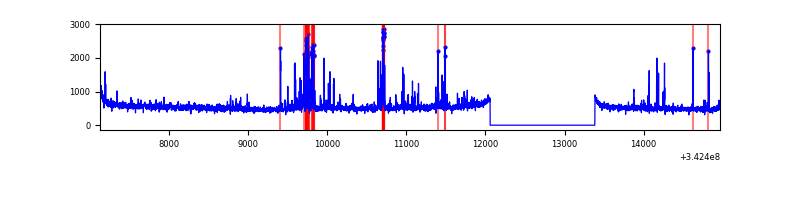 |
| C | 7842 | 6517 | 2 | 2 | 0.03% | 0.03% | 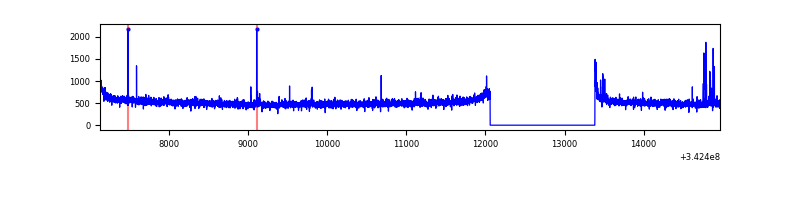 |
| D | 7842 | 6518 | 231 | 231 | 2.95% | 3.54% | 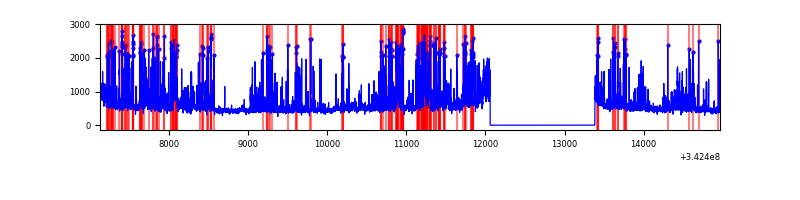 |
Top three noisy pixels from each quadrant. If the there are fewer than three noisy pixels in the level2.evt file, extra rows are filled as -1
| Pixel properties | Quadrant properties | ||||||
|---|---|---|---|---|---|---|---|
| Quadrant | DetID | PixID | Counts | Sigma | Mean | Median | Sigma |
| A | 13 | 254 | 11813 | 66.37 | 839 | 824 | 165.6 |
| A | 8 | 192 | 10112 | 56.1 | 839 | 824 | 165.6 |
| A | 3 | 137 | 7628 | 41.1 | 839 | 824 | 165.6 |
| B | 10 | 245 | 299857 | 1879.46 | 843 | 822 | 159.1 |
| B | 3 | 64 | 31678 | 193.93 | 843 | 822 | 159.1 |
| B | 12 | 111 | 18938 | 113.86 | 843 | 822 | 159.1 |
| C | 14 | 238 | 133457 | 704.57 | 808 | 816 | 188.3 |
| C | 2 | 16 | 54042 | 282.73 | 808 | 816 | 188.3 |
| C | 3 | 233 | 19914 | 101.45 | 808 | 816 | 188.3 |
| D | 1 | 52 | 1466253 | 7732.81 | 790 | 768 | 189.5 |
| D | 2 | 250 | 114425 | 599.72 | 790 | 768 | 189.5 |
| D | 12 | 238 | 25708 | 131.6 | 790 | 768 | 189.5 |
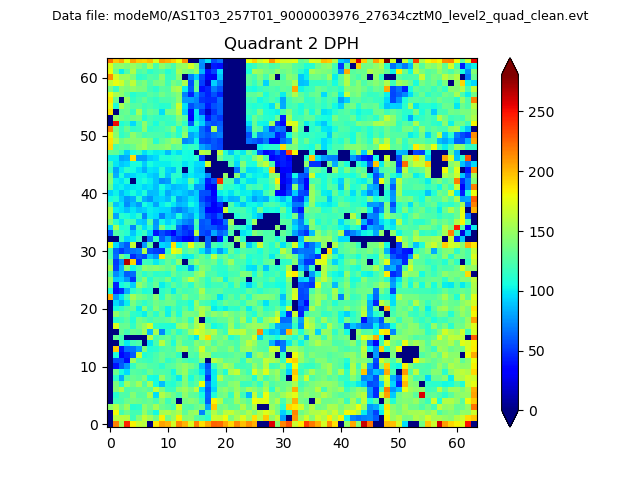
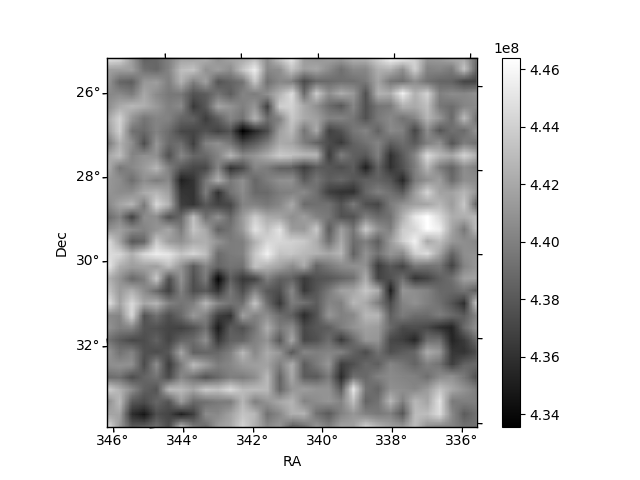
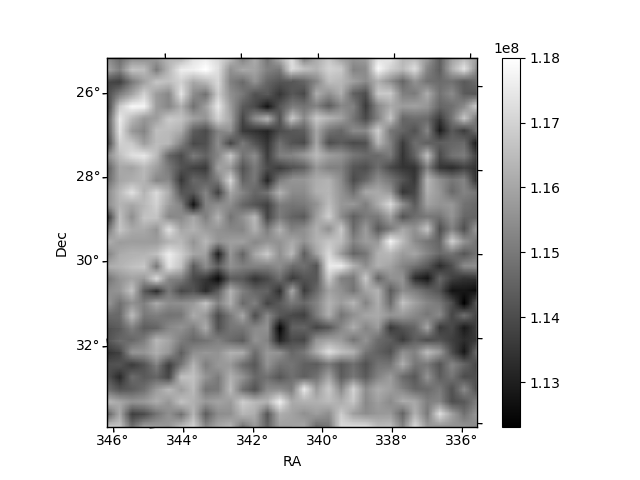
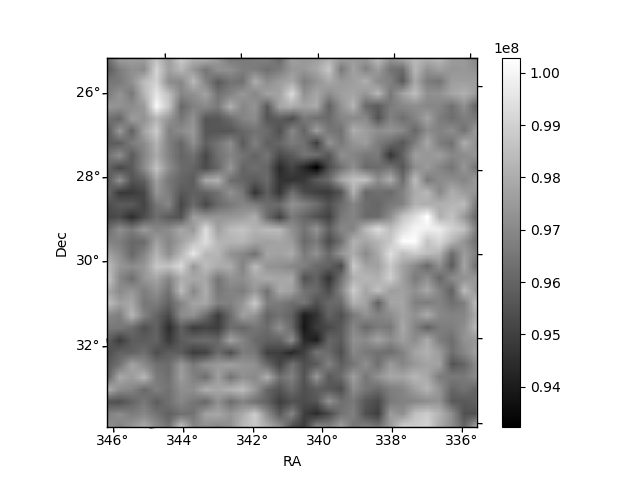
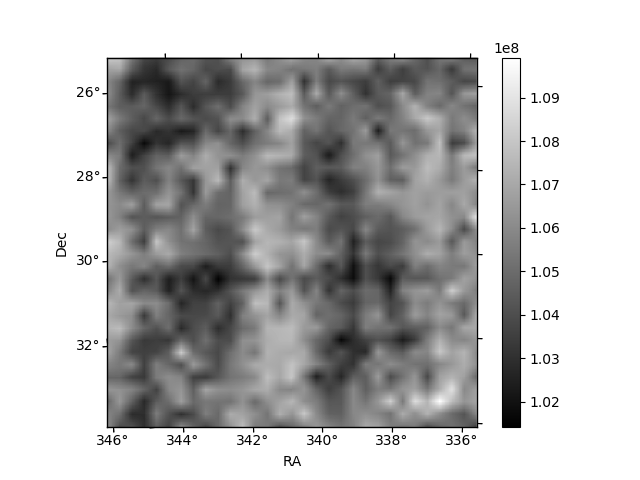
Histogram calculated using DETX and DETY for each event in the final _common_clean file
| Quadrant A | 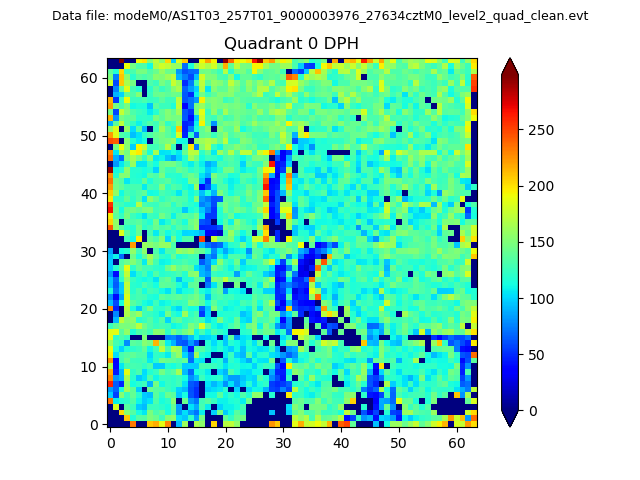 |
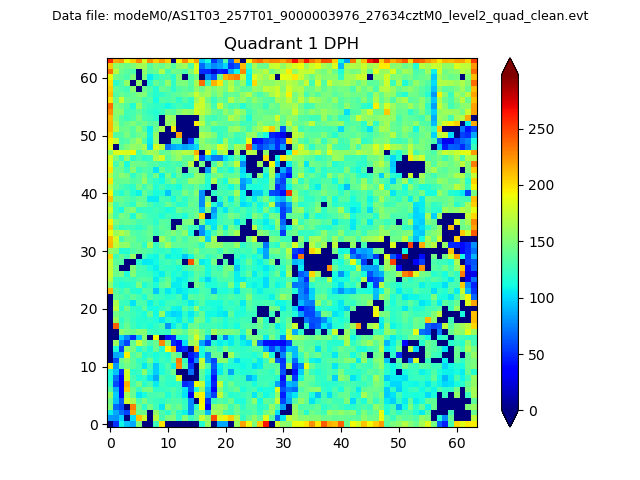 |
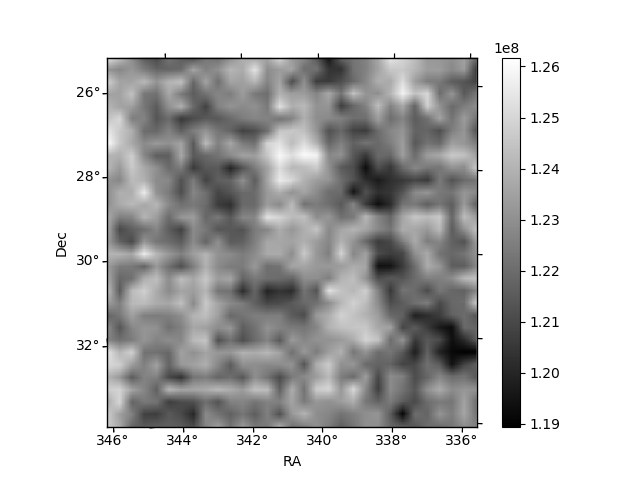
Quadrant B |
|---|---|---|---|
| Quadrant D | 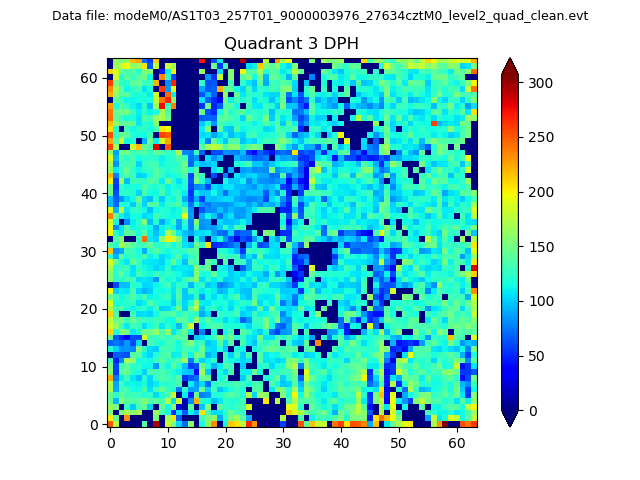 |
 |
Quadrant C |
| Plot type | Count rate plots | Images |
|---|---|---|
| Comparison with Poisson distribution Blue bars denote a histogram of data divided into 1 sec bins. Red curve is a Poisson curve with rate = median count rate of data. |
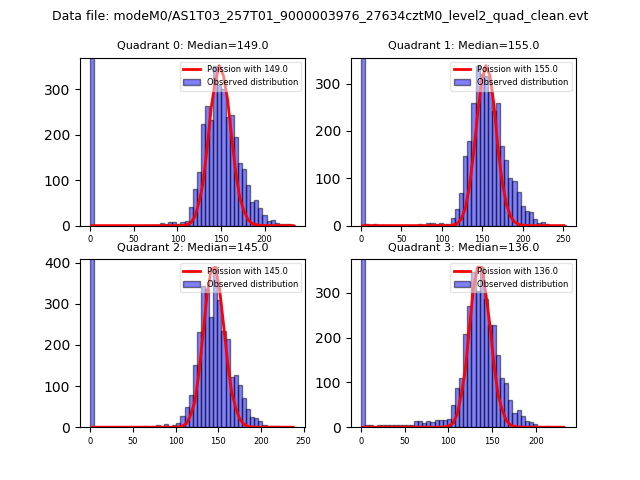 |
 |
| Quadrant-wise count rates Data is divided into 100 sec bins |
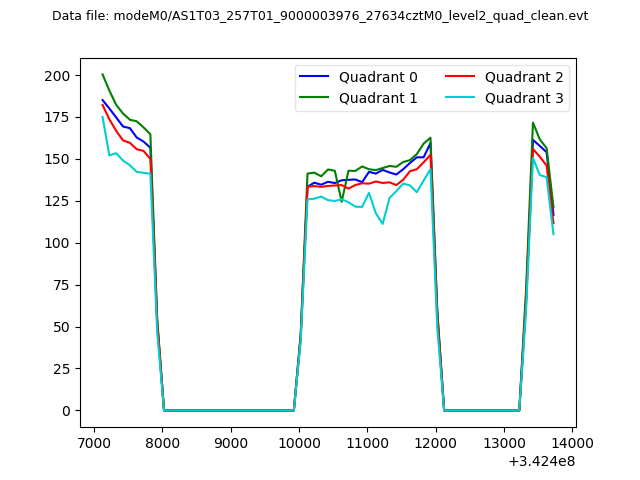 |
|
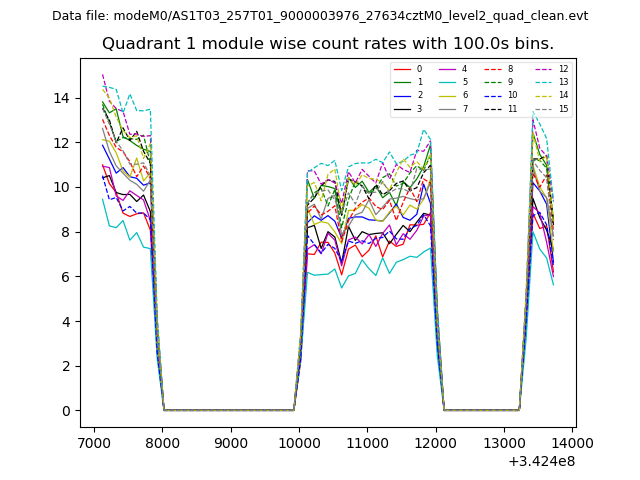
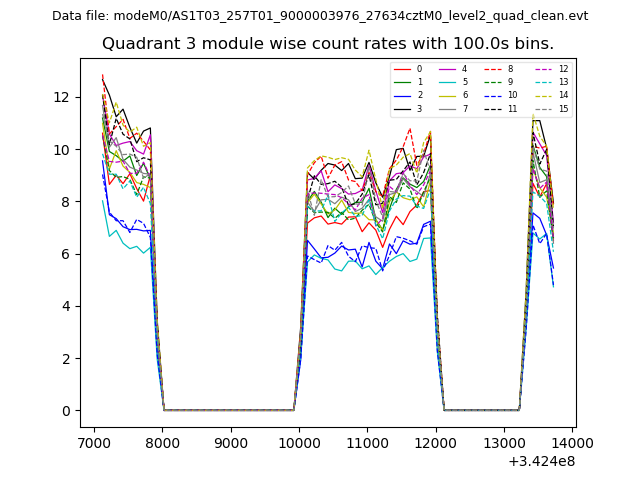
| Module-wise count rates for Quadrant A Data is divided into 100 sec bins |
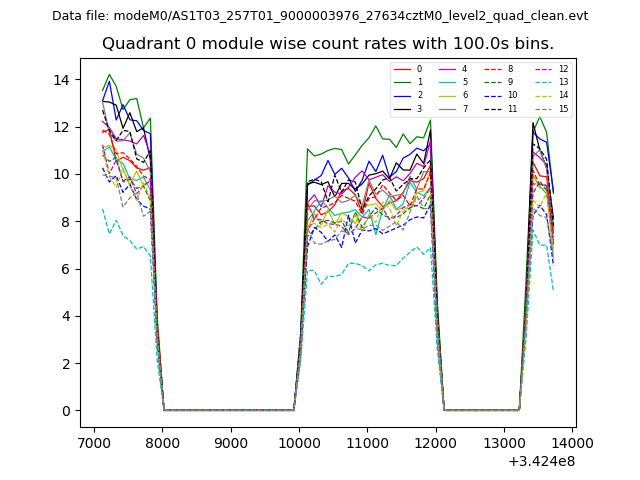 |
 |
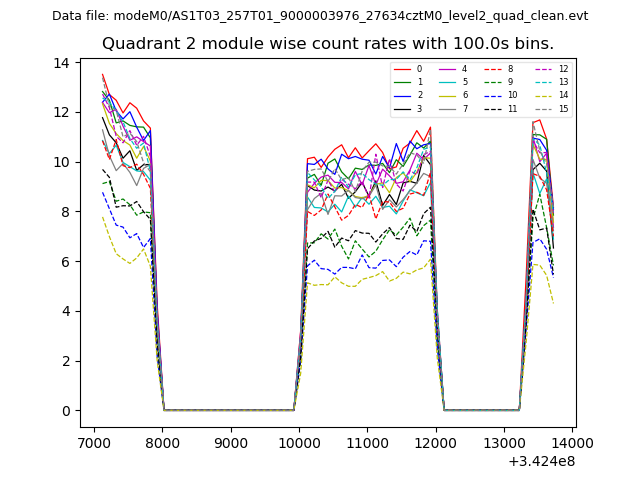
| Module-wise count rates for Quadrant B Data is divided into 100 sec bins |
 |
 |
| Module-wise count rates for Quadrant C Data is divided into 100 sec bins |
 |
 |
| Module-wise count rates for Quadrant D Data is divided into 100 sec bins |
 |
 |
| Parameter | Plot |
|---|---|
| CZT HV Monitor | 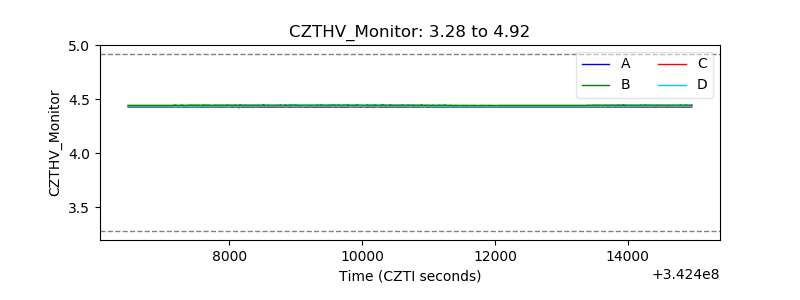 |
| D_VDD | 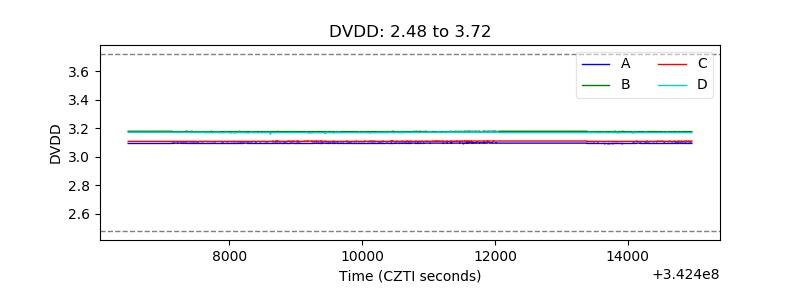 |
| Temperature 1 | 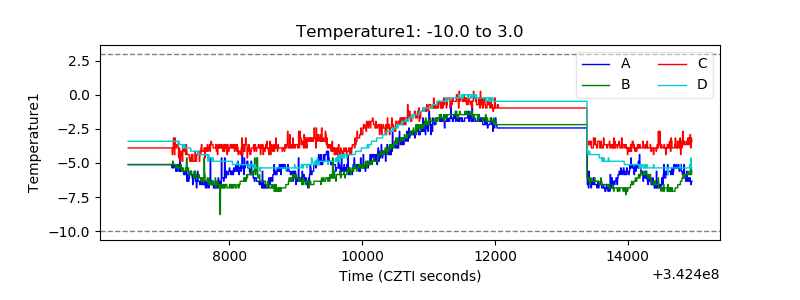 |
| Veto HV Monitor | 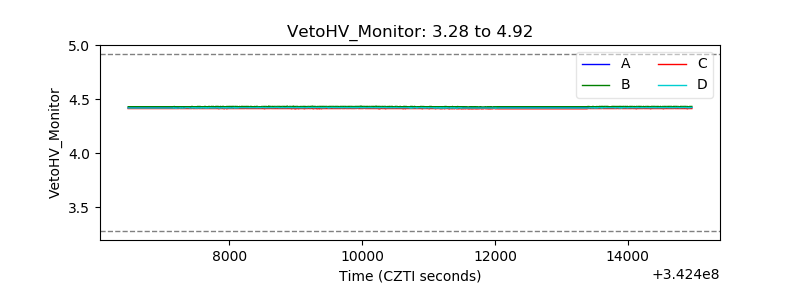 |
| Veto LLD | 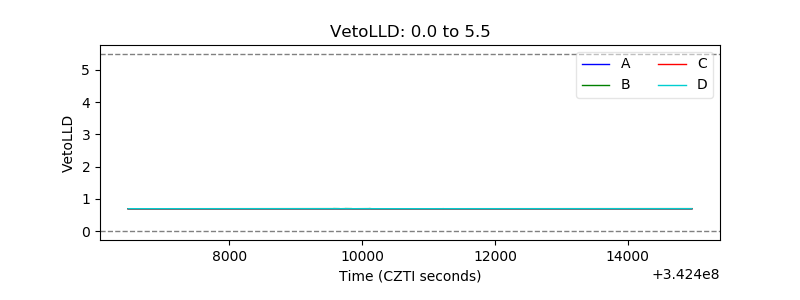 |
| Alpha Counter | 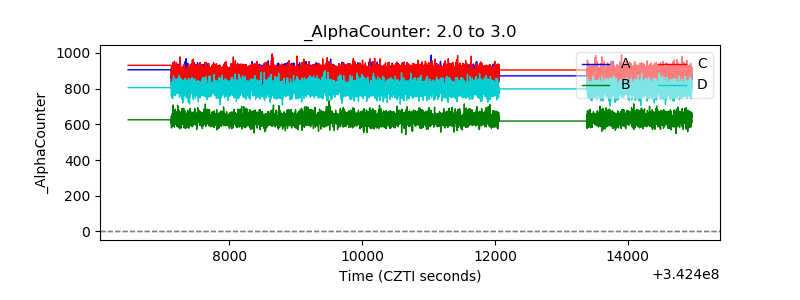 |
| _CPM_Rate | 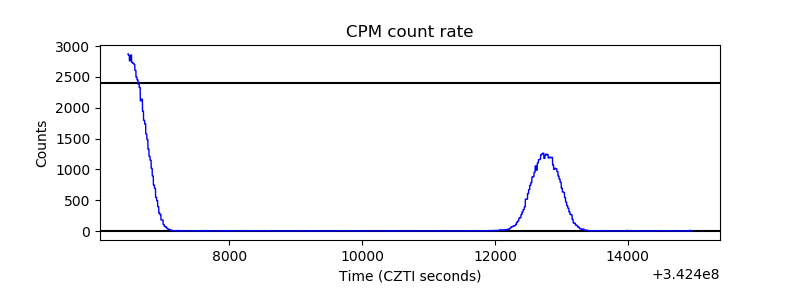 |
| CZT Counter | 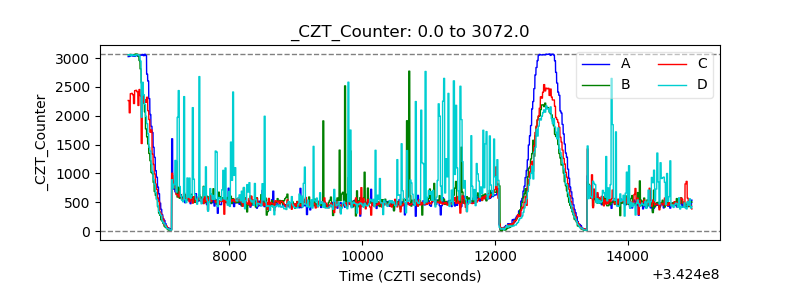 |
| +2.5 Volts monitor |  |
| +5 Volts monitor |  |
| _ROLL_ROT | 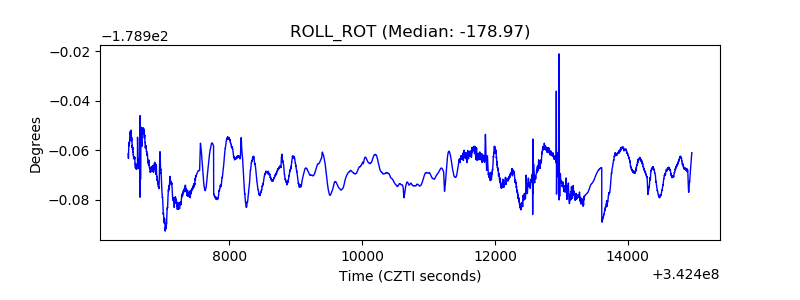 |
| _Roll_DEC | 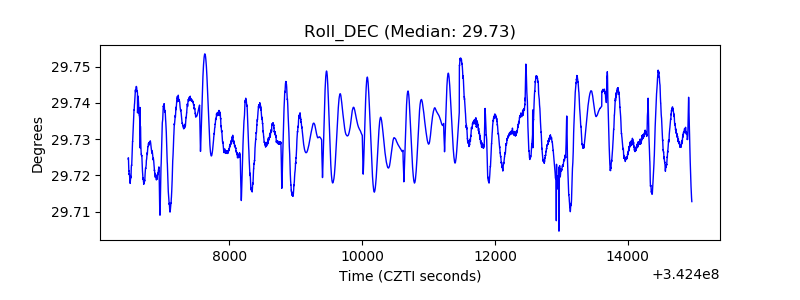 |
| _Roll_RA | 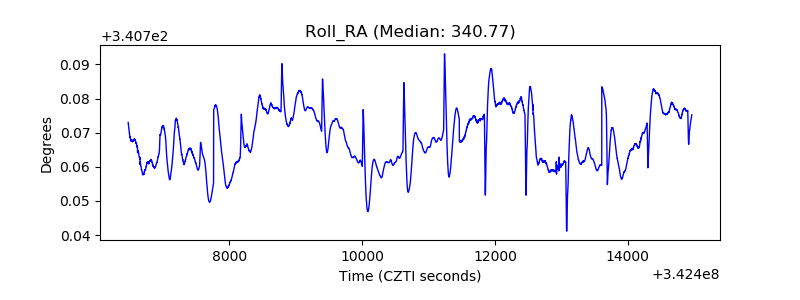 |
| Veto Counter | 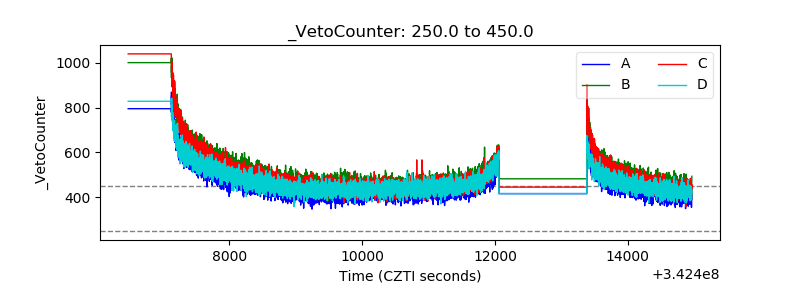 |