| Param | Original file | Final file |
|---|---|---|
| Filename | modeM0/AS1T03_257T01_9000003976_27636cztM0_level2.evt | modeM0/AS1T03_257T01_9000003976_27636cztM0_level2_quad_clean.evt |
| Size (bytes) | 1,019,796,480 | 133,637,760 |
| Size | 972.6 MB | 127.4 MB |
| Events in quadrant A | 5,528,256 | 845,239 |
| Events in quadrant B | 6,659,592 | 859,421 |
| Events in quadrant C | 5,751,734 | 813,394 |
| Events in quadrant D | 12,169,099 | 733,283 |
| Mode M9 | |||
|---|---|---|---|
| Quadrant | BADHDUFLAG | Total packets | Discarded packets |
| A | 0 | 14 | 0 |
| B | 0 | 14 | 0 |
| C | 0 | 14 | 0 |
| D | 0 | 14 | 0 |
| Mode M0 | |||
|---|---|---|---|
| Quadrant | BADHDUFLAG | Total packets | Discarded packets |
| A | 0 | 23661 | 0 |
| B | 0 | 26866 | 0 |
| C | 0 | 24247 | 0 |
| D | 0 | 44032 | 0 |
| Quadrant | Total seconds | Saturated seconds | Saturation percentage |
|---|---|---|---|
| A | 11493 | 131 | 1.139824% |
| B | 11494 | 412 | 3.584479% |
| C | 11494 | 226 | 1.966243% |
| D | 11494 | 1533 | 13.337393% |
Noise dominated data is calculated using 1-second bins in cleaned event files. If a bin has >2000 counts, and if more than 50% of those come from <1% of pixels, then it is considered to be noise-dominated and hence unusable.
| Quadrant | # 1 sec bins | Bins with >0 counts | Bins with >2000 counts | High rate bins dominated by noise | Noise dominated (total time) | Noise dominated (detector-on time) | Marked lightcurve |
|---|---|---|---|---|---|---|---|
| A | 12883 | 11494 | 1 | 1 | 0.01% | 0.01% | 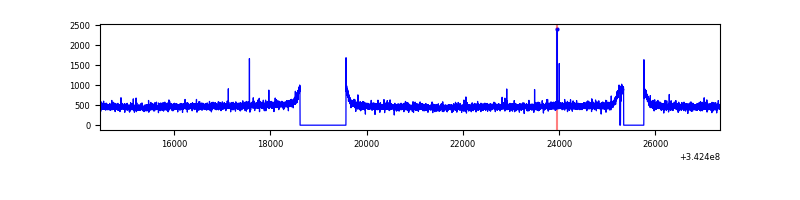 |
| B | 12884 | 11495 | 160 | 160 | 1.24% | 1.39% | 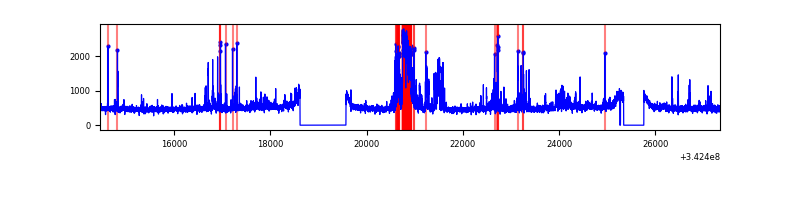 |
| C | 12884 | 11495 | 18 | 18 | 0.14% | 0.16% | 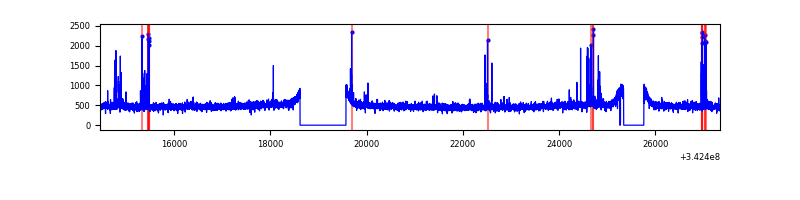 |
| D | 12884 | 11495 | 1440 | 1440 | 11.18% | 12.53% | 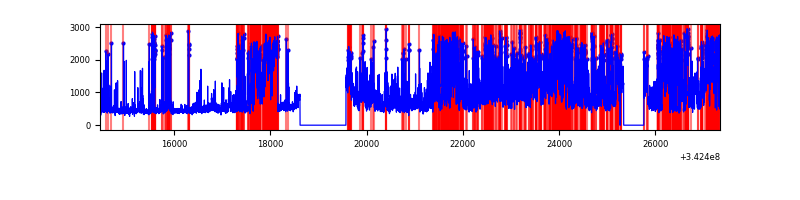 |
Top three noisy pixels from each quadrant. If the there are fewer than three noisy pixels in the level2.evt file, extra rows are filled as -1
| Pixel properties | Quadrant properties | ||||||
|---|---|---|---|---|---|---|---|
| Quadrant | DetID | PixID | Counts | Sigma | Mean | Median | Sigma |
| A | 13 | 254 | 19734 | 64.43 | 1426 | 1394 | 284.7 |
| A | 3 | 137 | 13574 | 42.79 | 1426 | 1394 | 284.7 |
| A | 11 | 84 | 12425 | 38.75 | 1426 | 1394 | 284.7 |
| B | 10 | 245 | 593380 | 2190.72 | 1411 | 1375 | 270.2 |
| B | 3 | 64 | 335845 | 1237.71 | 1411 | 1375 | 270.2 |
| B | 15 | 32 | 81384 | 296.07 | 1411 | 1375 | 270.2 |
| C | 14 | 238 | 220146 | 684.92 | 1363 | 1371 | 319.4 |
| C | 2 | 16 | 201886 | 627.75 | 1363 | 1371 | 319.4 |
| C | 3 | 233 | 12824 | 35.86 | 1363 | 1371 | 319.4 |
| D | 7 | 80 | 4123922 | 13225.25 | 1306 | 1272 | 311.7 |
| D | 1 | 52 | 2925710 | 9381.45 | 1306 | 1272 | 311.7 |
| D | 2 | 250 | 129409 | 411.06 | 1306 | 1272 | 311.7 |
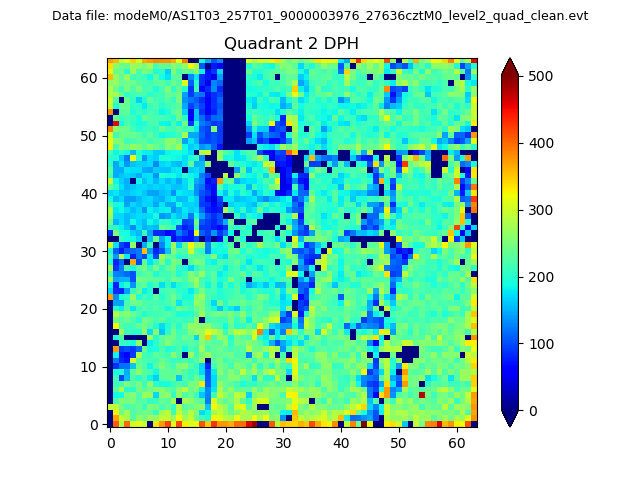
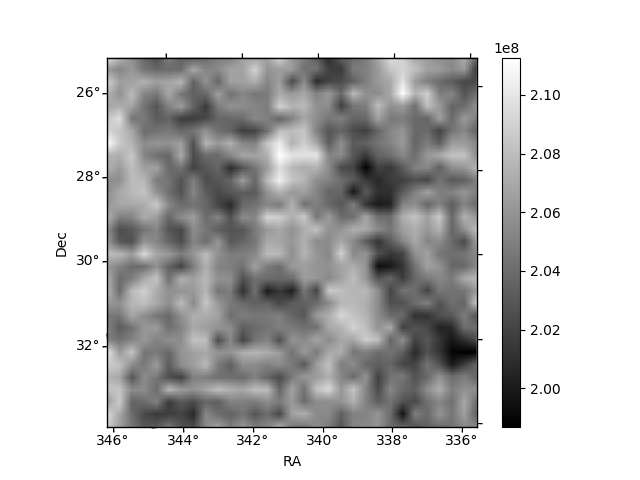
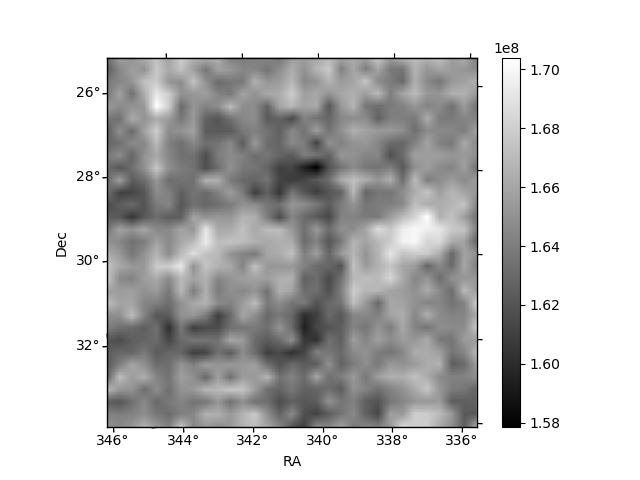
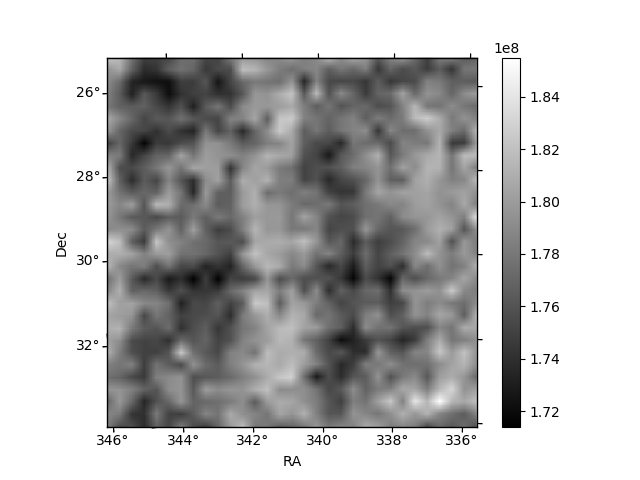
Histogram calculated using DETX and DETY for each event in the final _common_clean file
| Quadrant A | 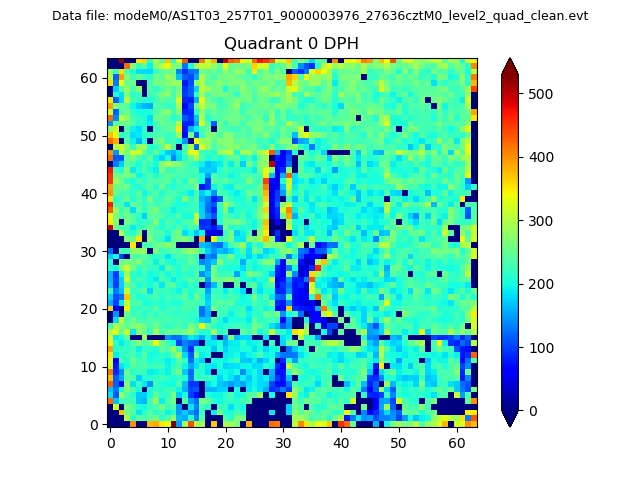 |
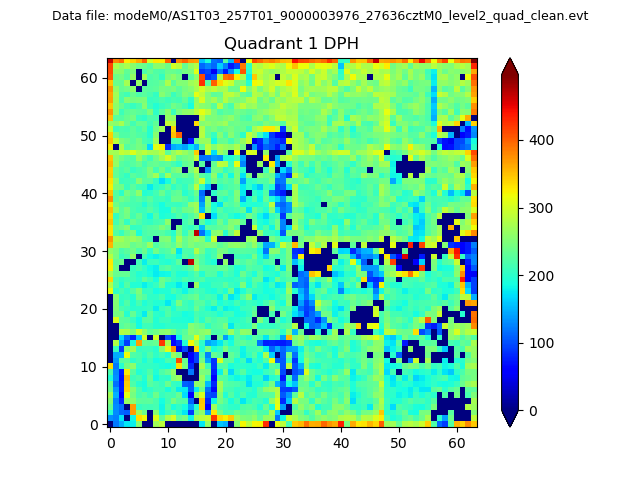 |
Quadrant B |
|---|---|---|---|
| Quadrant D | 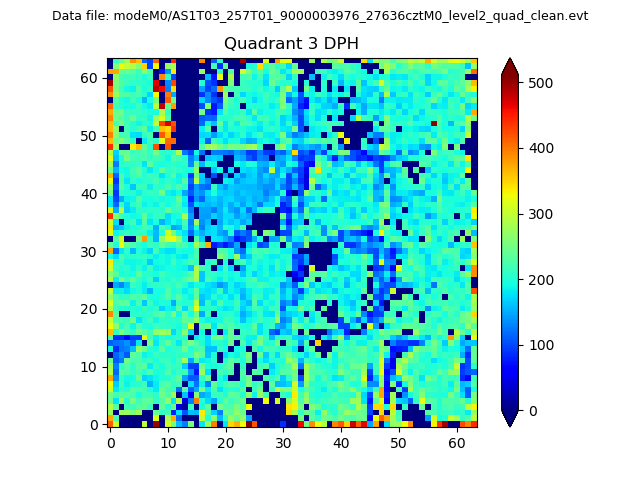 |
 |
Quadrant C |
| Plot type | Count rate plots | Images |
|---|---|---|
| Comparison with Poisson distribution Blue bars denote a histogram of data divided into 1 sec bins. Red curve is a Poisson curve with rate = median count rate of data. |
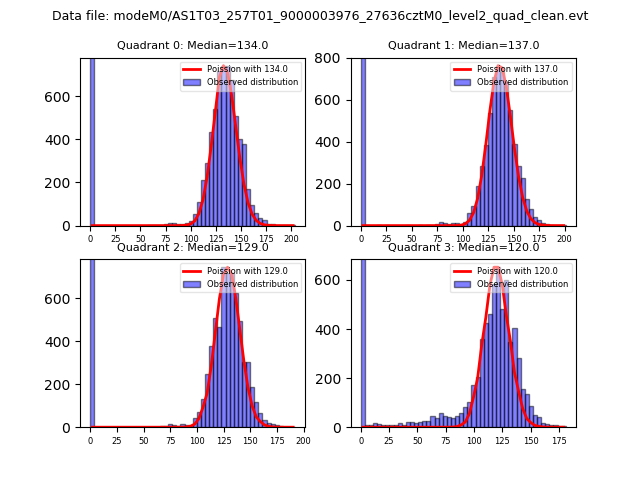 |
 |
| Quadrant-wise count rates Data is divided into 100 sec bins |
 |
|
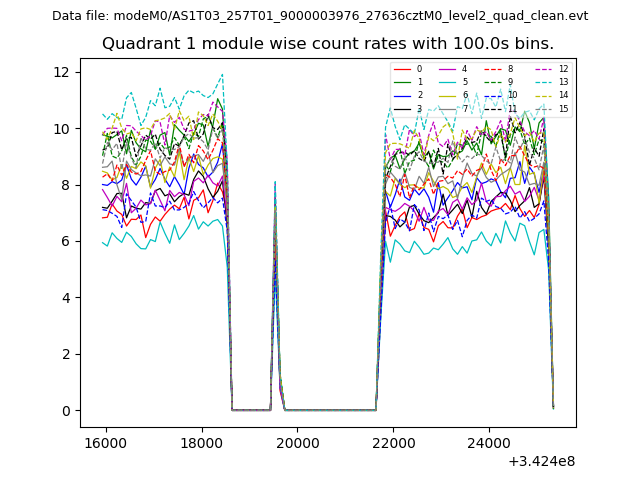
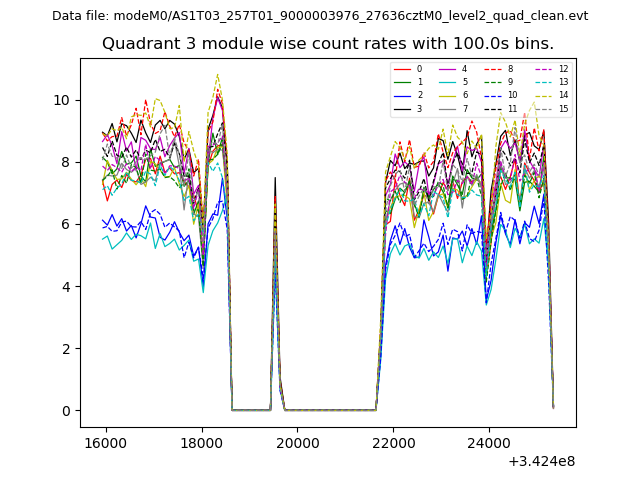
| Module-wise count rates for Quadrant A Data is divided into 100 sec bins |
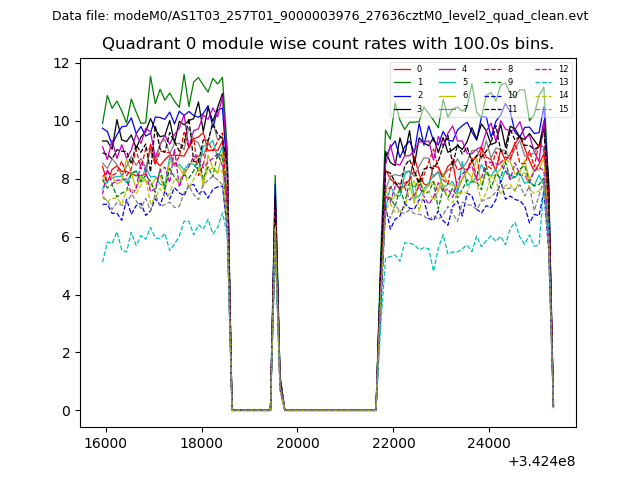 |
 |
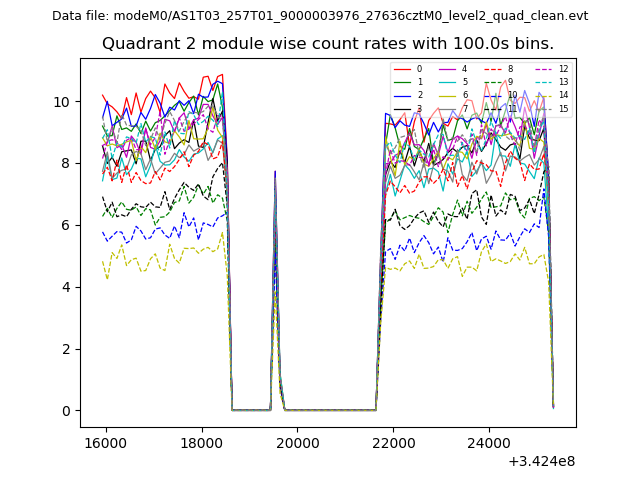
| Module-wise count rates for Quadrant B Data is divided into 100 sec bins |
 |
 |
| Module-wise count rates for Quadrant C Data is divided into 100 sec bins |
 |
 |
| Module-wise count rates for Quadrant D Data is divided into 100 sec bins |
 |
 |
| Parameter | Plot |
|---|---|
| CZT HV Monitor | 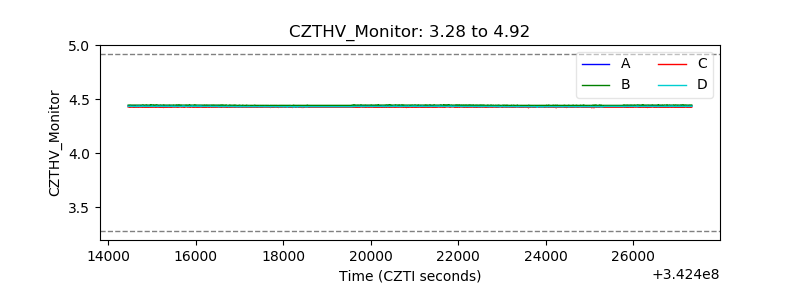 |
| D_VDD | 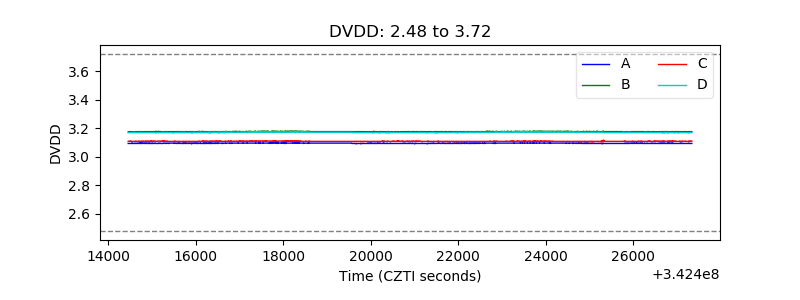 |
| Temperature 1 | 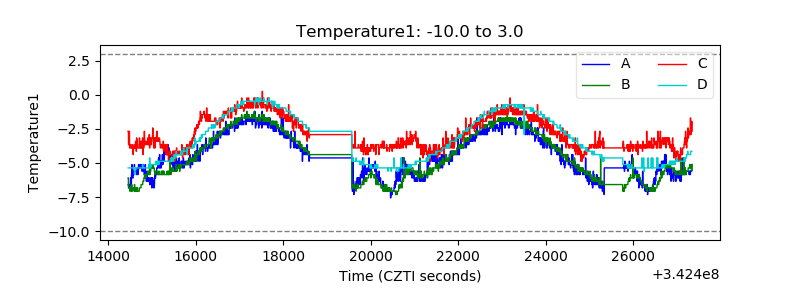 |
| Veto HV Monitor | 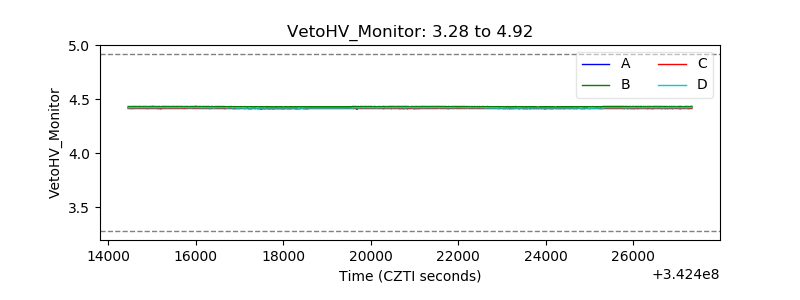 |
| Veto LLD | 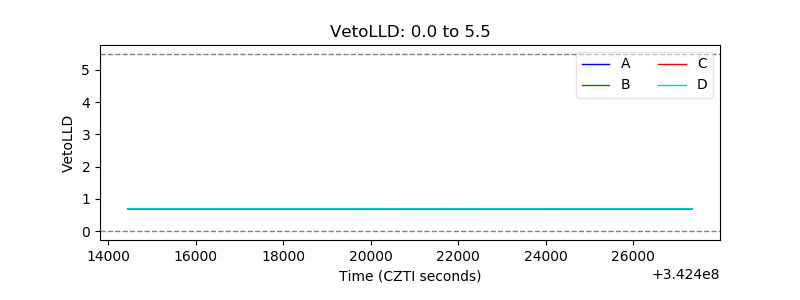 |
| Alpha Counter | 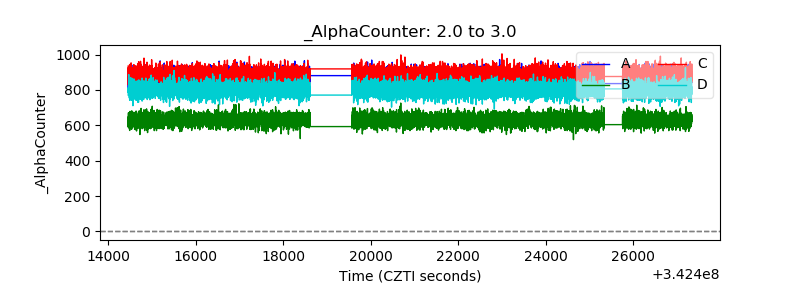 |
| _CPM_Rate | 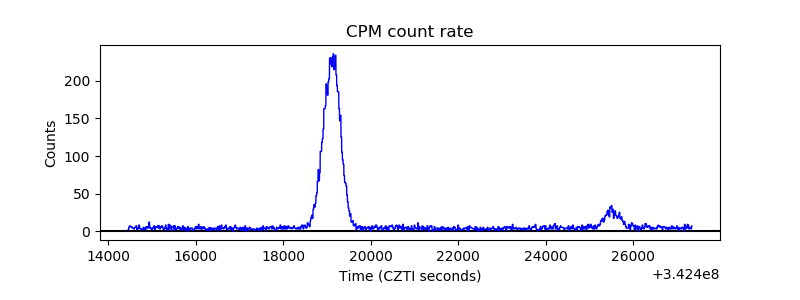 |
| CZT Counter | 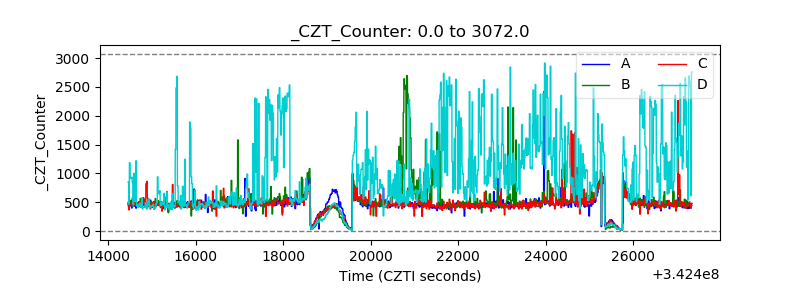 |
| +2.5 Volts monitor | 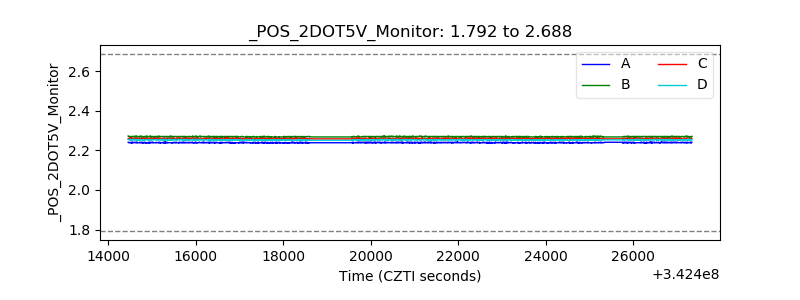 |
| +5 Volts monitor |  |
| _ROLL_ROT | 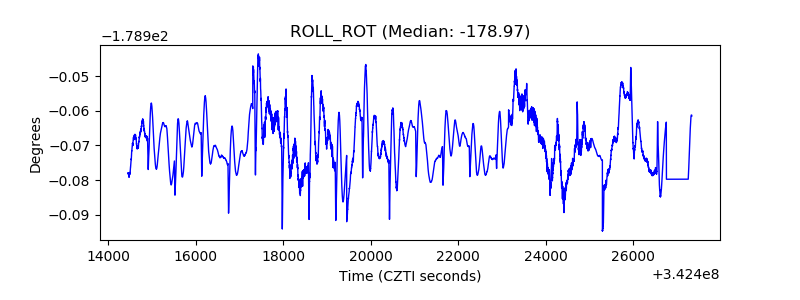 |
| _Roll_DEC | 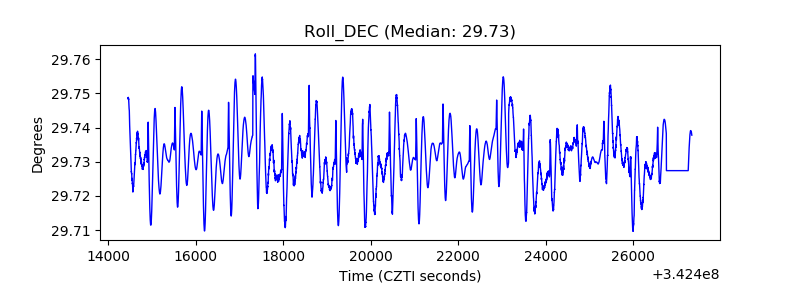 |
| _Roll_RA | 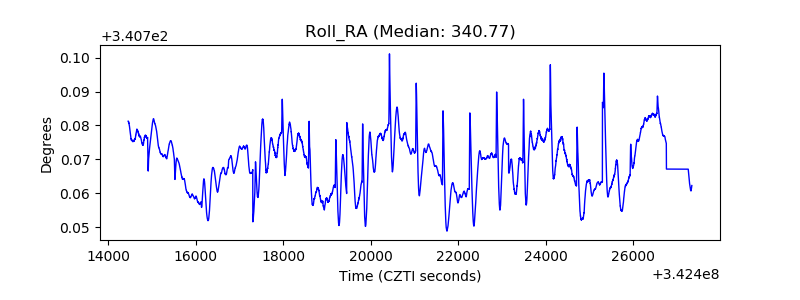 |
| Veto Counter | 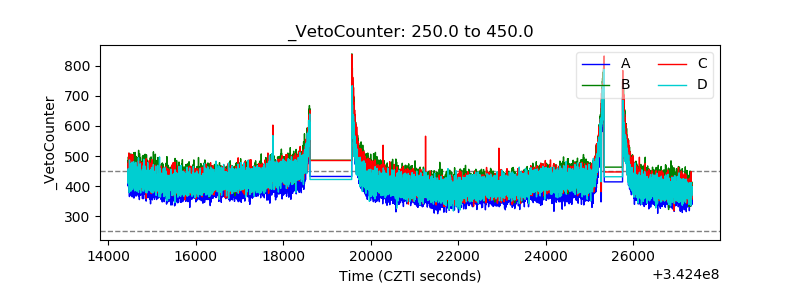 |