| Param | Original file | Final file |
|---|---|---|
| Filename | modeM0/AS1T03_257T01_9000003976_27637cztM0_level2.evt | modeM0/AS1T03_257T01_9000003976_27637cztM0_level2_quad_clean.evt |
| Size (bytes) | 830,669,760 | 87,724,800 |
| Size | 792.2 MB | 83.7 MB |
| Events in quadrant A | 4,080,097 | 553,376 |
| Events in quadrant B | 4,385,910 | 561,030 |
| Events in quadrant C | 4,318,290 | 535,287 |
| Events in quadrant D | 11,808,269 | 426,544 |
| Mode M9 | |||
|---|---|---|---|
| Quadrant | BADHDUFLAG | Total packets | Discarded packets |
| A | 0 | 5 | 0 |
| B | 0 | 5 | 0 |
| C | 0 | 5 | 0 |
| D | 0 | 5 | 0 |
| Mode M0 | |||
|---|---|---|---|
| Quadrant | BADHDUFLAG | Total packets | Discarded packets |
| A | 0 | 17539 | 0 |
| B | 0 | 18185 | 0 |
| C | 0 | 18114 | 0 |
| D | 0 | 40884 | 0 |
| Quadrant | Total seconds | Saturated seconds | Saturation percentage |
|---|---|---|---|
| A | 8342 | 338 | 4.051786% |
| B | 8343 | 434 | 5.201966% |
| C | 8342 | 440 | 5.274515% |
| D | 8342 | 2678 | 32.102613% |
Noise dominated data is calculated using 1-second bins in cleaned event files. If a bin has >2000 counts, and if more than 50% of those come from <1% of pixels, then it is considered to be noise-dominated and hence unusable.
| Quadrant | # 1 sec bins | Bins with >0 counts | Bins with >2000 counts | High rate bins dominated by noise | Noise dominated (total time) | Noise dominated (detector-on time) | Marked lightcurve |
|---|---|---|---|---|---|---|---|
| A | 8777 | 8343 | 0 | 0 | 0.00% | 0.00% | 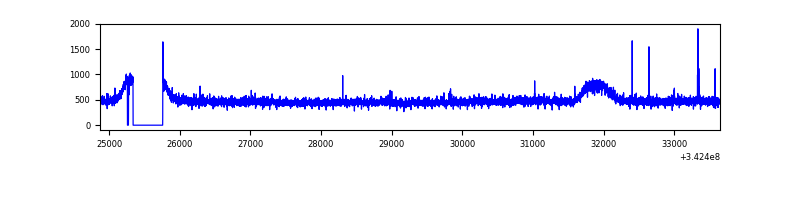 |
| B | 8777 | 8342 | 11 | 11 | 0.13% | 0.13% | 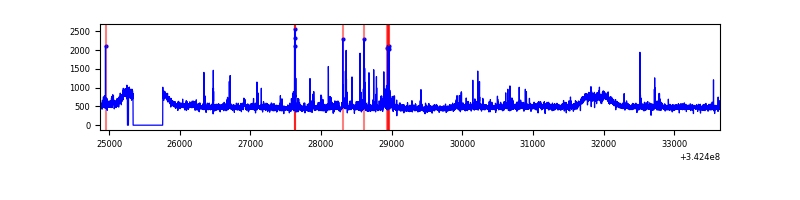 |
| C | 8776 | 8342 | 34 | 34 | 0.39% | 0.41% | 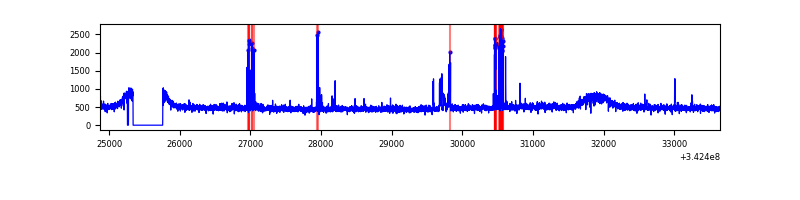 |
| D | 8777 | 8343 | 2414 | 2414 | 27.50% | 28.93% | 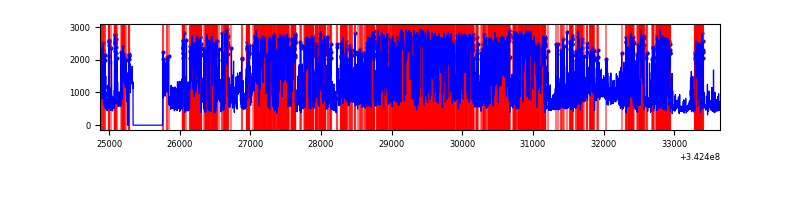 |
Top three noisy pixels from each quadrant. If the there are fewer than three noisy pixels in the level2.evt file, extra rows are filled as -1
| Pixel properties | Quadrant properties | ||||||
|---|---|---|---|---|---|---|---|
| Quadrant | DetID | PixID | Counts | Sigma | Mean | Median | Sigma |
| A | 13 | 254 | 13489 | 58.34 | 1049 | 1023 | 213.7 |
| A | 15 | 174 | 12539 | 53.89 | 1049 | 1023 | 213.7 |
| A | 3 | 137 | 10532 | 44.5 | 1049 | 1023 | 213.7 |
| B | 10 | 245 | 115484 | 559.88 | 1045 | 1015 | 204.5 |
| B | 0 | 230 | 37176 | 176.87 | 1045 | 1015 | 204.5 |
| B | 0 | 190 | 36046 | 171.34 | 1045 | 1015 | 204.5 |
| C | 14 | 238 | 160546 | 665.34 | 1009 | 1013 | 239.8 |
| C | 2 | 16 | 159900 | 662.64 | 1009 | 1013 | 239.8 |
| C | 15 | 208 | 55746 | 228.27 | 1009 | 1013 | 239.8 |
| D | 1 | 52 | 6138773 | 28362.17 | 901 | 873 | 216.4 |
| D | 7 | 80 | 1829814 | 8451.22 | 901 | 873 | 216.4 |
| D | 2 | 250 | 295668 | 1362.2 | 901 | 873 | 216.4 |
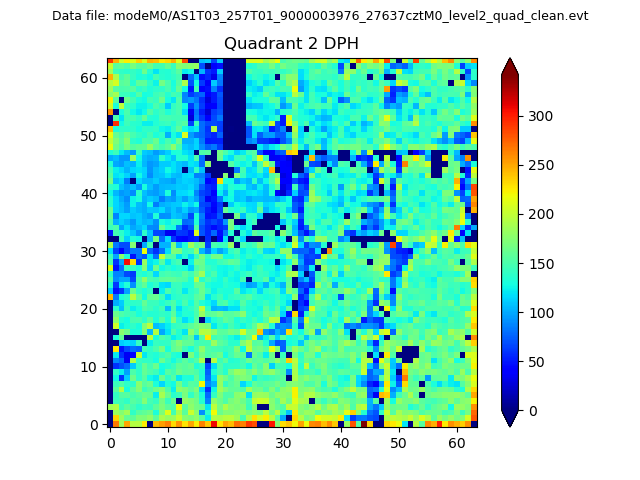
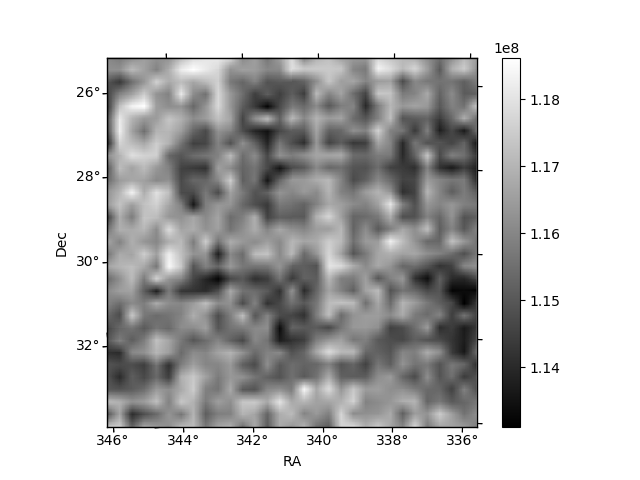
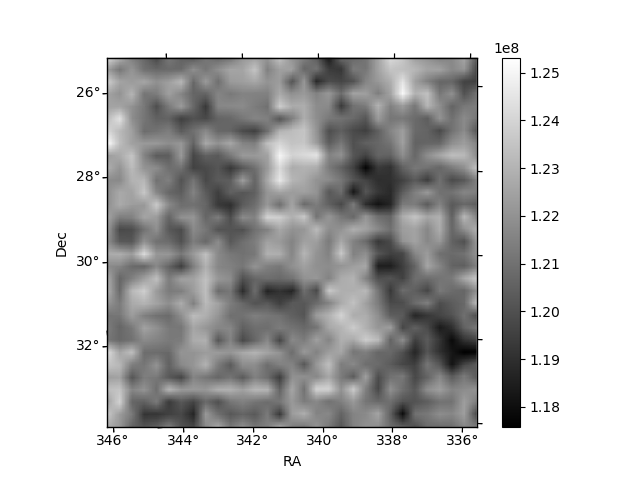
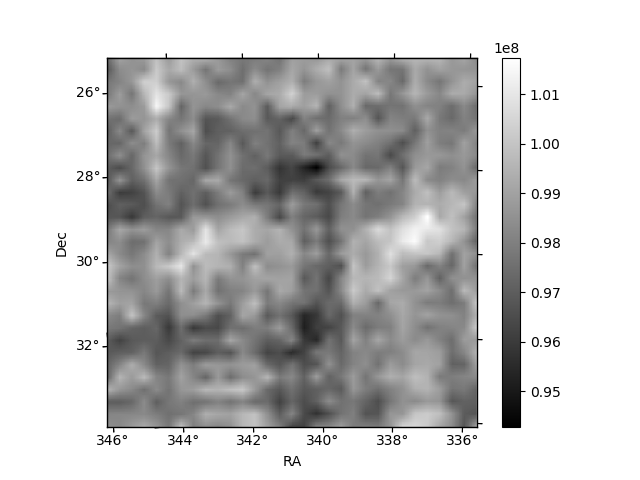
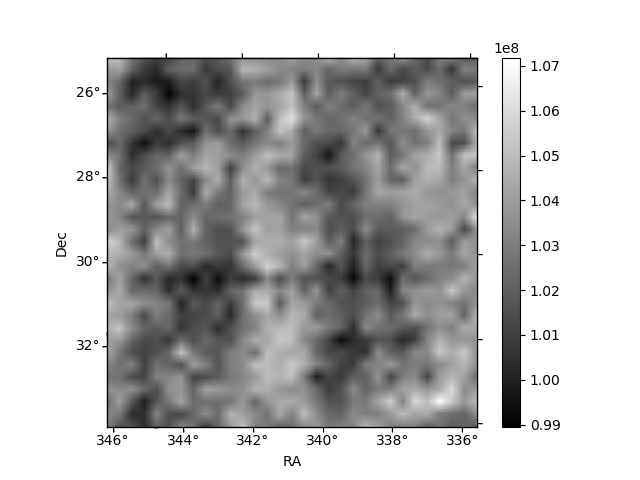
Histogram calculated using DETX and DETY for each event in the final _common_clean file
| Quadrant A | 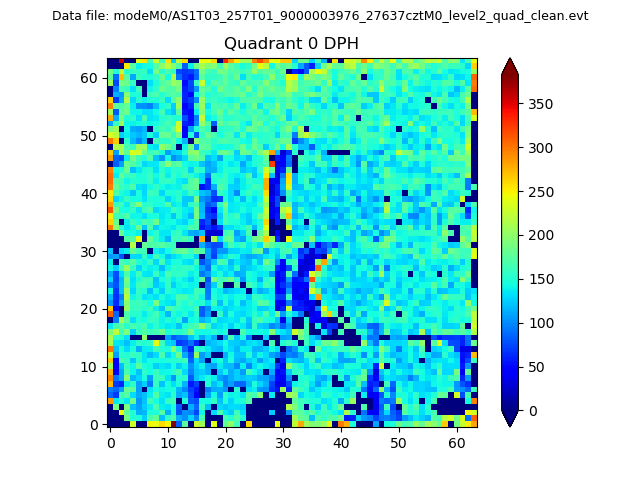 |
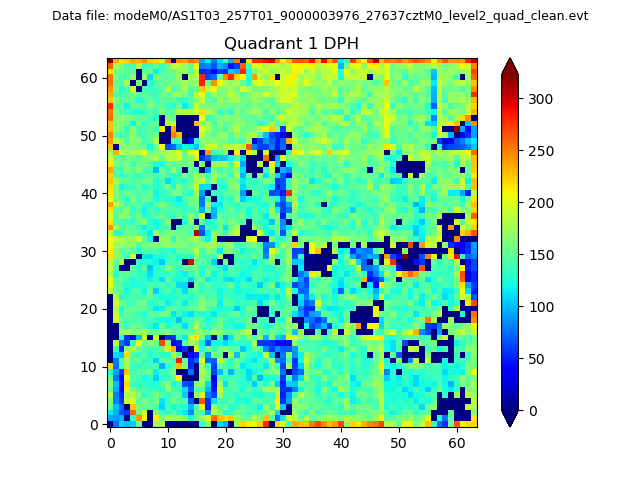 |
Quadrant B |
|---|---|---|---|
| Quadrant D | 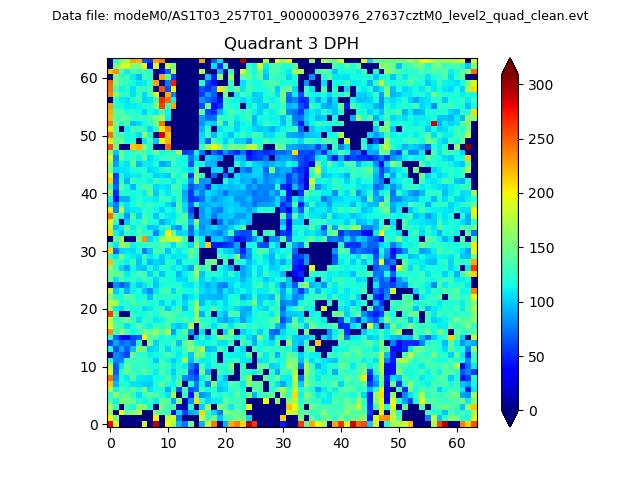 |
 |
Quadrant C |
| Plot type | Count rate plots | Images |
|---|---|---|
| Comparison with Poisson distribution Blue bars denote a histogram of data divided into 1 sec bins. Red curve is a Poisson curve with rate = median count rate of data. |
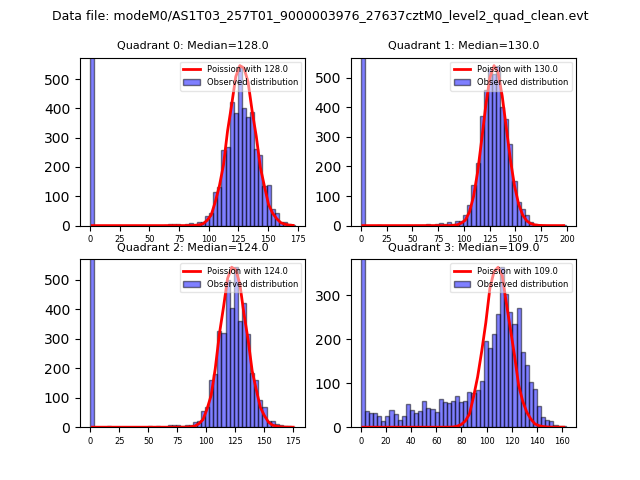 |
 |
| Quadrant-wise count rates Data is divided into 100 sec bins |
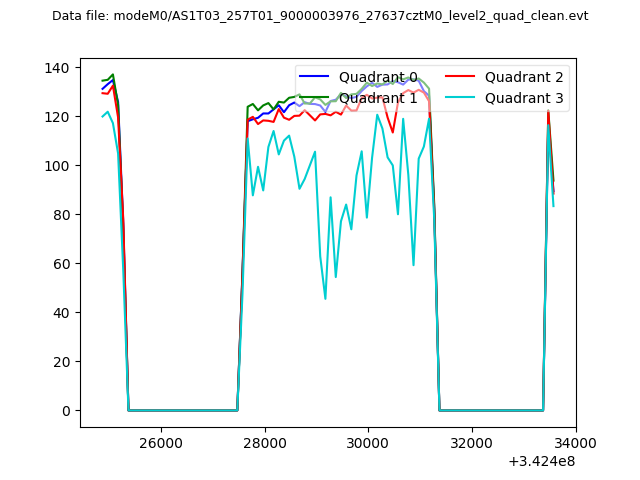 |
|
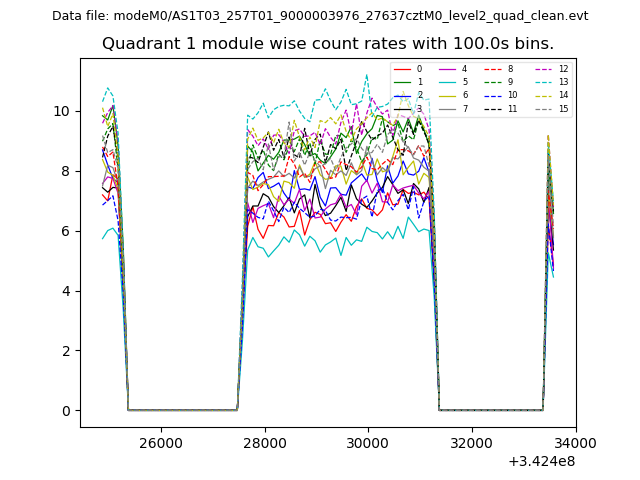
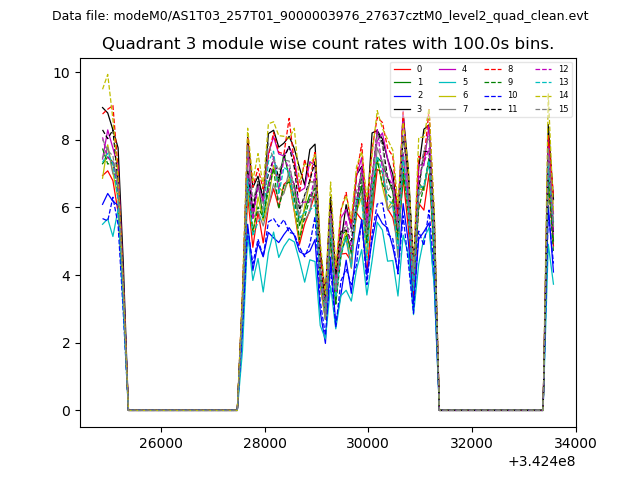
| Module-wise count rates for Quadrant A Data is divided into 100 sec bins |
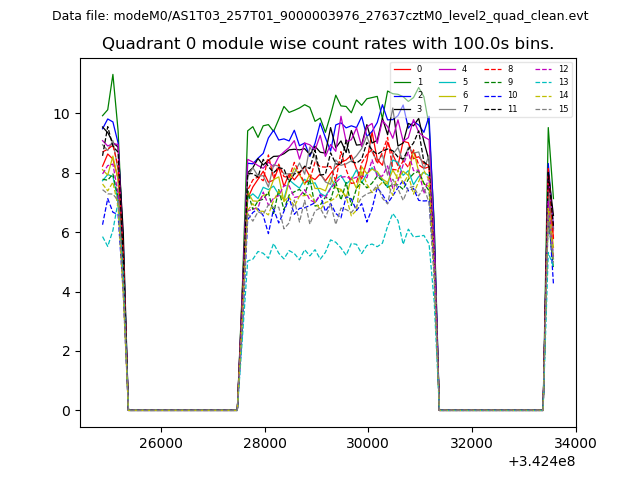 |
 |
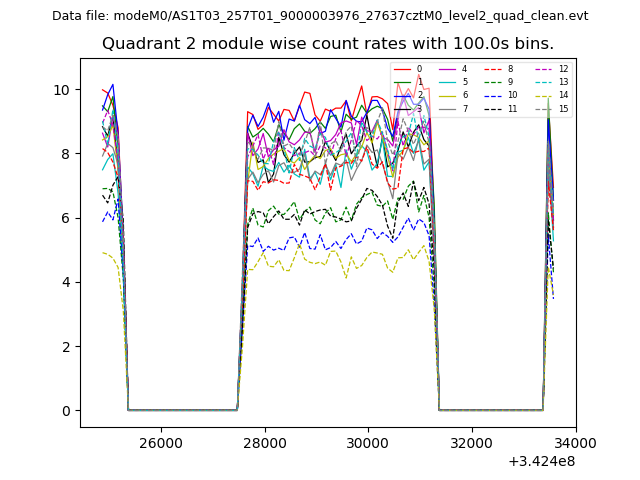
| Module-wise count rates for Quadrant B Data is divided into 100 sec bins |
 |
 |
| Module-wise count rates for Quadrant C Data is divided into 100 sec bins |
 |
 |
| Module-wise count rates for Quadrant D Data is divided into 100 sec bins |
 |
 |
| Parameter | Plot |
|---|---|
| CZT HV Monitor | 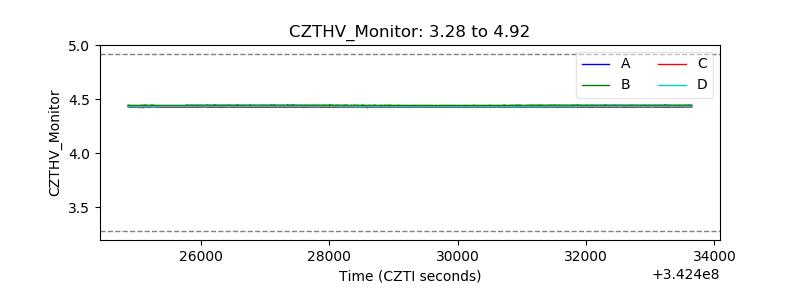 |
| D_VDD | 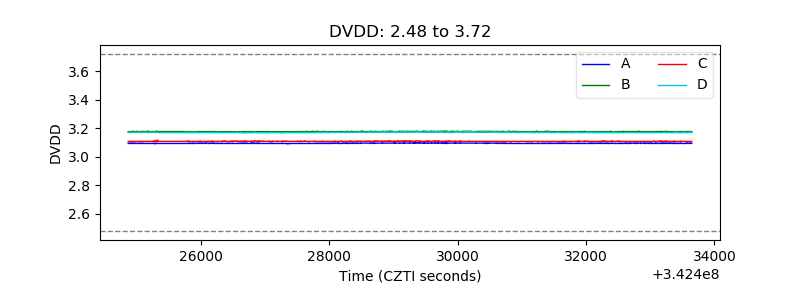 |
| Temperature 1 | 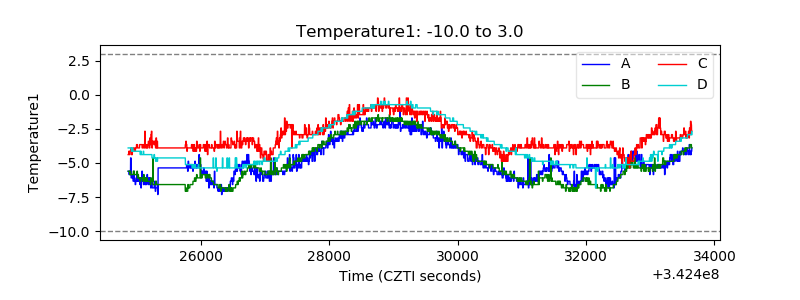 |
| Veto HV Monitor | 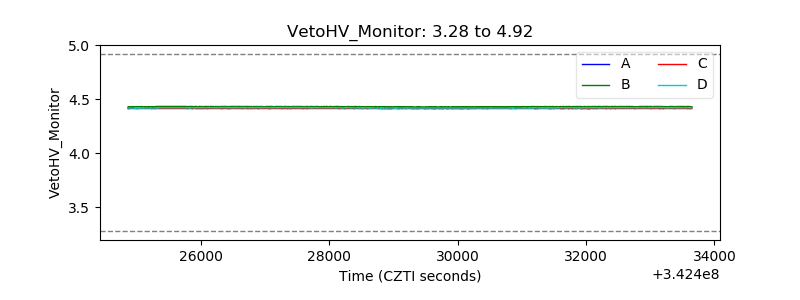 |
| Veto LLD | 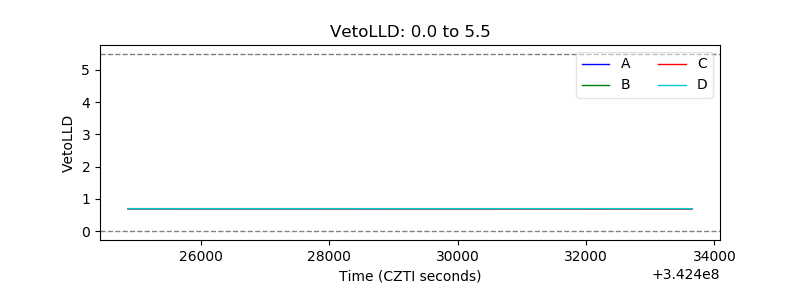 |
| Alpha Counter | 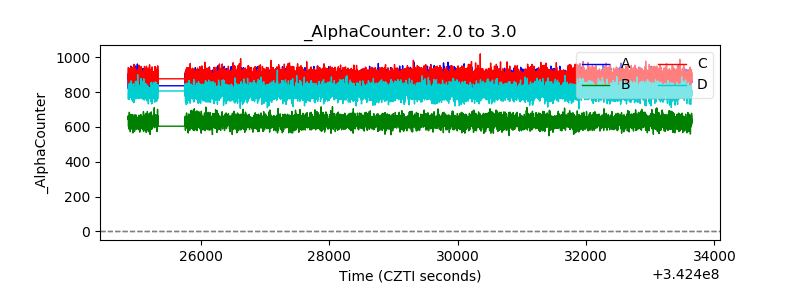 |
| _CPM_Rate | 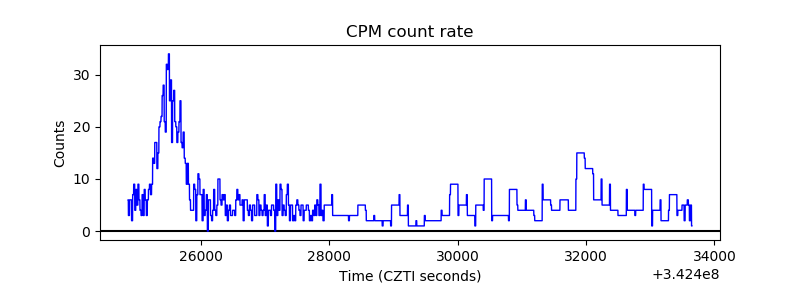 |
| CZT Counter | 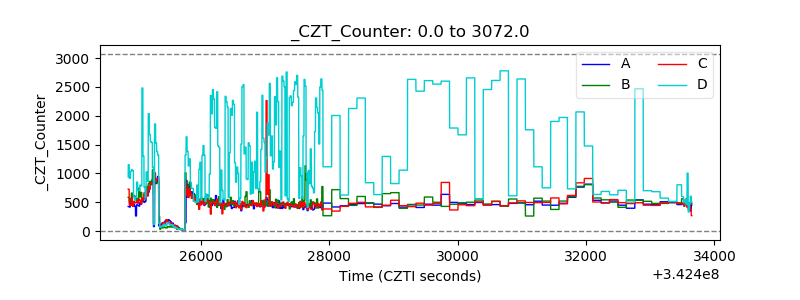 |
| +2.5 Volts monitor | 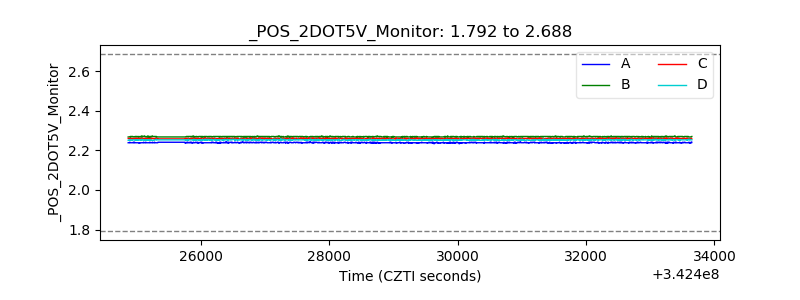 |
| +5 Volts monitor | 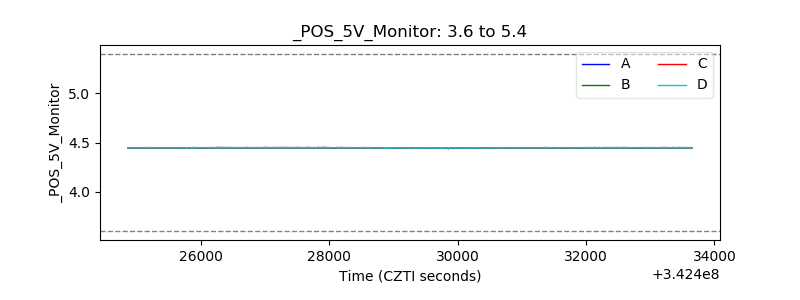 |
| _ROLL_ROT | 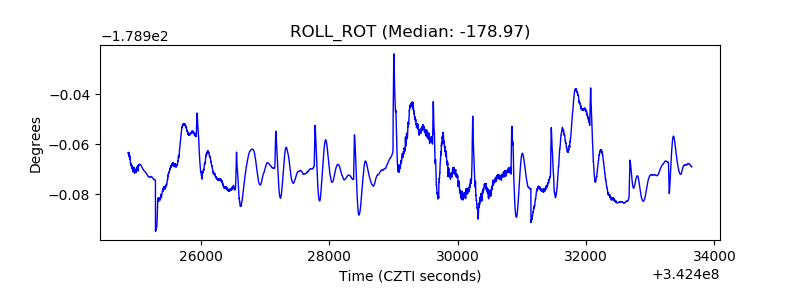 |
| _Roll_DEC |  |
| _Roll_RA | 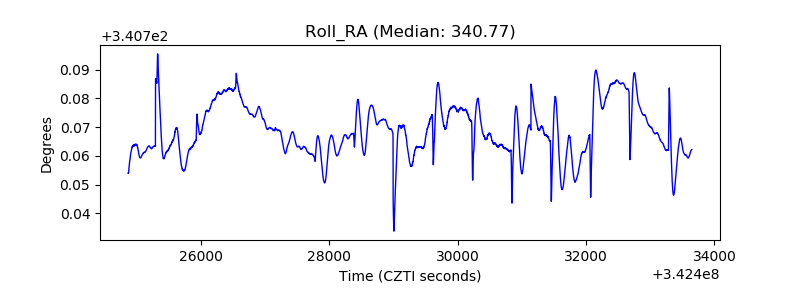 |
| Veto Counter | 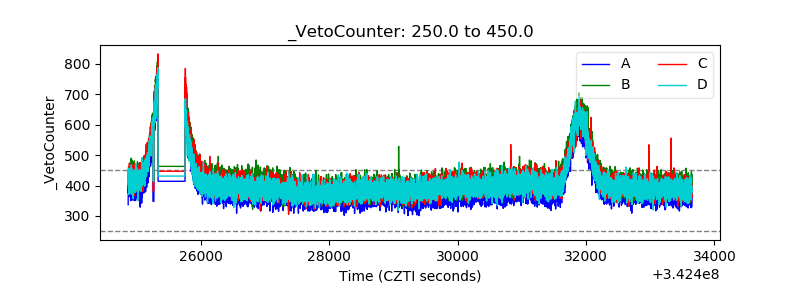 |