| Param | Original file | Final file |
|---|---|---|
| Filename | modeM0/AS1T03_257T01_9000003976_27638cztM0_level2.evt | modeM0/AS1T03_257T01_9000003976_27638cztM0_level2_quad_clean.evt |
| Size (bytes) | 546,416,640 | 88,297,920 |
| Size | 521.1 MB | 84.2 MB |
| Events in quadrant A | 3,487,366 | 551,404 |
| Events in quadrant B | 3,639,940 | 559,529 |
| Events in quadrant C | 3,570,013 | 535,297 |
| Events in quadrant D | 5,352,757 | 516,689 |
| Mode M9 | |||
|---|---|---|---|
| Quadrant | BADHDUFLAG | Total packets | Discarded packets |
| A | 0 | 1 | 0 |
| B | 0 | 1 | 0 |
| C | 0 | 1 | 0 |
| D | 0 | 1 | 0 |
| Mode M0 | |||
|---|---|---|---|
| Quadrant | BADHDUFLAG | Total packets | Discarded packets |
| A | 0 | 15136 | 0 |
| B | 0 | 15395 | 0 |
| C | 0 | 15346 | 0 |
| D | 0 | 20853 | 0 |
| Quadrant | Total seconds | Saturated seconds | Saturation percentage |
|---|---|---|---|
| A | 7334 | 178 | 2.427052% |
| B | 7335 | 213 | 2.903885% |
| C | 7335 | 234 | 3.190184% |
| D | 7335 | 449 | 6.121336% |
Noise dominated data is calculated using 1-second bins in cleaned event files. If a bin has >2000 counts, and if more than 50% of those come from <1% of pixels, then it is considered to be noise-dominated and hence unusable.
| Quadrant | # 1 sec bins | Bins with >0 counts | Bins with >2000 counts | High rate bins dominated by noise | Noise dominated (total time) | Noise dominated (detector-on time) | Marked lightcurve |
|---|---|---|---|---|---|---|---|
| A | 7480 | 7335 | 2 | 2 | 0.03% | 0.03% | 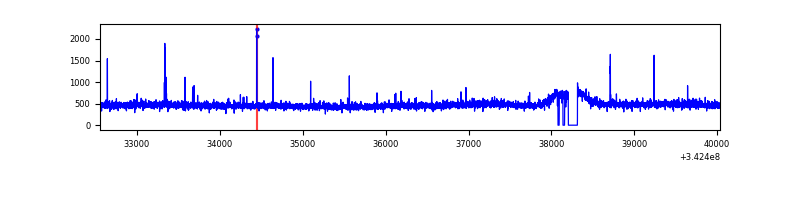 |
| B | 7481 | 7336 | 6 | 6 | 0.08% | 0.08% | 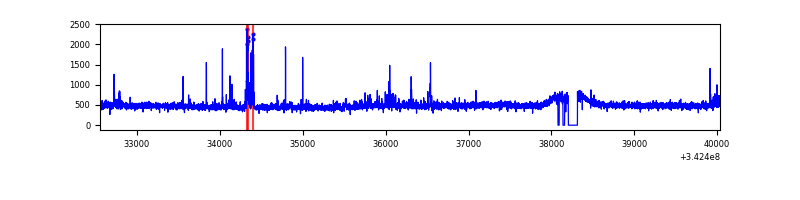 |
| C | 7480 | 7335 | 11 | 11 | 0.15% | 0.15% | 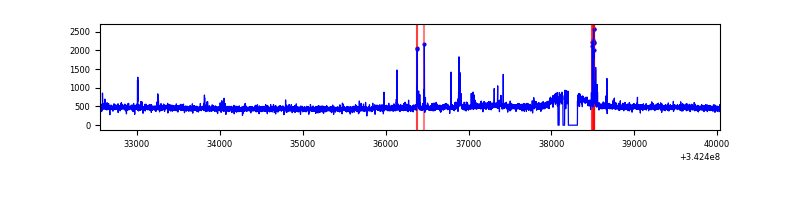 |
| D | 7481 | 7336 | 301 | 301 | 4.02% | 4.10% | 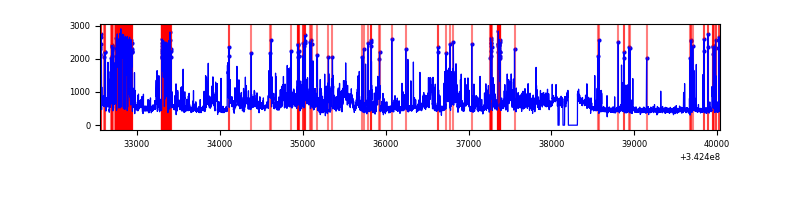 |
Top three noisy pixels from each quadrant. If the there are fewer than three noisy pixels in the level2.evt file, extra rows are filled as -1
| Pixel properties | Quadrant properties | ||||||
|---|---|---|---|---|---|---|---|
| Quadrant | DetID | PixID | Counts | Sigma | Mean | Median | Sigma |
| A | 6 | 16 | 20719 | 109.67 | 890 | 869 | 181.0 |
| A | 15 | 174 | 18145 | 95.45 | 890 | 869 | 181.0 |
| A | 11 | 84 | 12969 | 66.85 | 890 | 869 | 181.0 |
| B | 10 | 245 | 67520 | 388.6 | 884 | 860 | 171.5 |
| B | 0 | 190 | 31217 | 176.97 | 884 | 860 | 171.5 |
| B | 12 | 111 | 21540 | 120.56 | 884 | 860 | 171.5 |
| C | 14 | 238 | 136074 | 669.5 | 853 | 857 | 202.0 |
| C | 2 | 16 | 97032 | 476.19 | 853 | 857 | 202.0 |
| C | 3 | 233 | 8458 | 37.63 | 853 | 857 | 202.0 |
| D | 1 | 52 | 1371684 | 6667.54 | 851 | 829 | 205.6 |
| D | 7 | 80 | 581241 | 2823.0 | 851 | 829 | 205.6 |
| D | 2 | 250 | 102123 | 492.67 | 851 | 829 | 205.6 |
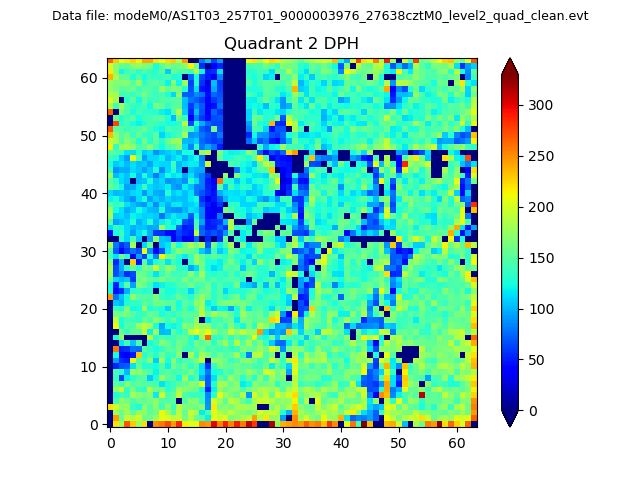
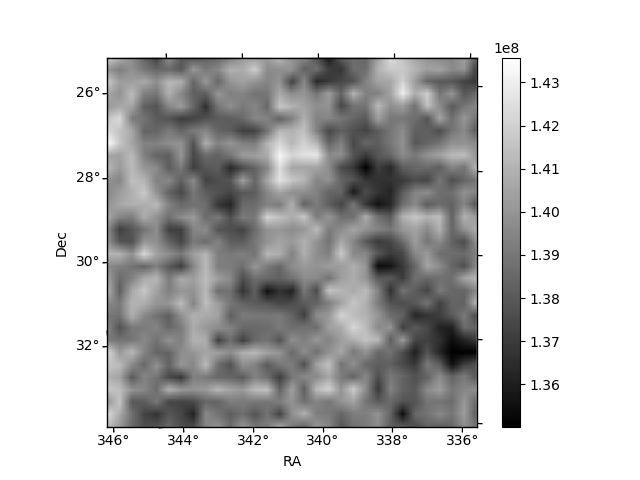
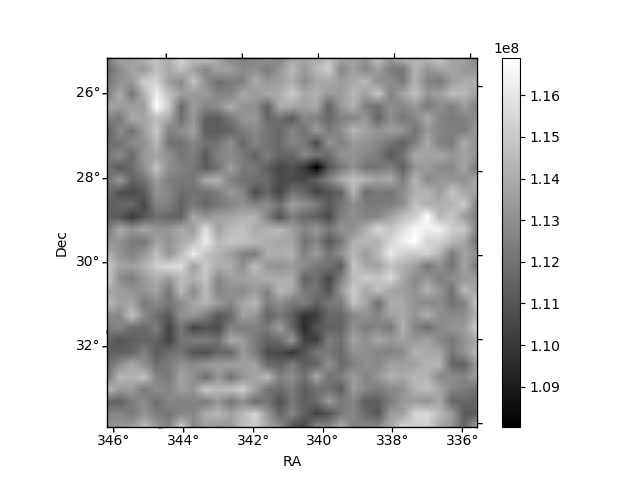
Histogram calculated using DETX and DETY for each event in the final _common_clean file
| Quadrant A | 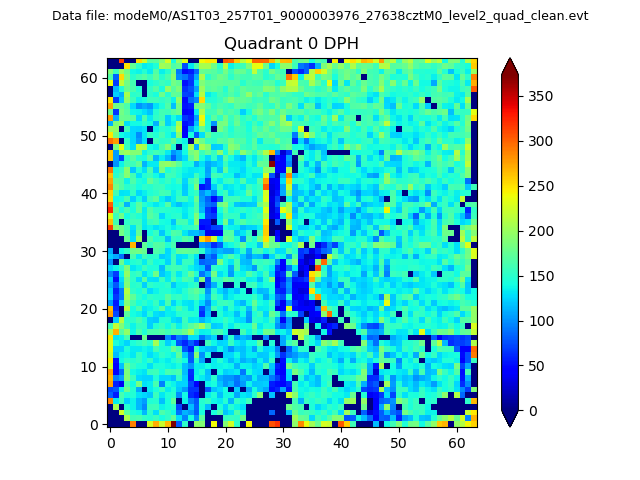 |
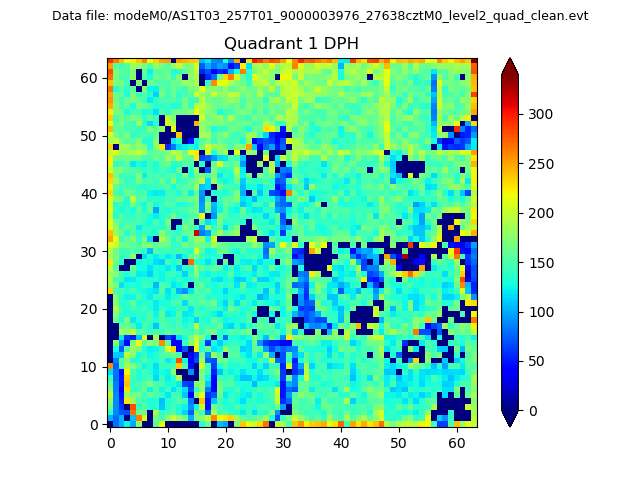 |
Quadrant B |
|---|---|---|---|
| Quadrant D | 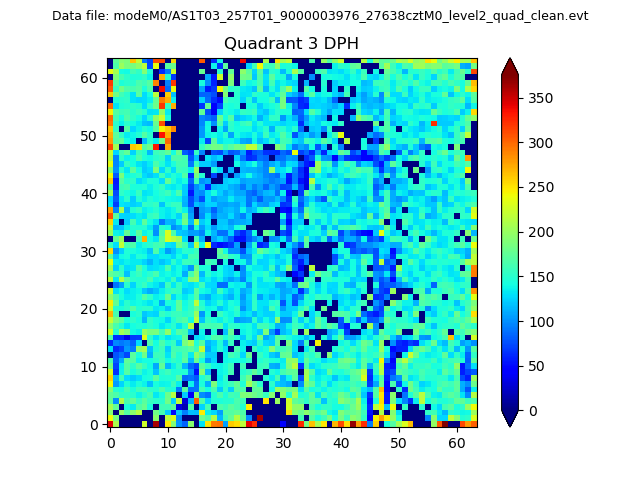 |
 |
Quadrant C |
| Plot type | Count rate plots | Images |
|---|---|---|
| Comparison with Poisson distribution Blue bars denote a histogram of data divided into 1 sec bins. Red curve is a Poisson curve with rate = median count rate of data. |
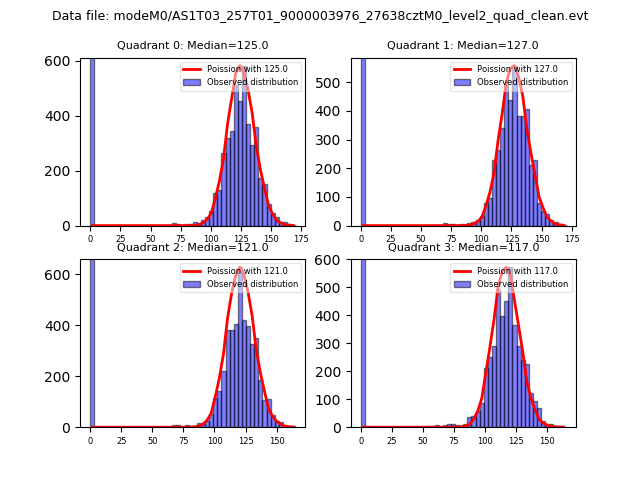 |
 |
| Quadrant-wise count rates Data is divided into 100 sec bins |
 |
|
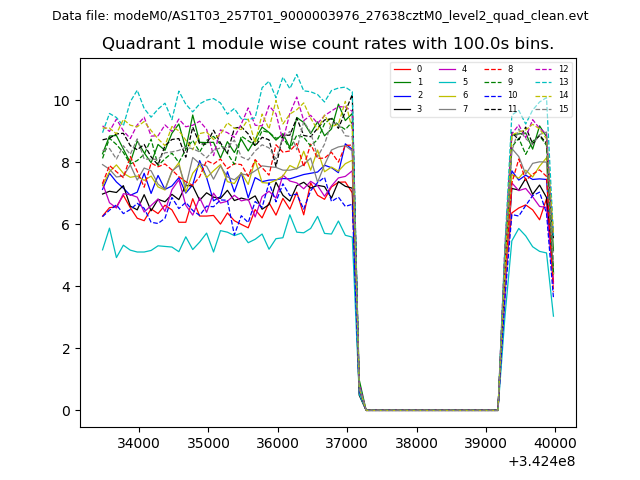
| Module-wise count rates for Quadrant A Data is divided into 100 sec bins |
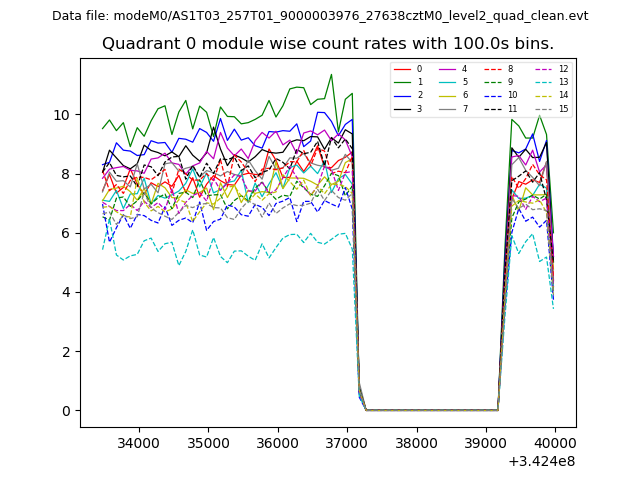 |
 |
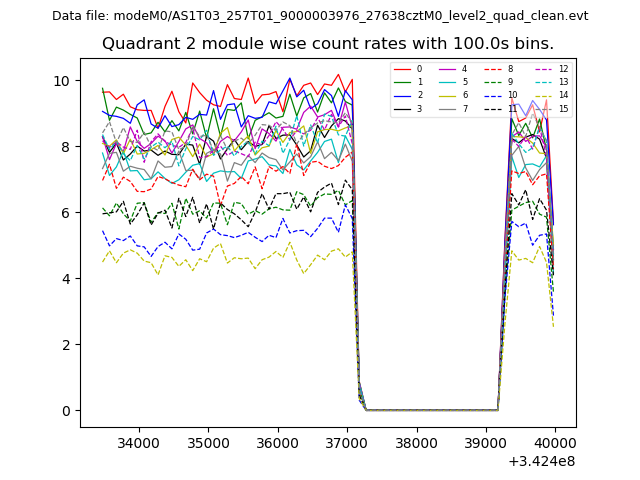
| Module-wise count rates for Quadrant B Data is divided into 100 sec bins |
 |
 |
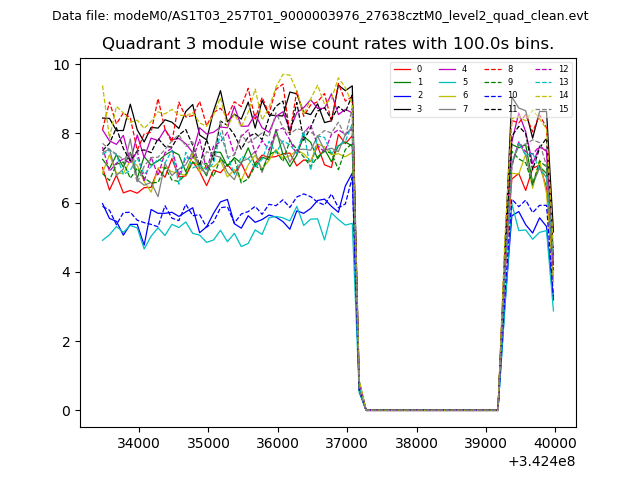
| Module-wise count rates for Quadrant C Data is divided into 100 sec bins |
 |
 |
| Module-wise count rates for Quadrant D Data is divided into 100 sec bins |
 |
 |
| Parameter | Plot |
|---|---|
| CZT HV Monitor | 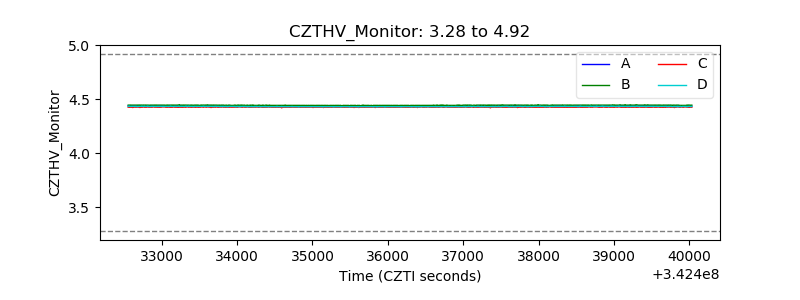 |
| D_VDD | 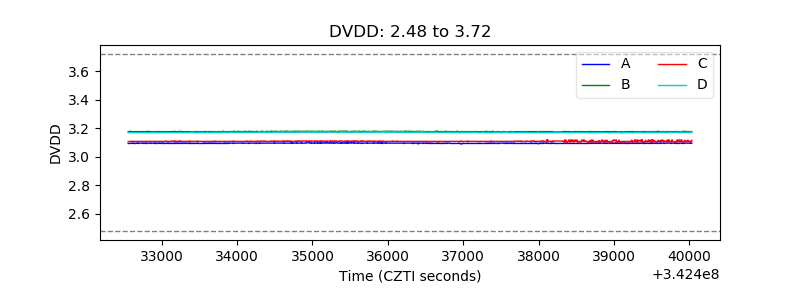 |
| Temperature 1 | 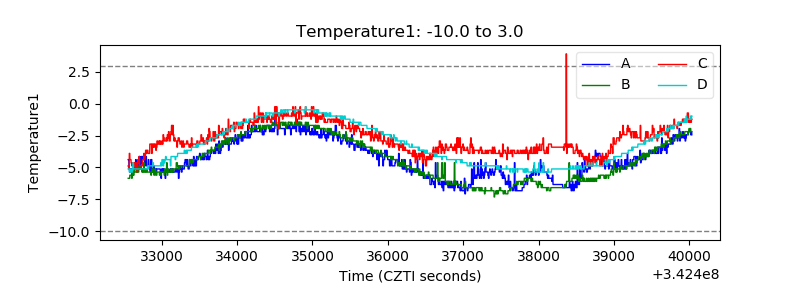 |
| Veto HV Monitor | 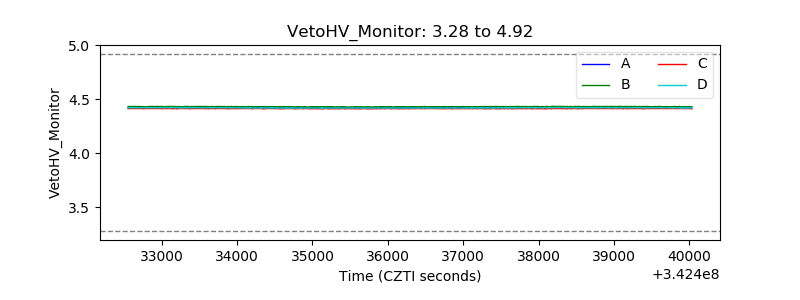 |
| Veto LLD | 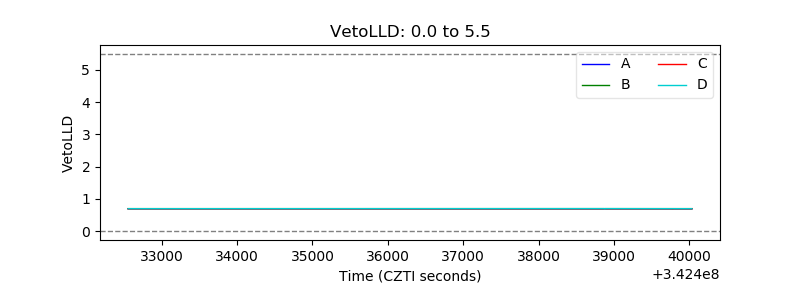 |
| Alpha Counter | 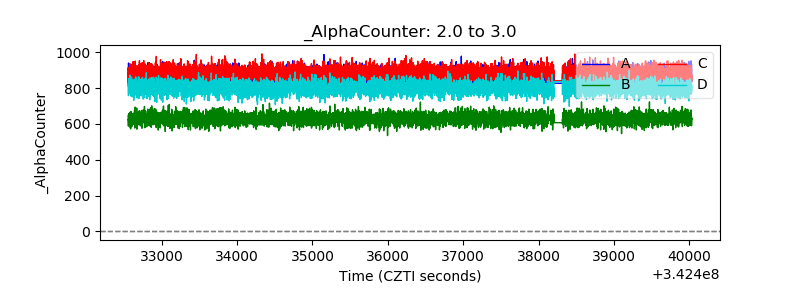 |
| _CPM_Rate | 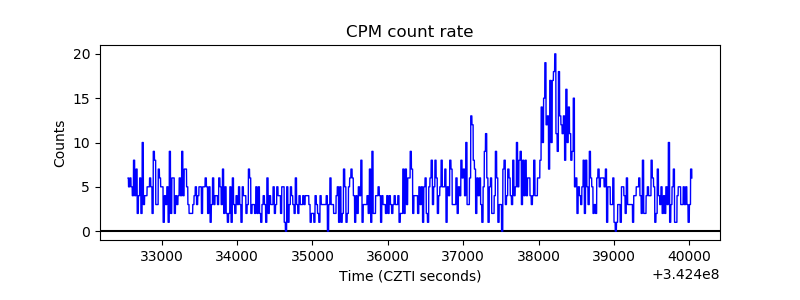 |
| CZT Counter | 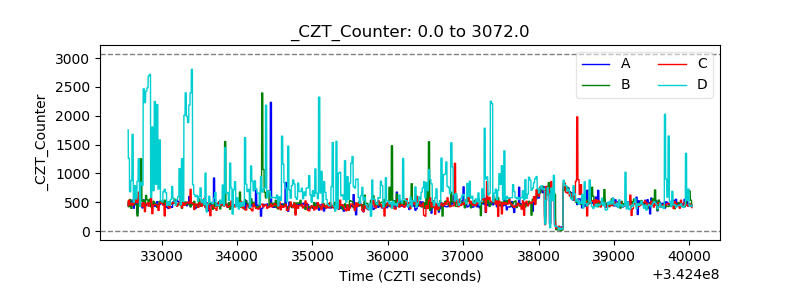 |
| +2.5 Volts monitor |  |
| +5 Volts monitor |  |
| _ROLL_ROT | 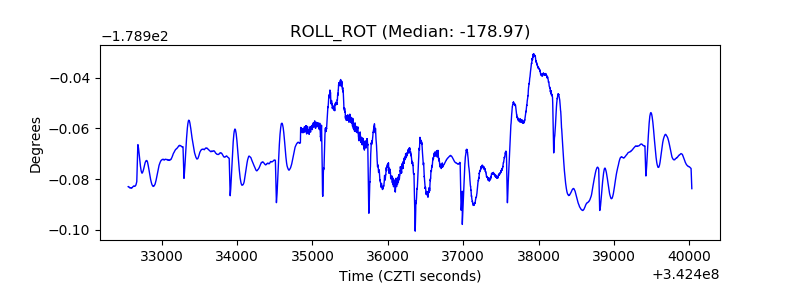 |
| _Roll_DEC | 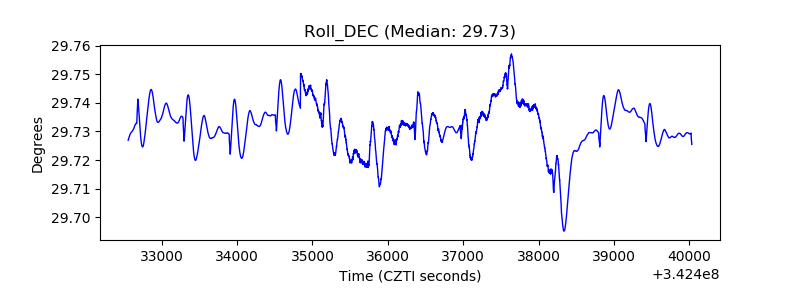 |
| _Roll_RA | 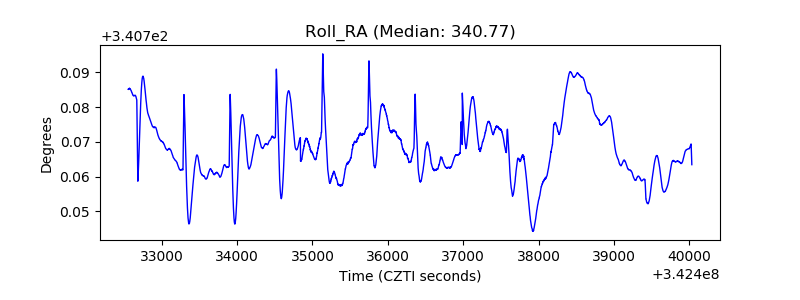 |
| Veto Counter | 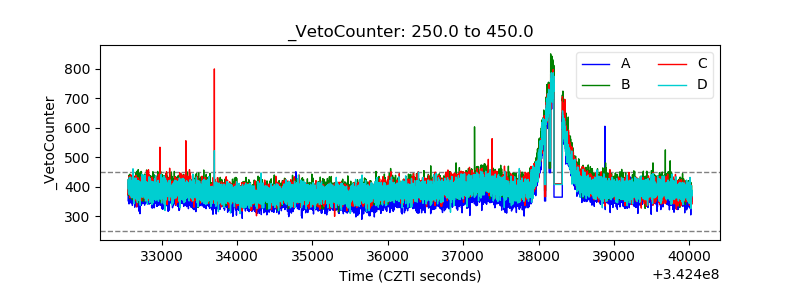 |