| Param | Original file | Final file |
|---|---|---|
| Filename | modeM0/AS1T03_257T01_9000003976_27641cztM0_level2.evt | modeM0/AS1T03_257T01_9000003976_27641cztM0_level2_quad_clean.evt |
| Size (bytes) | 1,355,592,960 | 242,611,200 |
| Size | 1.3 GB | 231.4 MB |
| Events in quadrant A | 8,229,190 | 1,579,035 |
| Events in quadrant B | 8,552,229 | 1,604,283 |
| Events in quadrant C | 8,413,657 | 1,528,248 |
| Events in quadrant D | 14,667,276 | 1,420,156 |
| Mode M9 | |||
|---|---|---|---|
| Quadrant | BADHDUFLAG | Total packets | Discarded packets |
| A | 0 | 19 | 0 |
| B | 0 | 19 | 0 |
| C | 0 | 19 | 0 |
| D | 0 | 19 | 0 |
| Mode M0 | |||
|---|---|---|---|
| Quadrant | BADHDUFLAG | Total packets | Discarded packets |
| A | 0 | 36149 | 0 |
| B | 0 | 36606 | 0 |
| C | 0 | 36404 | 0 |
| D | 0 | 55425 | 0 |
| Quadrant | Total seconds | Saturated seconds | Saturation percentage |
|---|---|---|---|
| A | 17648 | 189 | 1.070943% |
| B | 17649 | 195 | 1.104878% |
| C | 17649 | 265 | 1.501502% |
| D | 17648 | 1526 | 8.646872% |
Noise dominated data is calculated using 1-second bins in cleaned event files. If a bin has >2000 counts, and if more than 50% of those come from <1% of pixels, then it is considered to be noise-dominated and hence unusable.
| Quadrant | # 1 sec bins | Bins with >0 counts | Bins with >2000 counts | High rate bins dominated by noise | Noise dominated (total time) | Noise dominated (detector-on time) | Marked lightcurve |
|---|---|---|---|---|---|---|---|
| A | 19528 | 17648 | 8 | 8 | 0.04% | 0.05% | 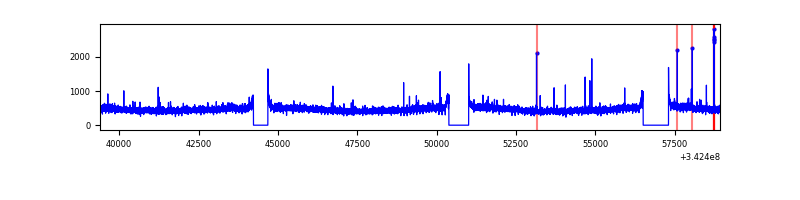 |
| B | 19529 | 17649 | 10 | 10 | 0.05% | 0.06% | 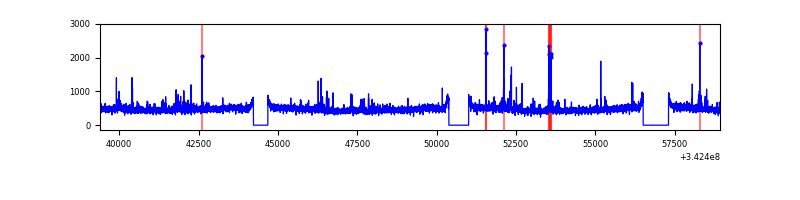 |
| C | 19529 | 17649 | 22 | 22 | 0.11% | 0.12% | 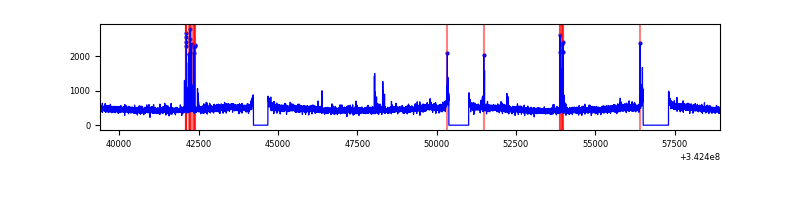 |
| D | 19528 | 17648 | 1312 | 1312 | 6.72% | 7.43% | 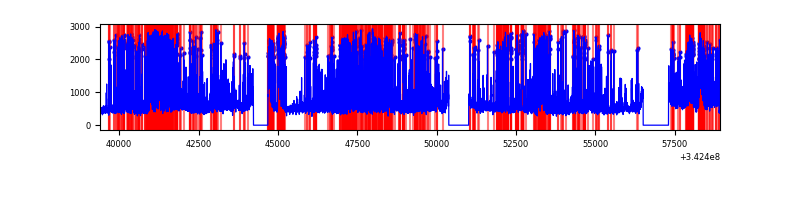 |
Top three noisy pixels from each quadrant. If the there are fewer than three noisy pixels in the level2.evt file, extra rows are filled as -1
| Pixel properties | Quadrant properties | ||||||
|---|---|---|---|---|---|---|---|
| Quadrant | DetID | PixID | Counts | Sigma | Mean | Median | Sigma |
| A | 6 | 16 | 31663 | 69.82 | 2111 | 2066 | 423.9 |
| A | 13 | 254 | 31060 | 68.4 | 2111 | 2066 | 423.9 |
| A | 13 | 248 | 22021 | 47.07 | 2111 | 2066 | 423.9 |
| B | 0 | 230 | 102445 | 252.29 | 2096 | 2044 | 398.0 |
| B | 15 | 32 | 64571 | 157.12 | 2096 | 2044 | 398.0 |
| B | 12 | 111 | 49846 | 120.12 | 2096 | 2044 | 398.0 |
| C | 14 | 238 | 324492 | 679.16 | 2026 | 2034 | 474.8 |
| C | 2 | 16 | 151467 | 314.73 | 2026 | 2034 | 474.8 |
| C | 3 | 233 | 22150 | 42.37 | 2026 | 2034 | 474.8 |
| D | 1 | 52 | 4586934 | 9689.17 | 1981 | 1923 | 473.2 |
| D | 7 | 80 | 1940417 | 4096.48 | 1981 | 1923 | 473.2 |
| D | 2 | 250 | 316829 | 665.47 | 1981 | 1923 | 473.2 |
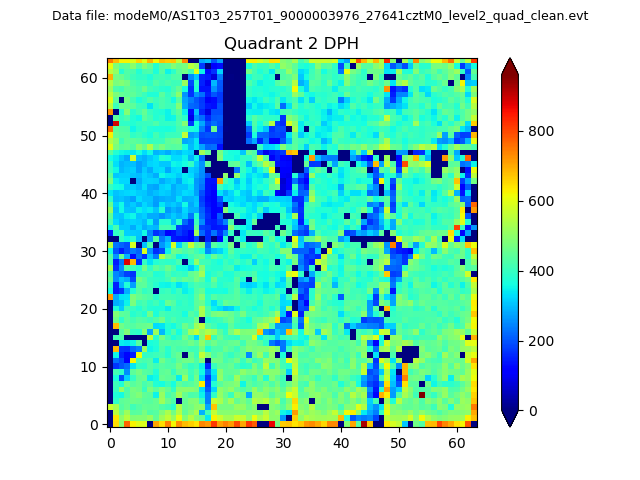
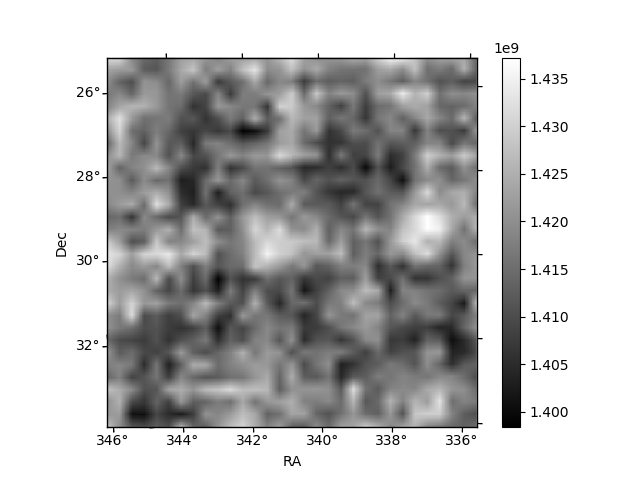
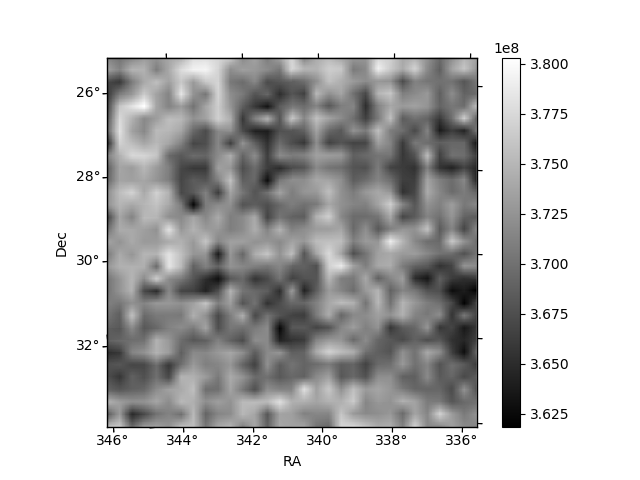
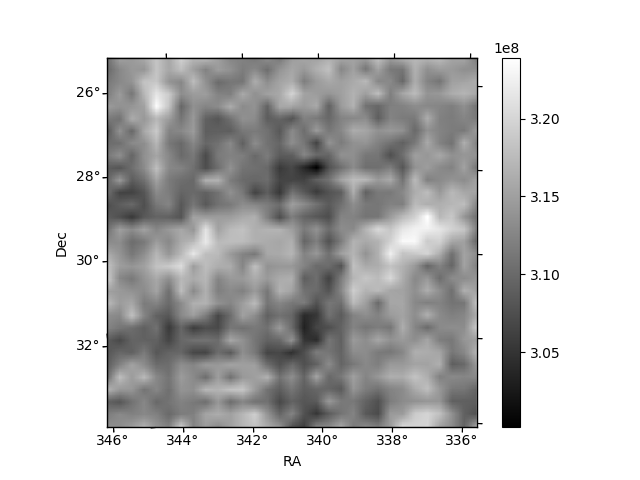
Histogram calculated using DETX and DETY for each event in the final _common_clean file
| Quadrant A | 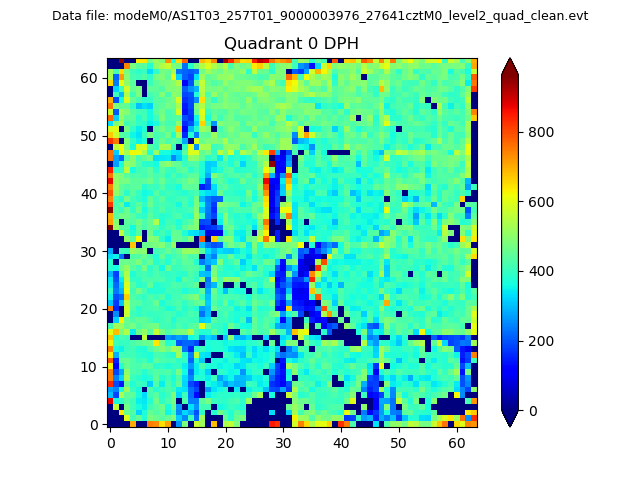 |
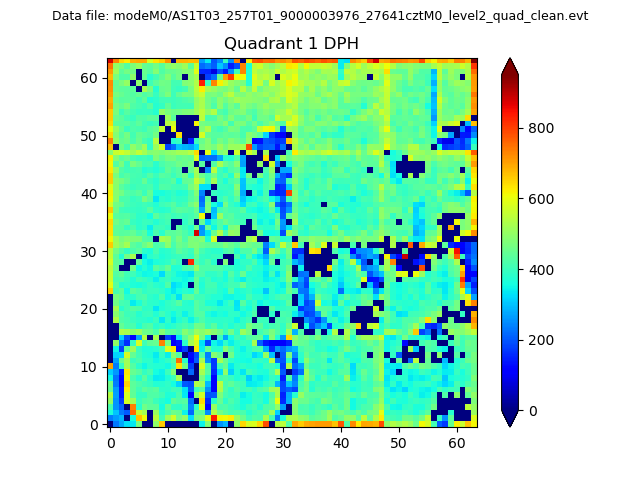 |
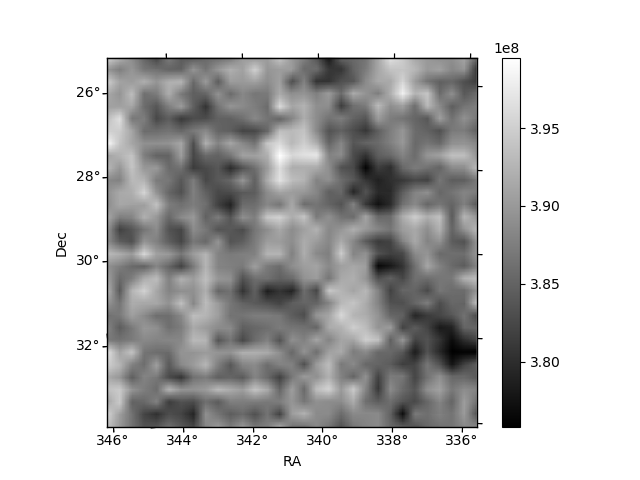
Quadrant B |
|---|---|---|---|
| Quadrant D | 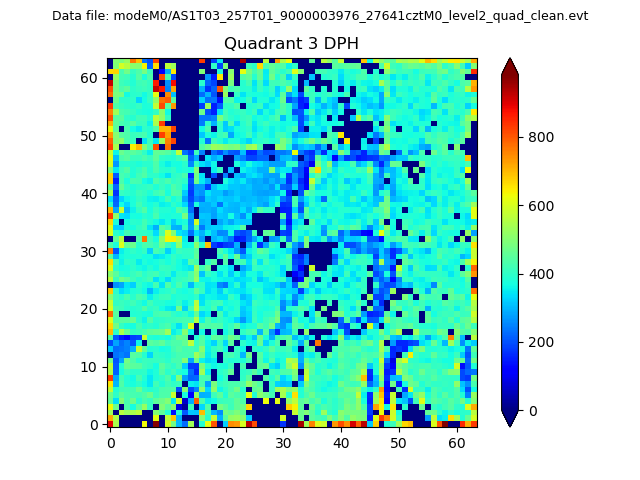 |
 |
Quadrant C |
| Plot type | Count rate plots | Images |
|---|---|---|
| Comparison with Poisson distribution Blue bars denote a histogram of data divided into 1 sec bins. Red curve is a Poisson curve with rate = median count rate of data. |
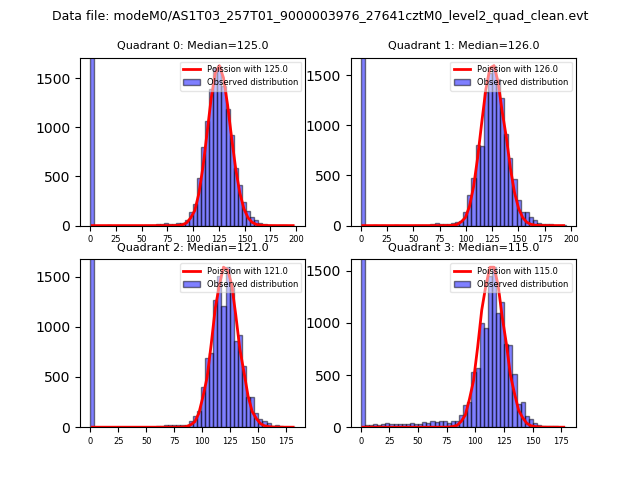 |
 |
| Quadrant-wise count rates Data is divided into 100 sec bins |
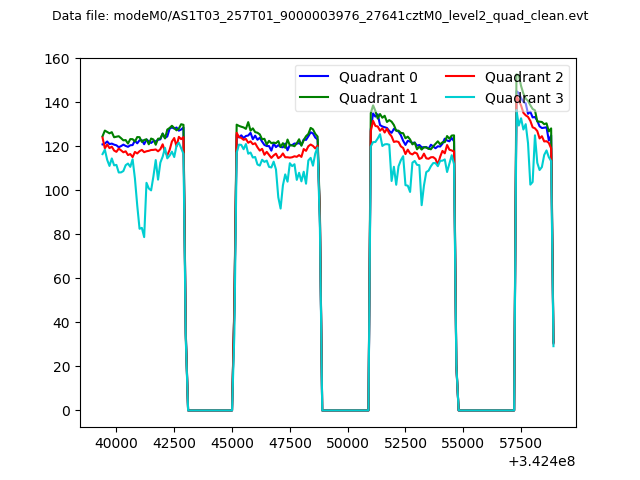 |
|
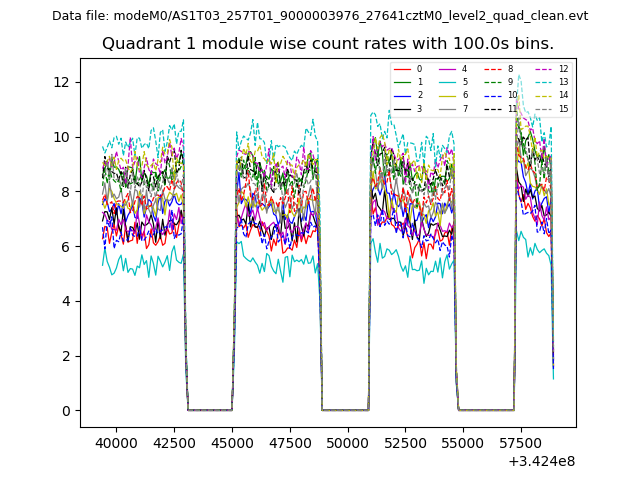
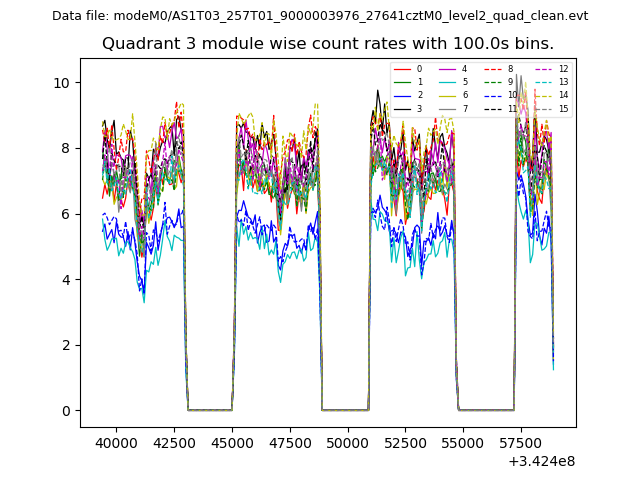
| Module-wise count rates for Quadrant A Data is divided into 100 sec bins |
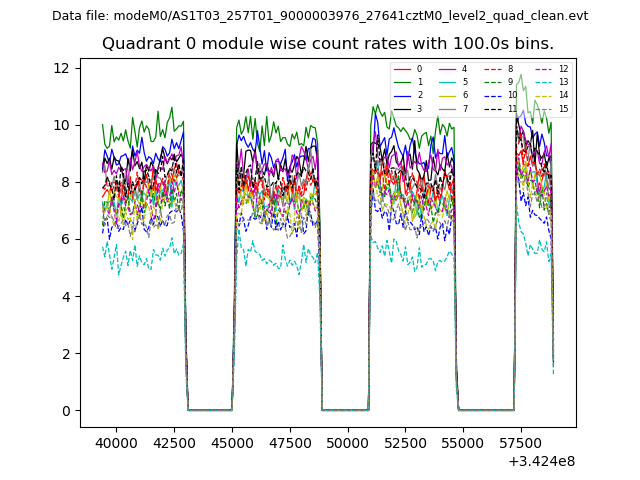 |
 |
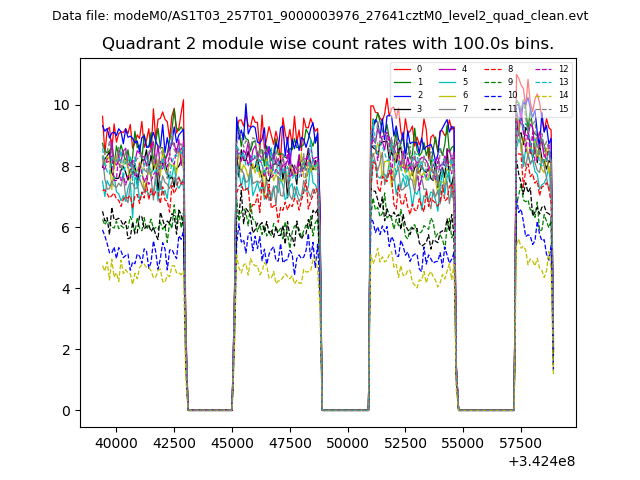
| Module-wise count rates for Quadrant B Data is divided into 100 sec bins |
 |
 |
| Module-wise count rates for Quadrant C Data is divided into 100 sec bins |
 |
 |
| Module-wise count rates for Quadrant D Data is divided into 100 sec bins |
 |
 |
| Parameter | Plot |
|---|---|
| CZT HV Monitor | 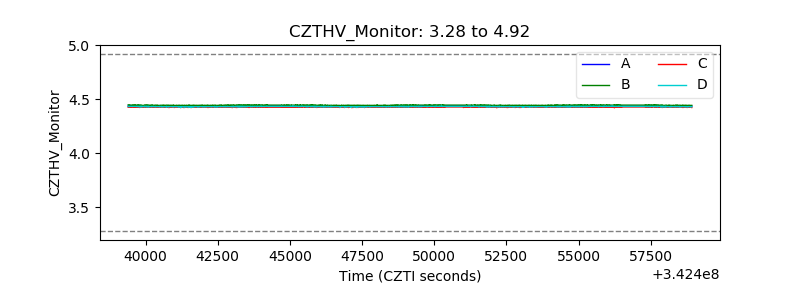 |
| D_VDD | 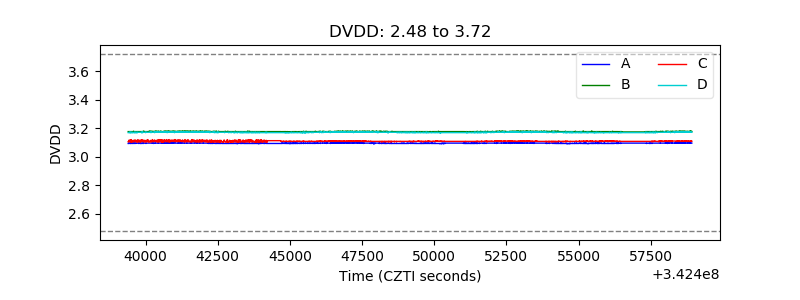 |
| Temperature 1 | 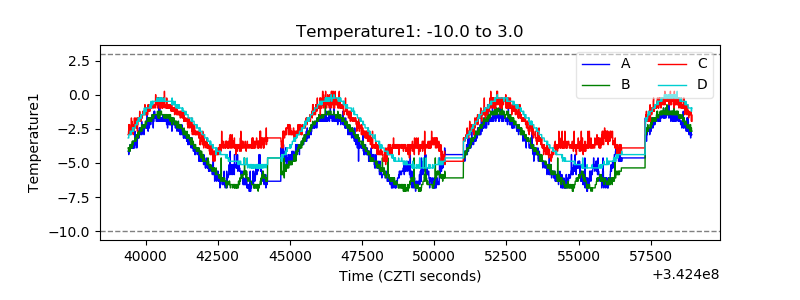 |
| Veto HV Monitor | 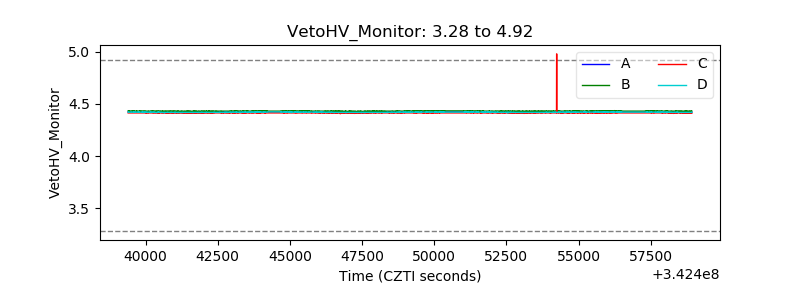 |
| Veto LLD | 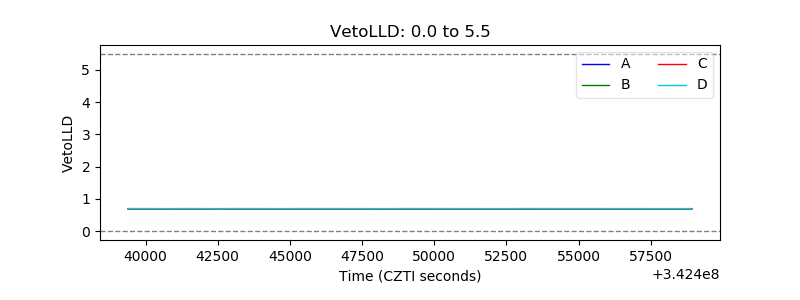 |
| Alpha Counter | 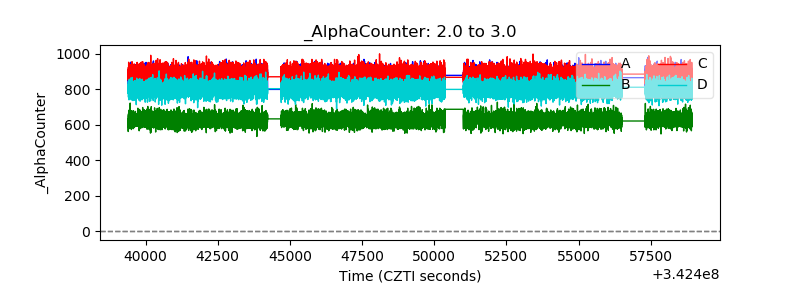 |
| _CPM_Rate | 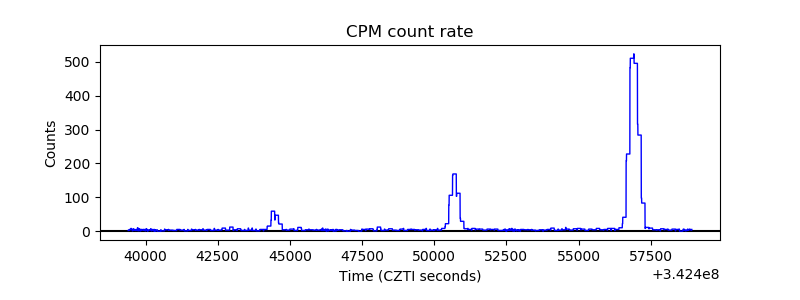 |
| CZT Counter | 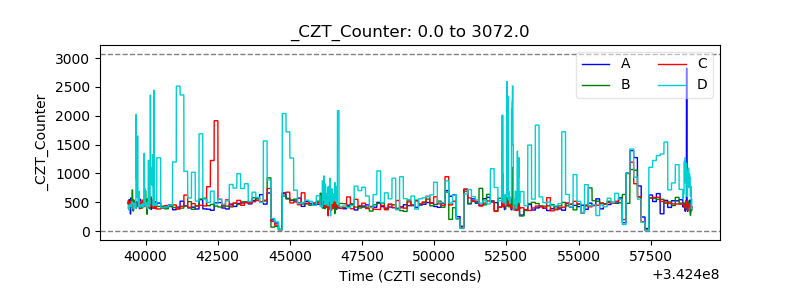 |
| +2.5 Volts monitor |  |
| +5 Volts monitor |  |
| _ROLL_ROT | 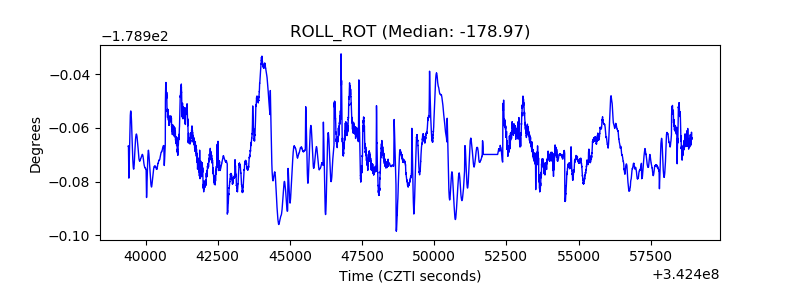 |
| _Roll_DEC | 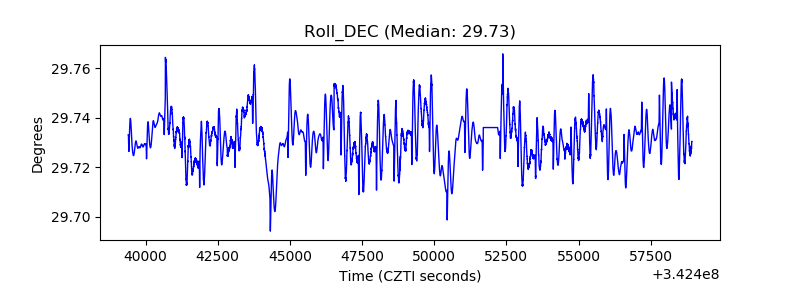 |
| _Roll_RA | 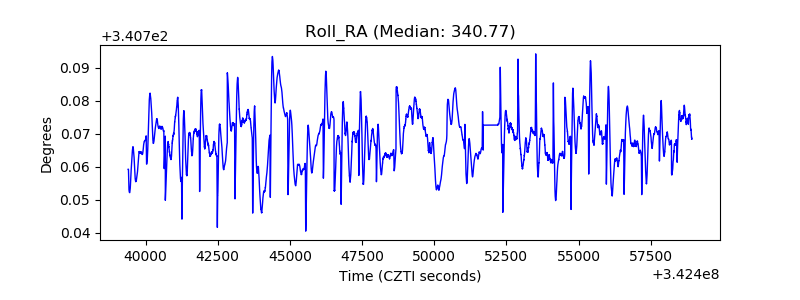 |
| Veto Counter | 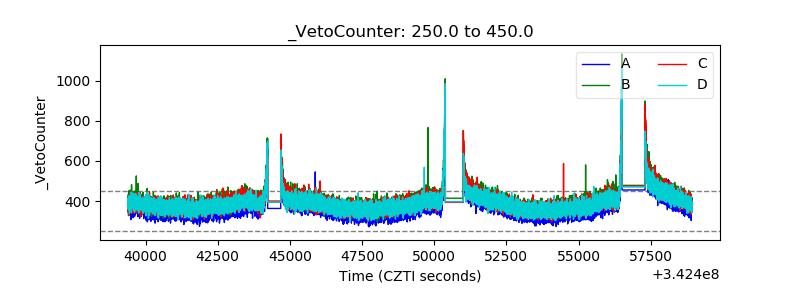 |