| Param | Original file | Final file |
|---|---|---|
| Filename | modeM0/AS1T03_257T01_9000003976_27644cztM0_level2.evt | modeM0/AS1T03_257T01_9000003976_27644cztM0_level2_quad_clean.evt |
| Size (bytes) | 581,932,800 | 92,583,360 |
| Size | 555.0 MB | 88.3 MB |
| Events in quadrant A | 3,452,835 | 621,343 |
| Events in quadrant B | 4,189,717 | 618,422 |
| Events in quadrant C | 3,176,558 | 596,681 |
| Events in quadrant D | 6,366,370 | 515,602 |
| Mode M9 | |||
|---|---|---|---|
| Quadrant | BADHDUFLAG | Total packets | Discarded packets |
| A | 0 | 12 | 0 |
| B | 0 | 12 | 0 |
| C | 0 | 12 | 0 |
| D | 0 | 12 | 0 |
| Mode M0 | |||
|---|---|---|---|
| Quadrant | BADHDUFLAG | Total packets | Discarded packets |
| A | 0 | 14599 | 0 |
| B | 0 | 16641 | 0 |
| C | 0 | 13599 | 0 |
| D | 0 | 23358 | 0 |
| Quadrant | Total seconds | Saturated seconds | Saturation percentage |
|---|---|---|---|
| A | 6467 | 40 | 0.618525% |
| B | 6468 | 274 | 4.236240% |
| C | 6468 | 73 | 1.128633% |
| D | 6468 | 1033 | 15.970934% |
Noise dominated data is calculated using 1-second bins in cleaned event files. If a bin has >2000 counts, and if more than 50% of those come from <1% of pixels, then it is considered to be noise-dominated and hence unusable.
| Quadrant | # 1 sec bins | Bins with >0 counts | Bins with >2000 counts | High rate bins dominated by noise | Noise dominated (total time) | Noise dominated (detector-on time) | Marked lightcurve |
|---|---|---|---|---|---|---|---|
| A | 7622 | 6467 | 6 | 6 | 0.08% | 0.09% | 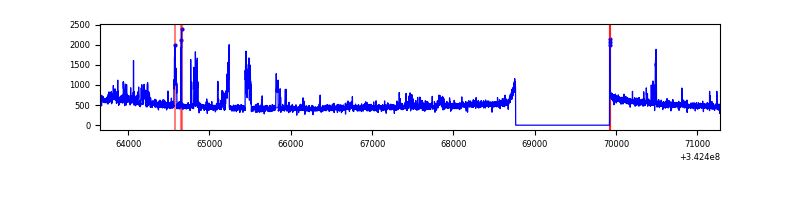 |
| B | 7623 | 6468 | 216 | 216 | 2.83% | 3.34% | 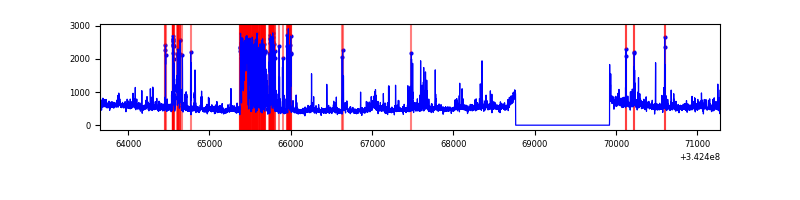 |
| C | 7623 | 6468 | 4 | 4 | 0.05% | 0.06% | 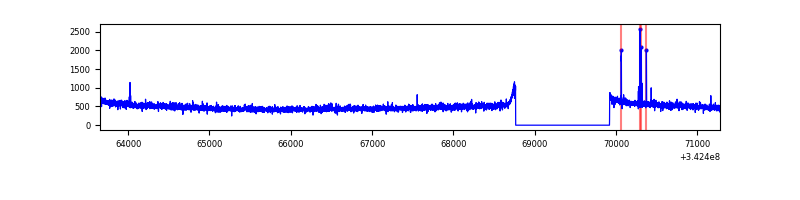 |
| D | 7622 | 6467 | 940 | 940 | 12.33% | 14.54% | 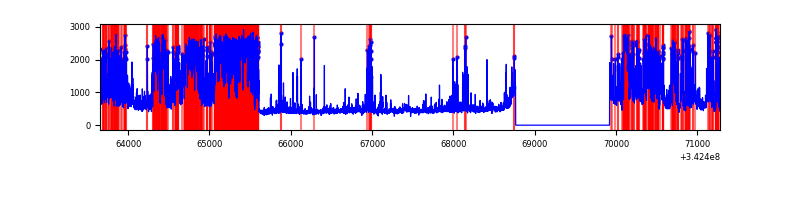 |
Top three noisy pixels from each quadrant. If the there are fewer than three noisy pixels in the level2.evt file, extra rows are filled as -1
| Pixel properties | Quadrant properties | ||||||
|---|---|---|---|---|---|---|---|
| Quadrant | DetID | PixID | Counts | Sigma | Mean | Median | Sigma |
| A | 6 | 16 | 326058 | 2018.22 | 808 | 791 | 161.2 |
| A | 13 | 254 | 11309 | 65.26 | 808 | 791 | 161.2 |
| A | 8 | 192 | 7450 | 41.32 | 808 | 791 | 161.2 |
| B | 5 | 255 | 816351 | 5440.75 | 797 | 778 | 149.9 |
| B | 10 | 245 | 127715 | 846.81 | 797 | 778 | 149.9 |
| B | 0 | 230 | 51144 | 336.0 | 797 | 778 | 149.9 |
| C | 14 | 238 | 124169 | 679.77 | 776 | 780 | 181.5 |
| C | 0 | 207 | 20783 | 110.2 | 776 | 780 | 181.5 |
| C | 13 | 61 | 5420 | 25.56 | 776 | 780 | 181.5 |
| D | 7 | 80 | 1606285 | 9212.89 | 734 | 714 | 174.3 |
| D | 1 | 52 | 1189337 | 6820.41 | 734 | 714 | 174.3 |
| D | 2 | 250 | 503818 | 2886.85 | 734 | 714 | 174.3 |
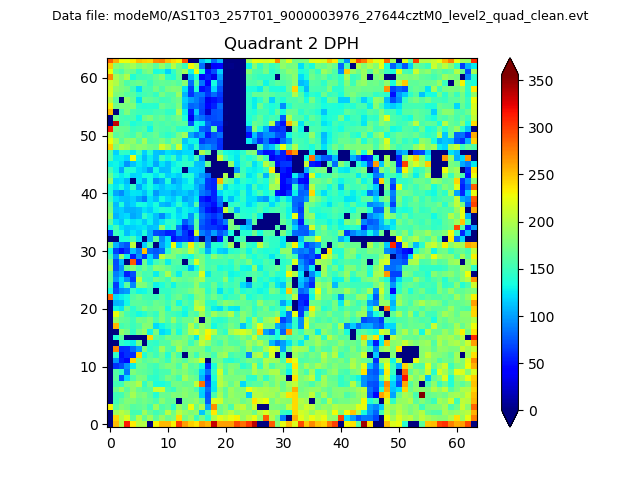
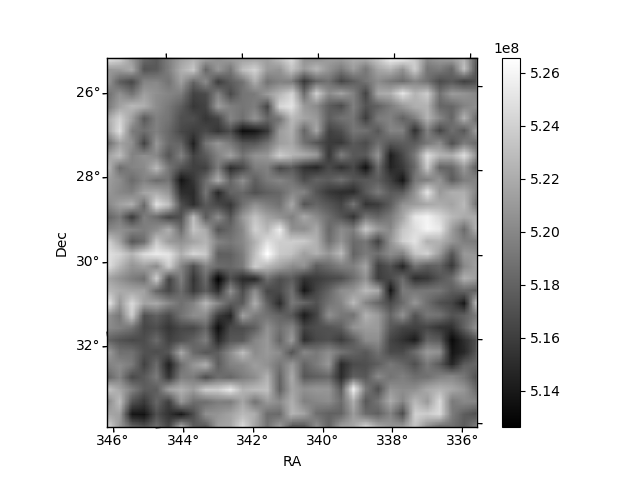
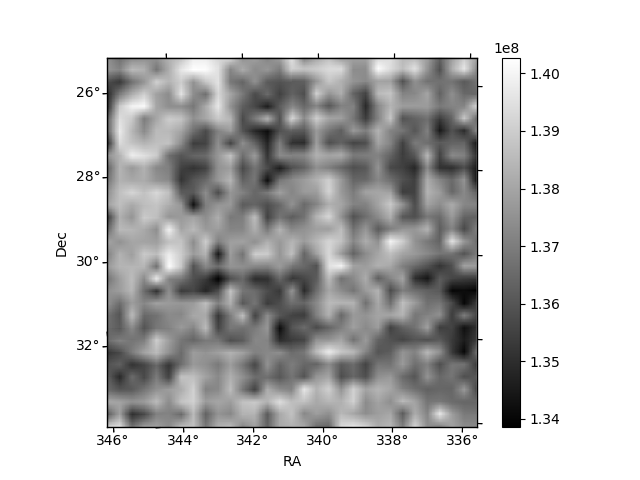
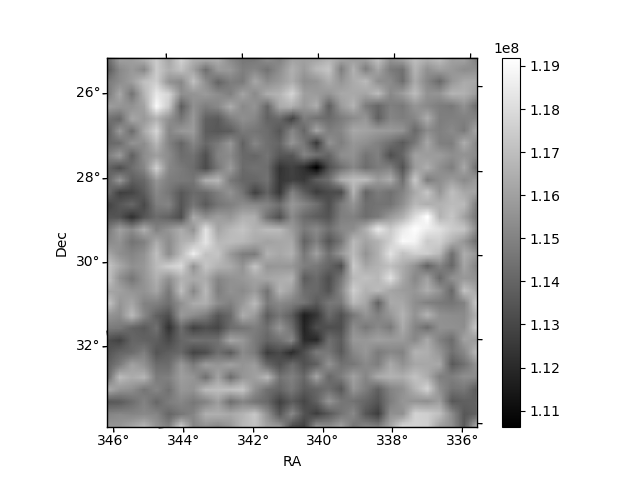
Histogram calculated using DETX and DETY for each event in the final _common_clean file
| Quadrant A | 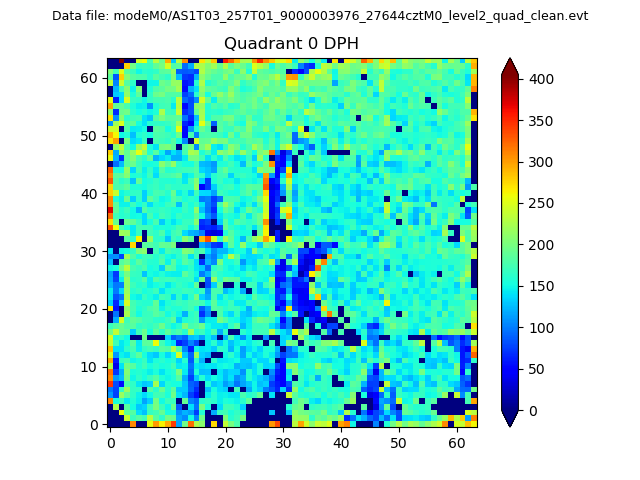 |
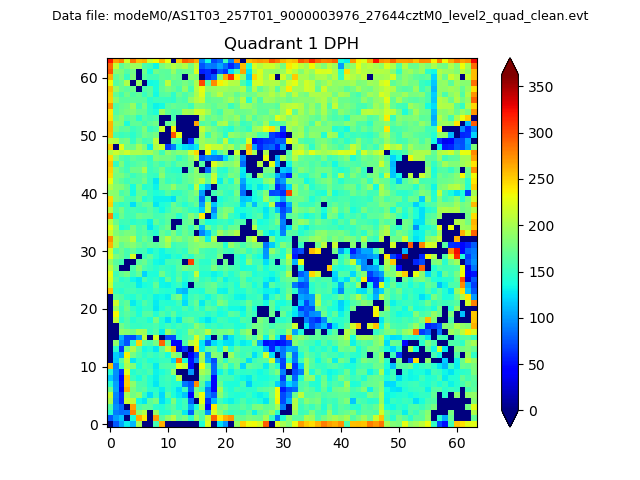 |
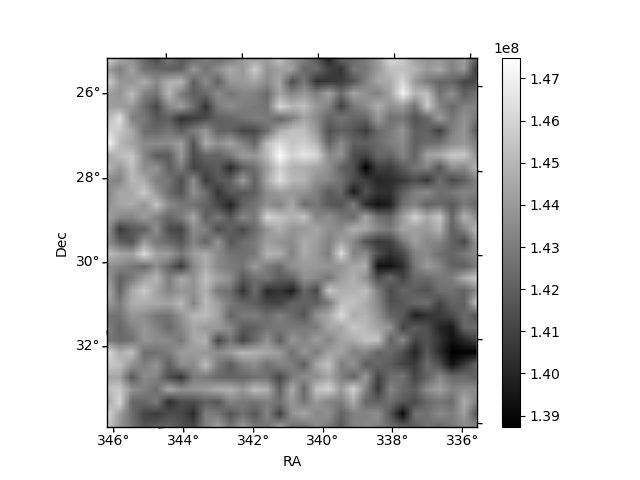
Quadrant B |
|---|---|---|---|
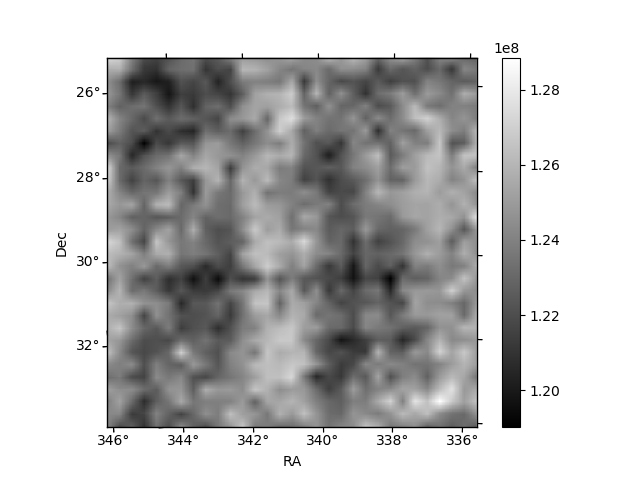
| Quadrant D | 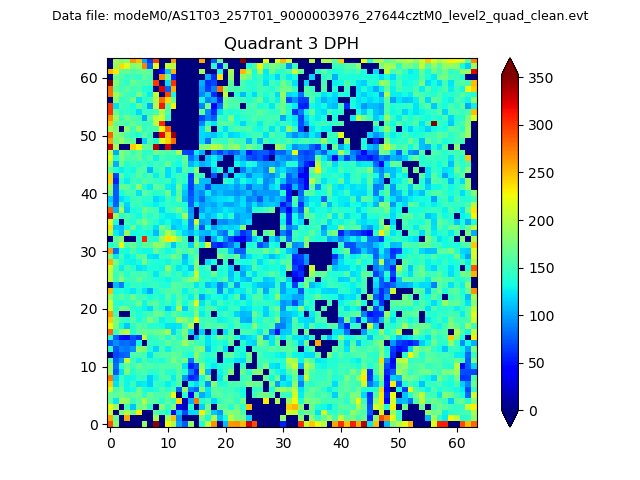 |
 |
Quadrant C |
| Plot type | Count rate plots | Images |
|---|---|---|
| Comparison with Poisson distribution Blue bars denote a histogram of data divided into 1 sec bins. Red curve is a Poisson curve with rate = median count rate of data. |
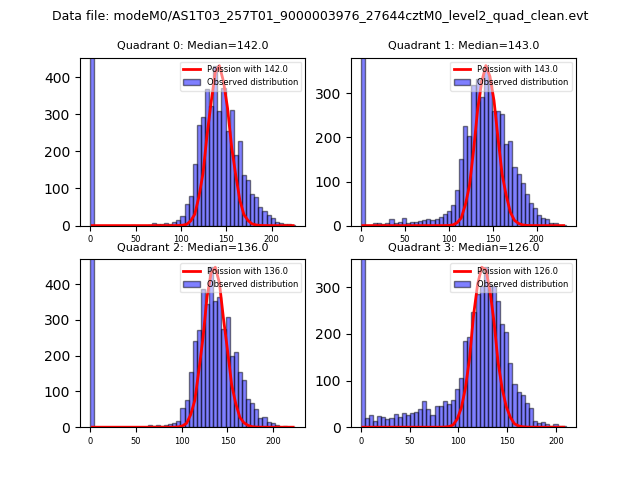 |
 |
| Quadrant-wise count rates Data is divided into 100 sec bins |
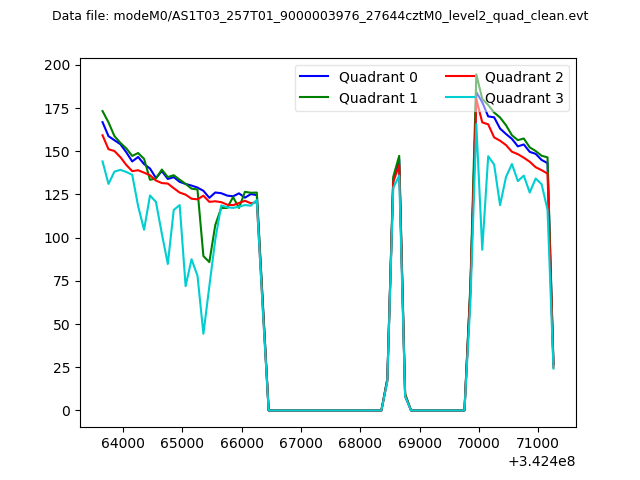 |
|
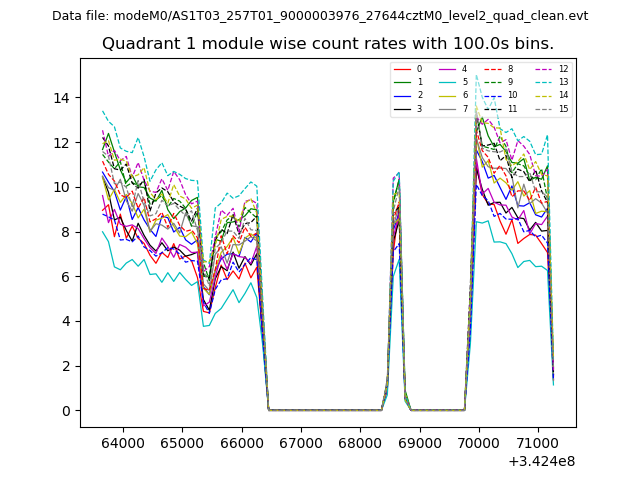
| Module-wise count rates for Quadrant A Data is divided into 100 sec bins |
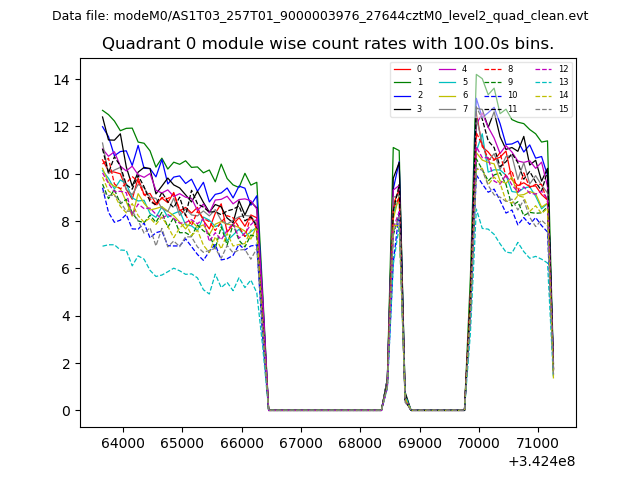 |
 |
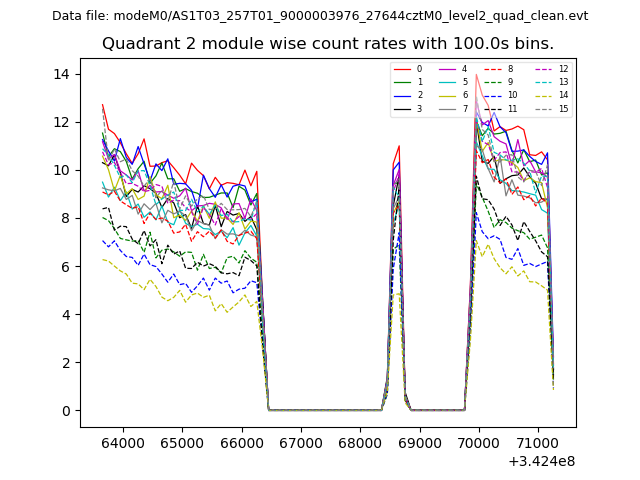
| Module-wise count rates for Quadrant B Data is divided into 100 sec bins |
 |
 |
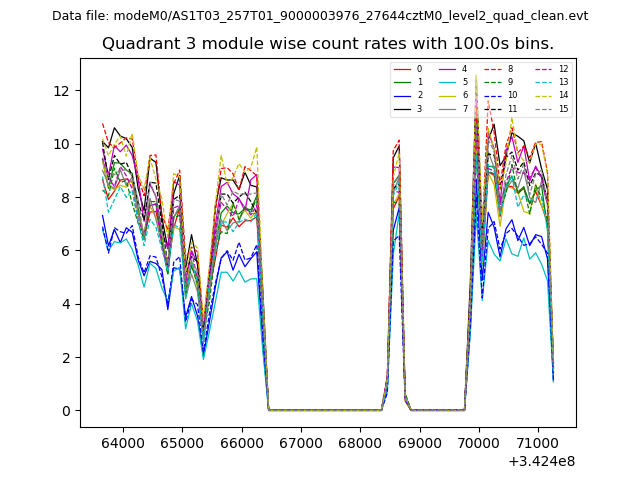
| Module-wise count rates for Quadrant C Data is divided into 100 sec bins |
 |
 |
| Module-wise count rates for Quadrant D Data is divided into 100 sec bins |
 |
 |
| Parameter | Plot |
|---|---|
| CZT HV Monitor | 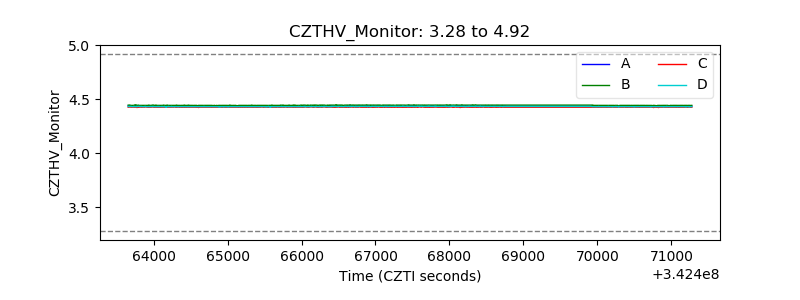 |
| D_VDD | 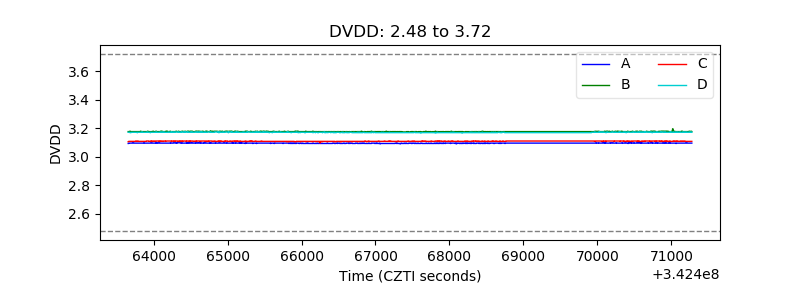 |
| Temperature 1 | 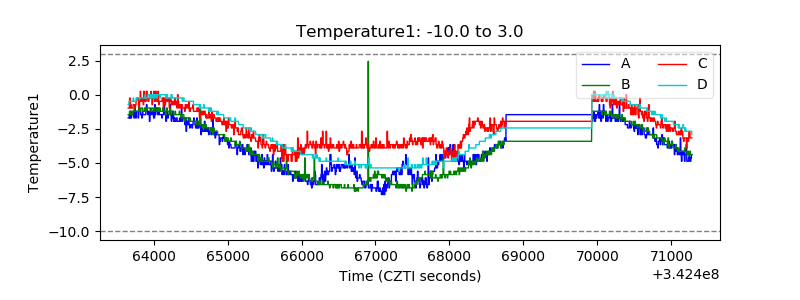 |
| Veto HV Monitor | 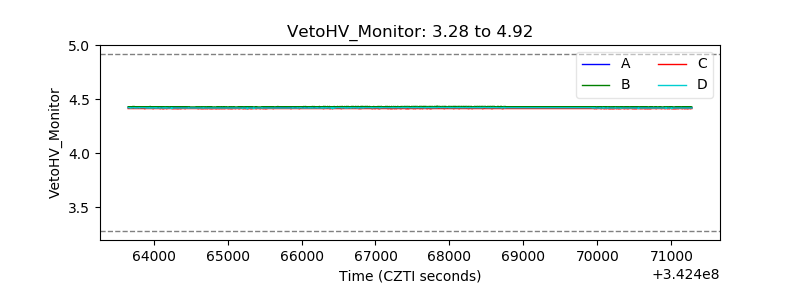 |
| Veto LLD | 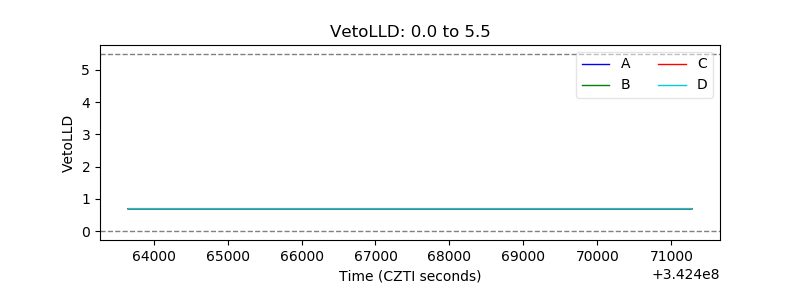 |
| Alpha Counter | 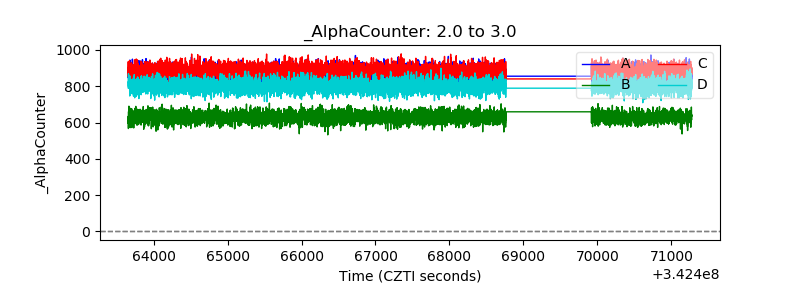 |
| _CPM_Rate | 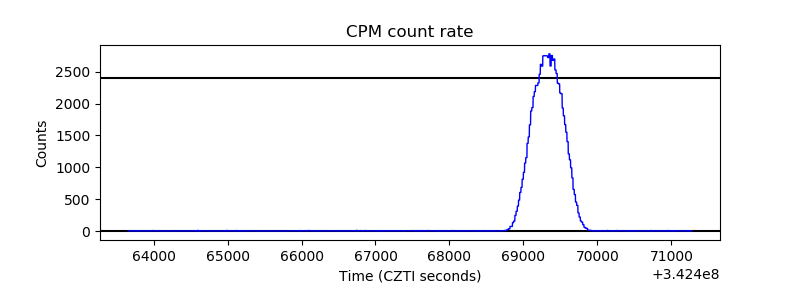 |
| CZT Counter | 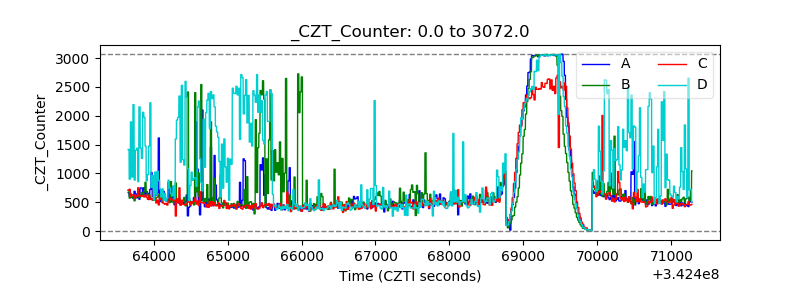 |
| +2.5 Volts monitor |  |
| +5 Volts monitor | 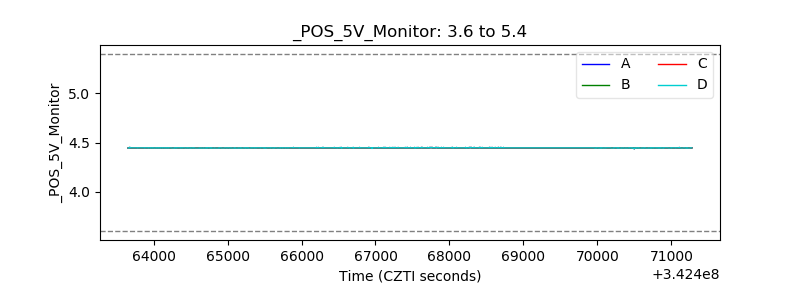 |
| _ROLL_ROT | 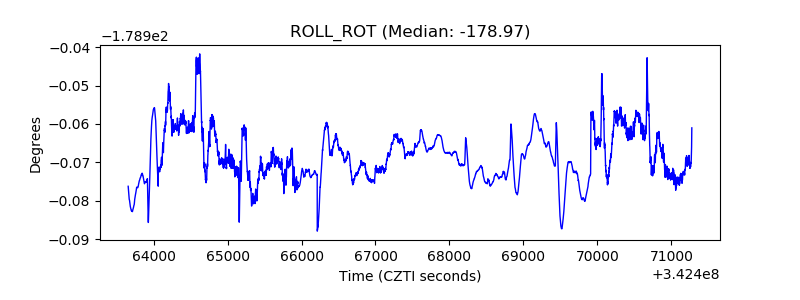 |
| _Roll_DEC |  |
| _Roll_RA | 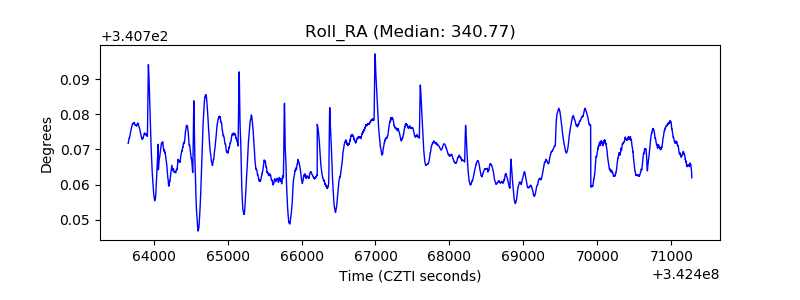 |
| Veto Counter | 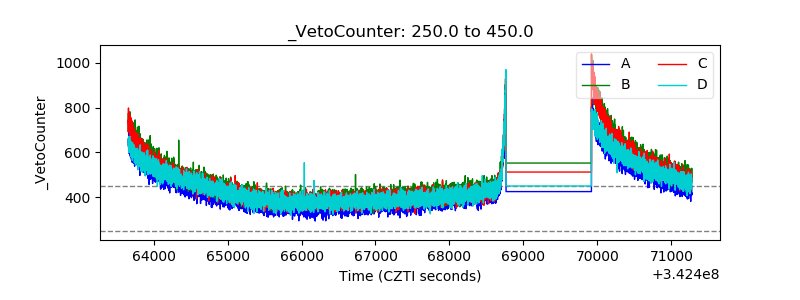 |