| Param | Original file | Final file |
|---|---|---|
| Filename | modeM0/AS1T03_257T01_9000003976_27645cztM0_level2.evt | modeM0/AS1T03_257T01_9000003976_27645cztM0_level2_quad_clean.evt |
| Size (bytes) | 548,700,480 | 94,222,080 |
| Size | 523.3 MB | 89.9 MB |
| Events in quadrant A | 3,282,923 | 635,968 |
| Events in quadrant B | 3,490,761 | 654,694 |
| Events in quadrant C | 3,211,514 | 614,249 |
| Events in quadrant D | 6,208,692 | 512,017 |
| Mode M9 | |||
|---|---|---|---|
| Quadrant | BADHDUFLAG | Total packets | Discarded packets |
| A | 0 | 14 | 0 |
| B | 0 | 15 | 0 |
| C | 0 | 15 | 0 |
| D | 0 | 15 | 0 |
| Mode M0 | |||
|---|---|---|---|
| Quadrant | BADHDUFLAG | Total packets | Discarded packets |
| A | 0 | 13812 | 0 |
| B | 0 | 14395 | 0 |
| C | 0 | 13466 | 0 |
| D | 0 | 22641 | 0 |
| Quadrant | Total seconds | Saturated seconds | Saturation percentage |
|---|---|---|---|
| A | 6244 | 41 | 0.656630% |
| B | 6244 | 62 | 0.992953% |
| C | 6244 | 78 | 1.249199% |
| D | 6244 | 1008 | 16.143498% |
Noise dominated data is calculated using 1-second bins in cleaned event files. If a bin has >2000 counts, and if more than 50% of those come from <1% of pixels, then it is considered to be noise-dominated and hence unusable.
| Quadrant | # 1 sec bins | Bins with >0 counts | Bins with >2000 counts | High rate bins dominated by noise | Noise dominated (total time) | Noise dominated (detector-on time) | Marked lightcurve |
|---|---|---|---|---|---|---|---|
| A | 7490 | 6244 | 8 | 8 | 0.11% | 0.13% |  |
| B | 7490 | 6244 | 13 | 13 | 0.17% | 0.21% |  |
| C | 7490 | 6244 | 4 | 4 | 0.05% | 0.06% |  |
| D | 7490 | 6244 | 882 | 882 | 11.78% | 14.13% |  |
Top three noisy pixels from each quadrant. If the there are fewer than three noisy pixels in the level2.evt file, extra rows are filled as -1
| Pixel properties | Quadrant properties | ||||||
|---|---|---|---|---|---|---|---|
| Quadrant | DetID | PixID | Counts | Sigma | Mean | Median | Sigma |
| A | 6 | 16 | 154046 | 952.55 | 808 | 793 | 160.9 |
| A | 8 | 192 | 12428 | 72.32 | 808 | 793 | 160.9 |
| A | 13 | 254 | 11060 | 63.81 | 808 | 793 | 160.9 |
| B | 5 | 255 | 104750 | 693.3 | 808 | 788 | 150.0 |
| B | 0 | 230 | 104198 | 689.62 | 808 | 788 | 150.0 |
| B | 10 | 245 | 67112 | 442.3 | 808 | 788 | 150.0 |
| C | 14 | 238 | 126154 | 690.28 | 779 | 785 | 181.6 |
| C | 0 | 207 | 20801 | 110.21 | 779 | 785 | 181.6 |
| C | 2 | 16 | 19958 | 105.56 | 779 | 785 | 181.6 |
| D | 1 | 52 | 2177526 | 12809.28 | 723 | 707 | 169.9 |
| D | 2 | 250 | 644646 | 3789.2 | 723 | 707 | 169.9 |
| D | 7 | 80 | 312526 | 1834.87 | 723 | 707 | 169.9 |
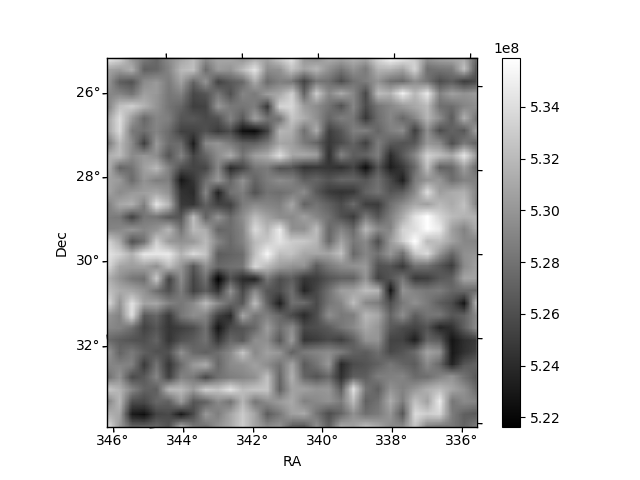
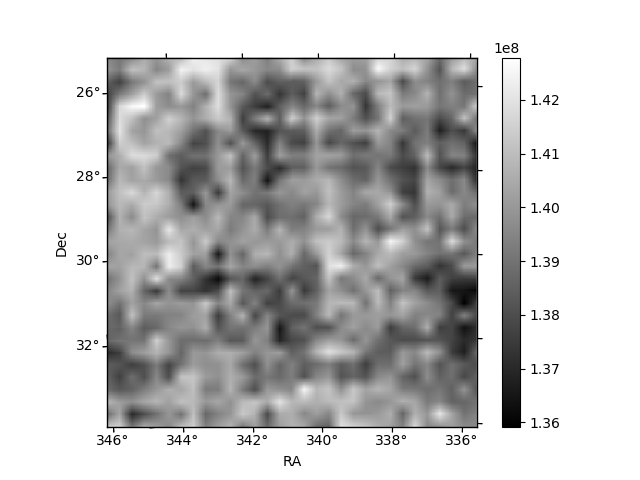
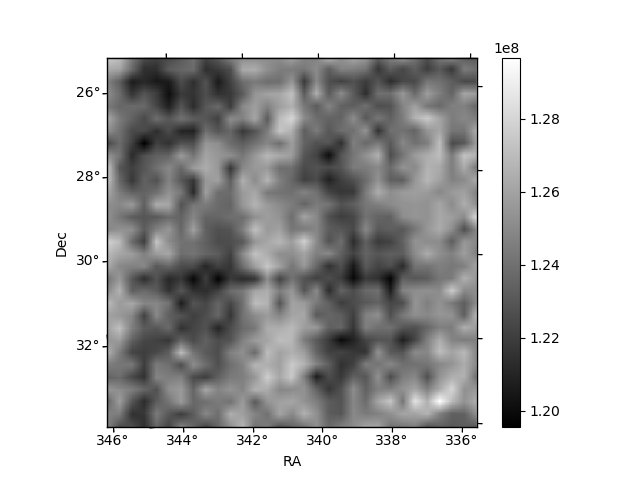
Histogram calculated using DETX and DETY for each event in the final _common_clean file
| Quadrant A | 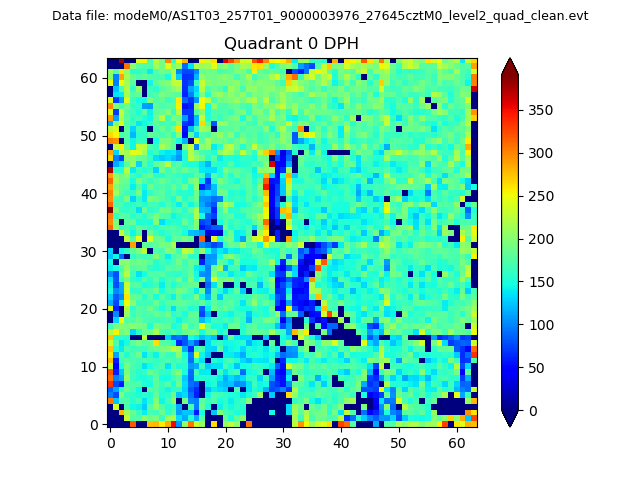 |
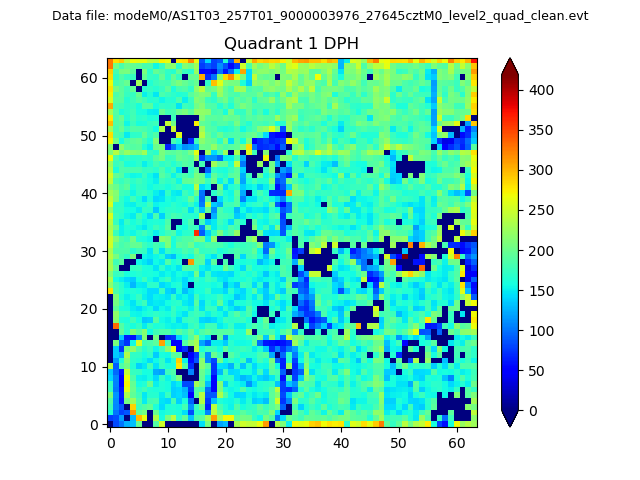 |
Quadrant B |
|---|---|---|---|
| Quadrant D | 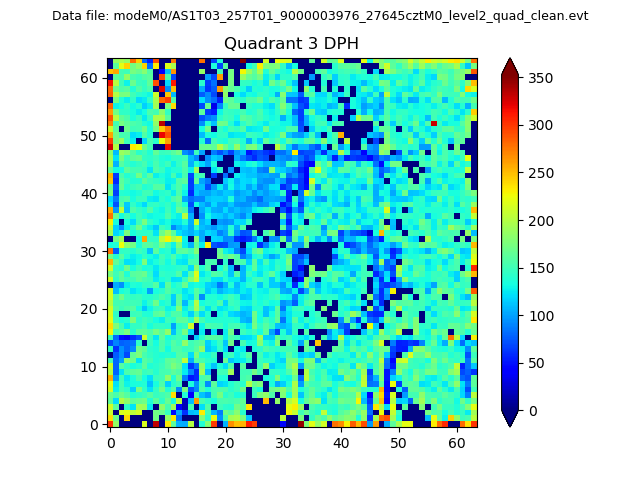 |
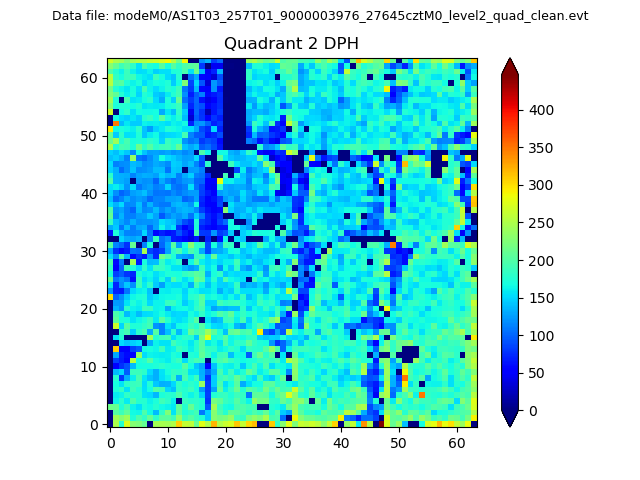 |
Quadrant C |
| Plot type | Count rate plots | Images |
|---|---|---|
| Comparison with Poisson distribution Blue bars denote a histogram of data divided into 1 sec bins. Red curve is a Poisson curve with rate = median count rate of data. |
 |
 |
| Quadrant-wise count rates Data is divided into 100 sec bins |
 |
|
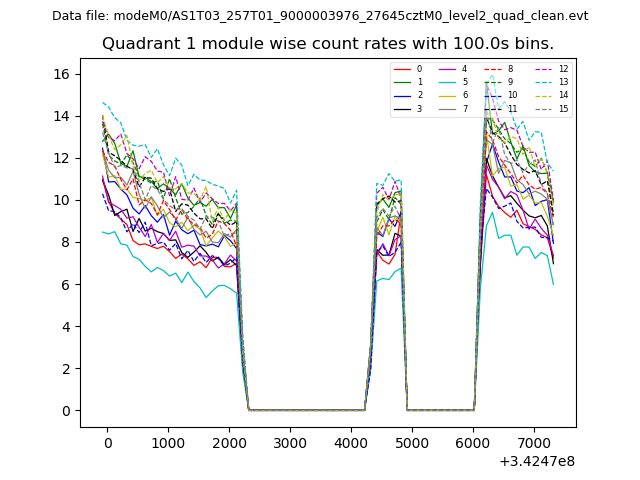
| Module-wise count rates for Quadrant A Data is divided into 100 sec bins |
 |
 |
| Module-wise count rates for Quadrant B Data is divided into 100 sec bins |
 |
 |
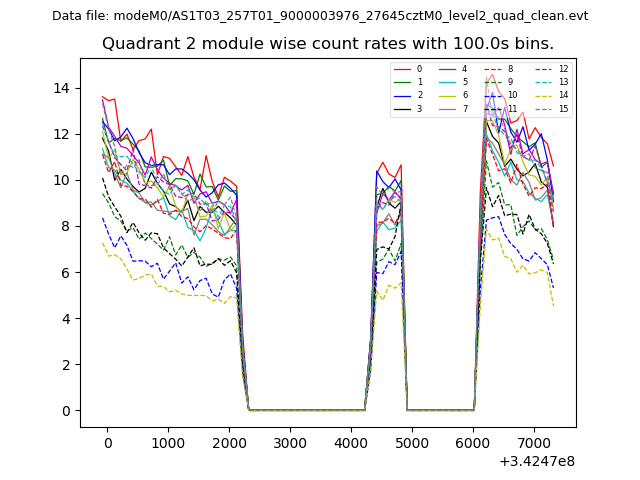
| Module-wise count rates for Quadrant C Data is divided into 100 sec bins |
 |
 |
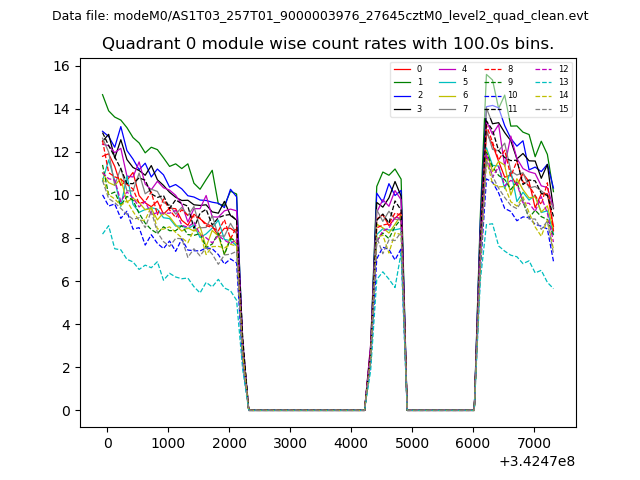
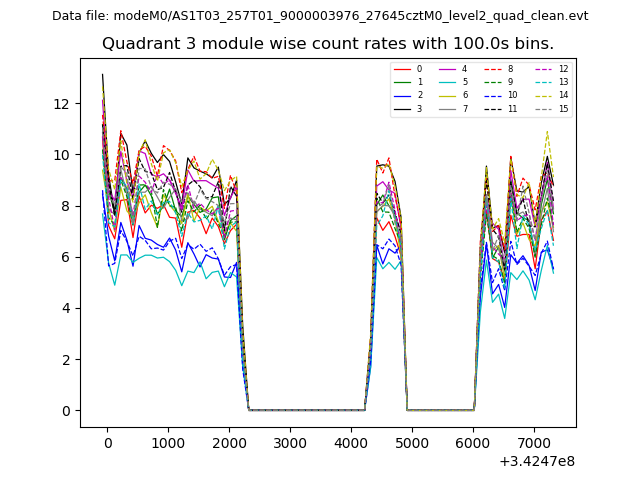
| Module-wise count rates for Quadrant D Data is divided into 100 sec bins |
 |
 |
| Parameter | Plot |
|---|---|
| CZT HV Monitor | 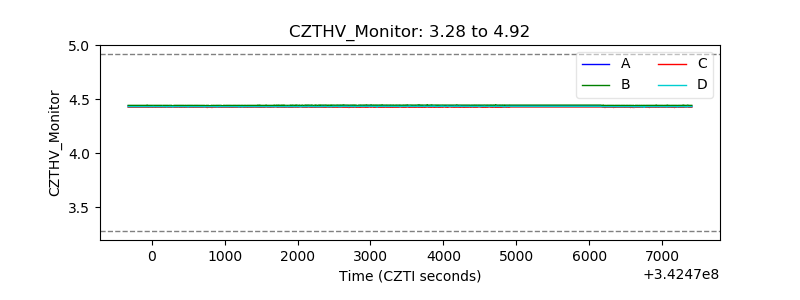 |
| D_VDD | 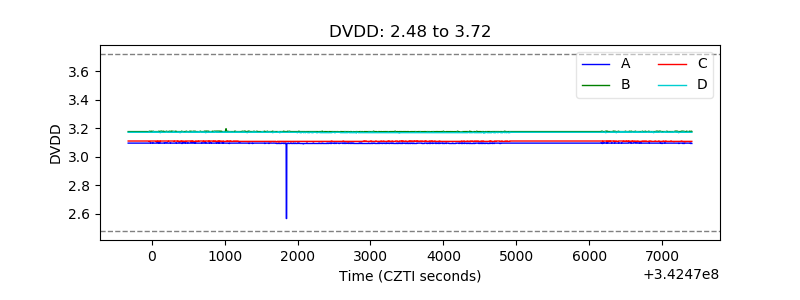 |
| Temperature 1 | 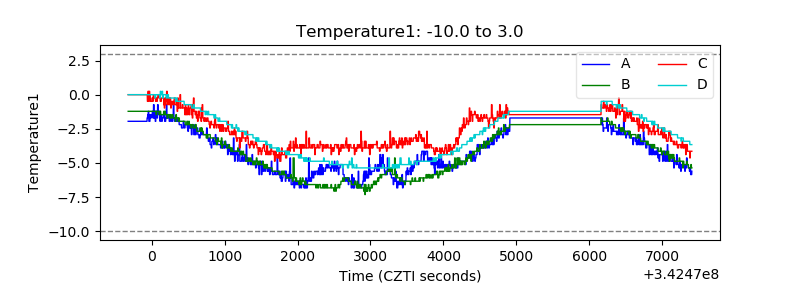 |
| Veto HV Monitor | 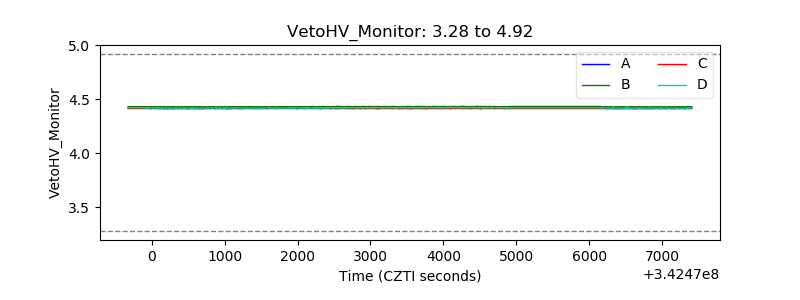 |
| Veto LLD | 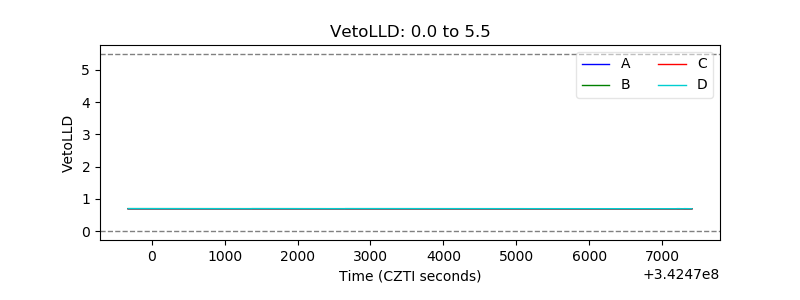 |
| Alpha Counter |  |
| _CPM_Rate |  |
| CZT Counter | 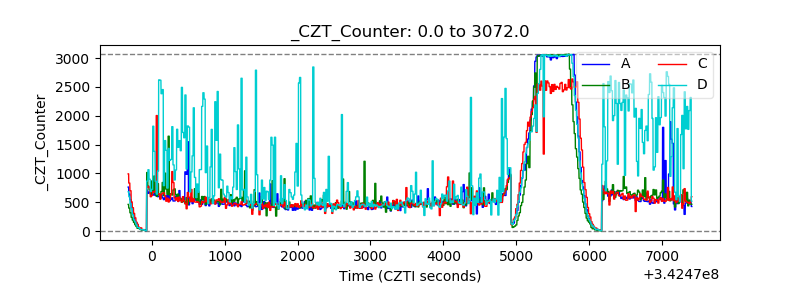 |
| +2.5 Volts monitor |  |
| +5 Volts monitor |  |
| _ROLL_ROT | 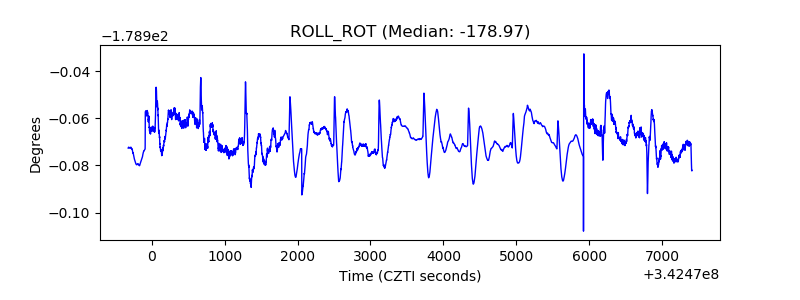 |
| _Roll_DEC | 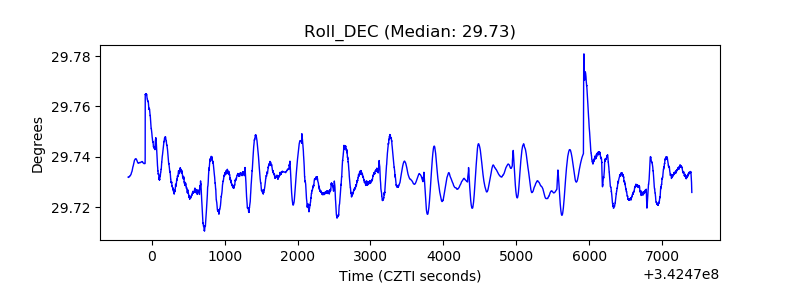 |
| _Roll_RA | 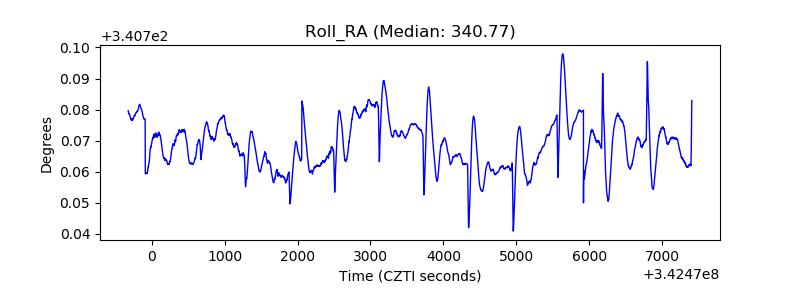 |
| Veto Counter | 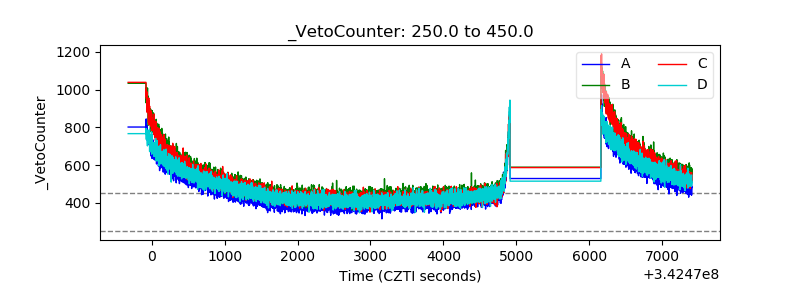 |