| Param | Original file | Final file |
|---|---|---|
| Filename | modeM0/AS1T03_257T01_9000003976_27646cztM0_level2.evt | modeM0/AS1T03_257T01_9000003976_27646cztM0_level2_quad_clean.evt |
| Size (bytes) | 566,375,040 | 95,238,720 |
| Size | 540.1 MB | 90.8 MB |
| Events in quadrant A | 3,289,684 | 648,985 |
| Events in quadrant B | 3,905,718 | 670,874 |
| Events in quadrant C | 3,217,774 | 627,535 |
| Events in quadrant D | 6,324,915 | 509,066 |
| Mode M9 | |||
|---|---|---|---|
| Quadrant | BADHDUFLAG | Total packets | Discarded packets |
| A | 0 | 18 | 0 |
| B | 0 | 19 | 0 |
| C | 0 | 19 | 0 |
| D | 0 | 19 | 0 |
| Mode M0 | |||
|---|---|---|---|
| Quadrant | BADHDUFLAG | Total packets | Discarded packets |
| A | 0 | 13620 | 0 |
| B | 0 | 15653 | 0 |
| C | 0 | 13296 | 0 |
| D | 0 | 22911 | 0 |
| Quadrant | Total seconds | Saturated seconds | Saturation percentage |
|---|---|---|---|
| A | 6121 | 35 | 0.571802% |
| B | 6121 | 139 | 2.270871% |
| C | 6120 | 87 | 1.421569% |
| D | 6120 | 1119 | 18.284314% |
Noise dominated data is calculated using 1-second bins in cleaned event files. If a bin has >2000 counts, and if more than 50% of those come from <1% of pixels, then it is considered to be noise-dominated and hence unusable.
| Quadrant | # 1 sec bins | Bins with >0 counts | Bins with >2000 counts | High rate bins dominated by noise | Noise dominated (total time) | Noise dominated (detector-on time) | Marked lightcurve |
|---|---|---|---|---|---|---|---|
| A | 7451 | 6121 | 6 | 6 | 0.08% | 0.10% | 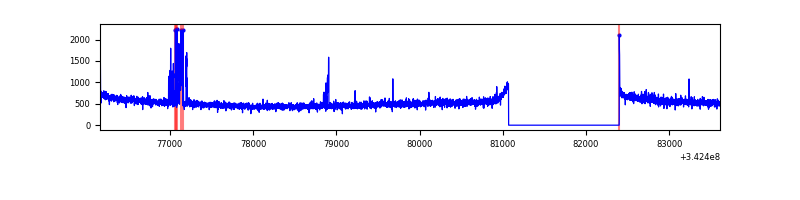 |
| B | 7451 | 6121 | 67 | 67 | 0.90% | 1.09% | 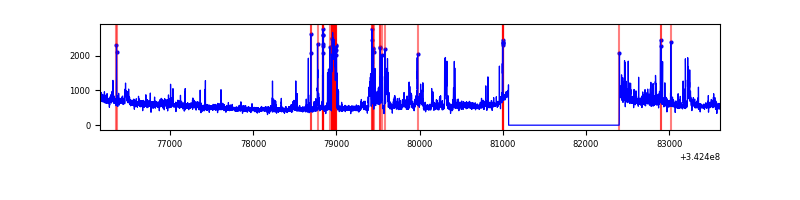 |
| C | 7450 | 6120 | 0 | 0 | 0.00% | 0.00% | 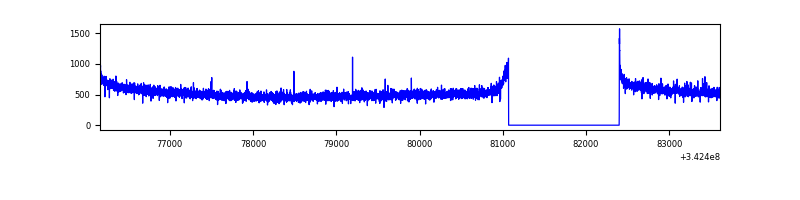 |
| D | 7449 | 6119 | 1036 | 1036 | 13.91% | 16.93% | 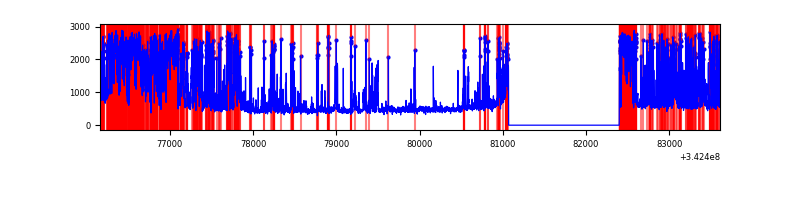 |
Top three noisy pixels from each quadrant. If the there are fewer than three noisy pixels in the level2.evt file, extra rows are filled as -1
| Pixel properties | Quadrant properties | ||||||
|---|---|---|---|---|---|---|---|
| Quadrant | DetID | PixID | Counts | Sigma | Mean | Median | Sigma |
| A | 6 | 16 | 139427 | 863.43 | 814 | 798 | 160.6 |
| A | 8 | 192 | 11716 | 68.0 | 814 | 798 | 160.6 |
| A | 13 | 254 | 10861 | 62.68 | 814 | 798 | 160.6 |
| B | 10 | 245 | 517399 | 3427.86 | 817 | 799 | 150.7 |
| B | 0 | 230 | 92644 | 609.43 | 817 | 799 | 150.7 |
| B | 5 | 255 | 51428 | 335.95 | 817 | 799 | 150.7 |
| C | 14 | 238 | 127419 | 694.79 | 788 | 795 | 182.2 |
| C | 0 | 10 | 6505 | 31.33 | 788 | 795 | 182.2 |
| C | 13 | 61 | 5414 | 25.34 | 788 | 795 | 182.2 |
| D | 1 | 52 | 2769329 | 16323.25 | 714 | 697 | 169.6 |
| D | 2 | 250 | 729268 | 4295.49 | 714 | 697 | 169.6 |
| D | 11 | 176 | 54235 | 315.65 | 714 | 697 | 169.6 |
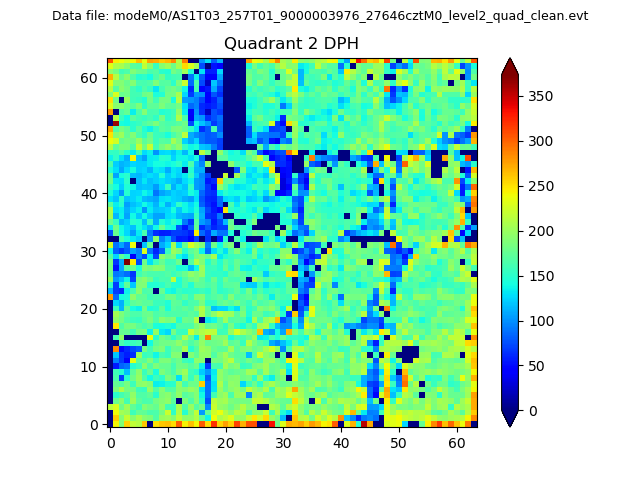
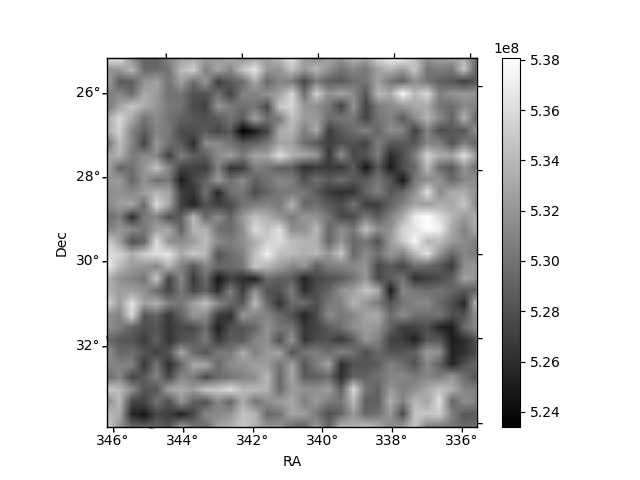
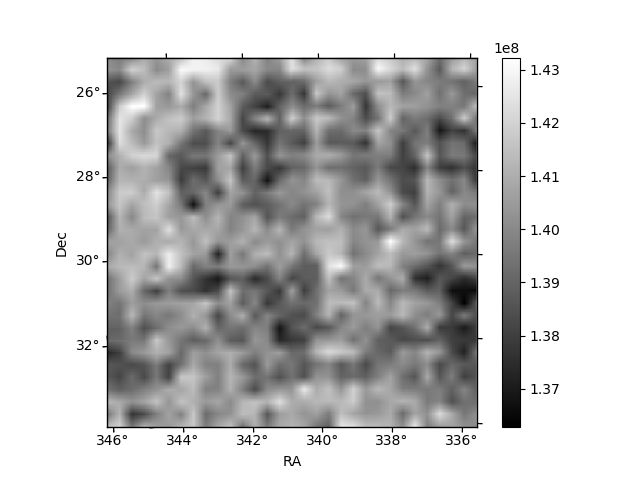
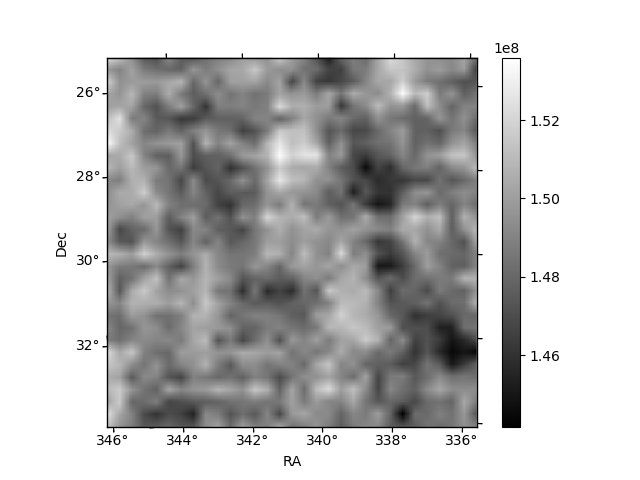
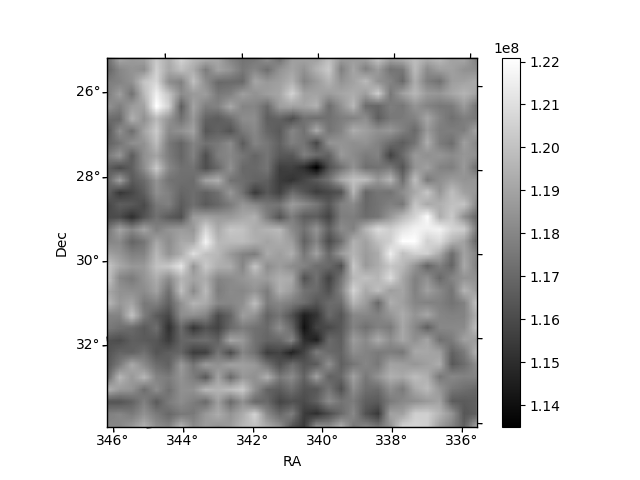
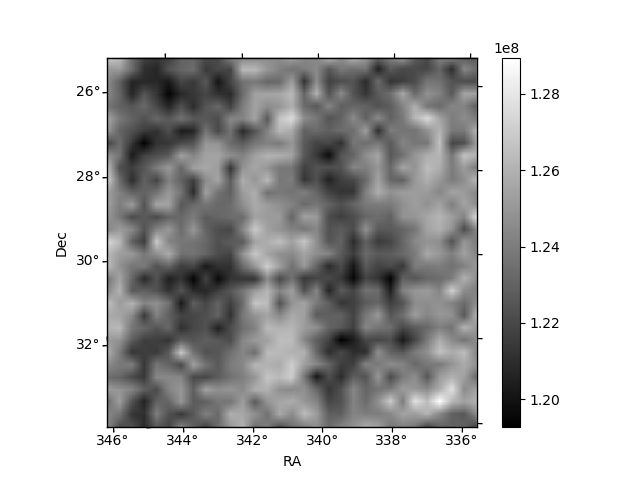
Histogram calculated using DETX and DETY for each event in the final _common_clean file
| Quadrant A | 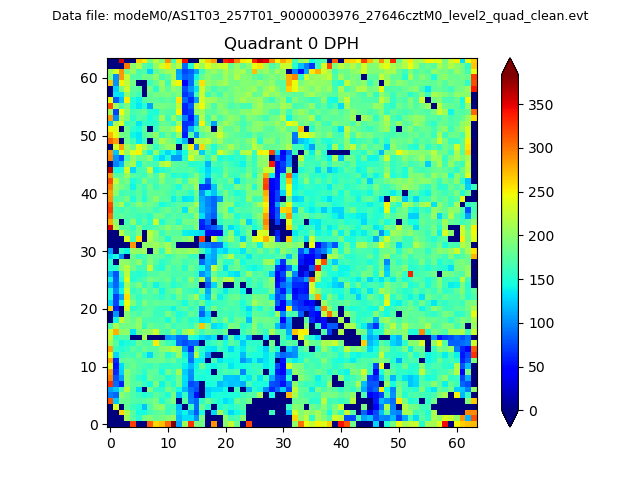 |
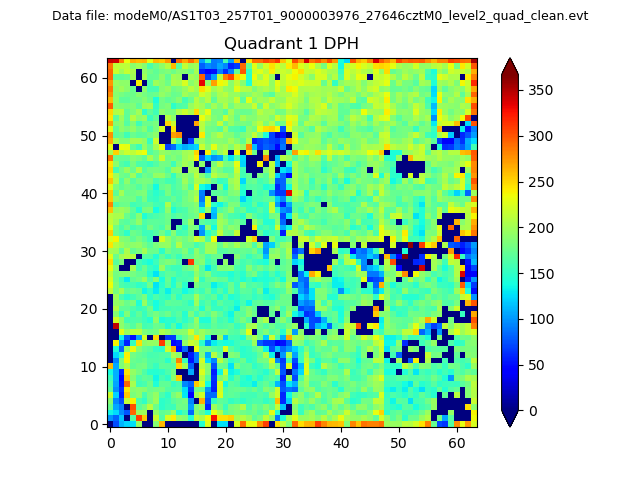 |
Quadrant B |
|---|---|---|---|
| Quadrant D | 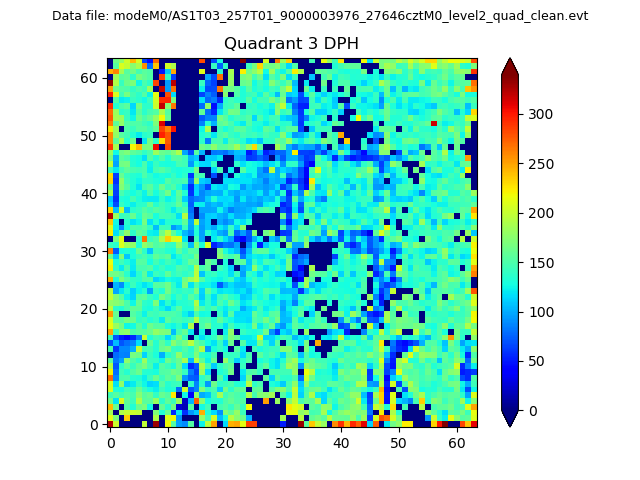 |
 |
Quadrant C |
| Plot type | Count rate plots | Images |
|---|---|---|
| Comparison with Poisson distribution Blue bars denote a histogram of data divided into 1 sec bins. Red curve is a Poisson curve with rate = median count rate of data. |
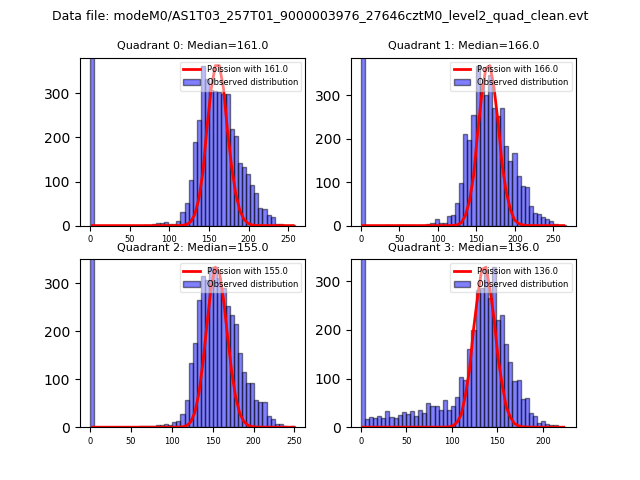 |
 |
| Quadrant-wise count rates Data is divided into 100 sec bins |
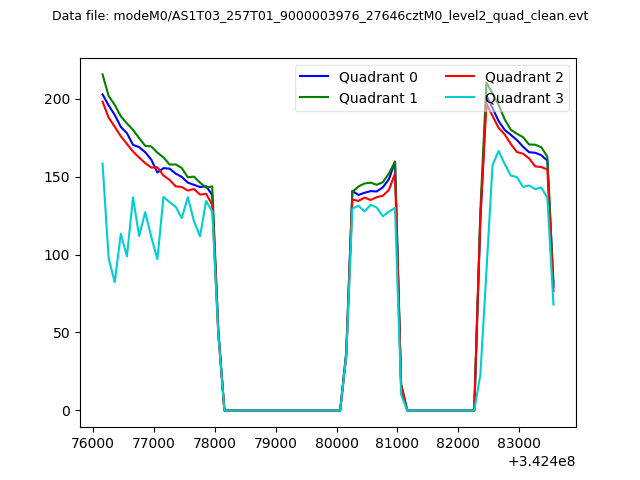 |
|
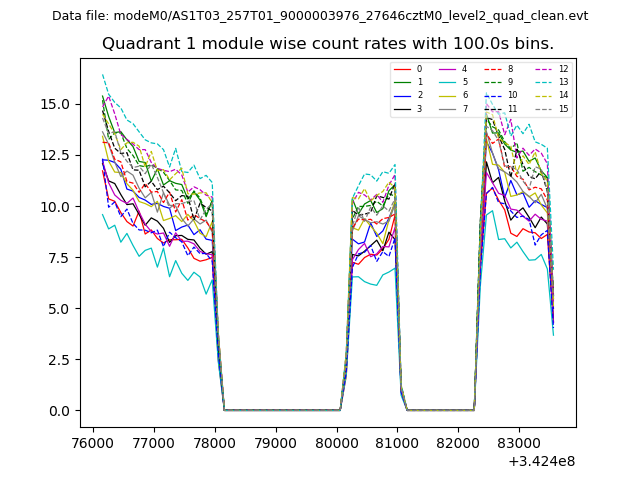
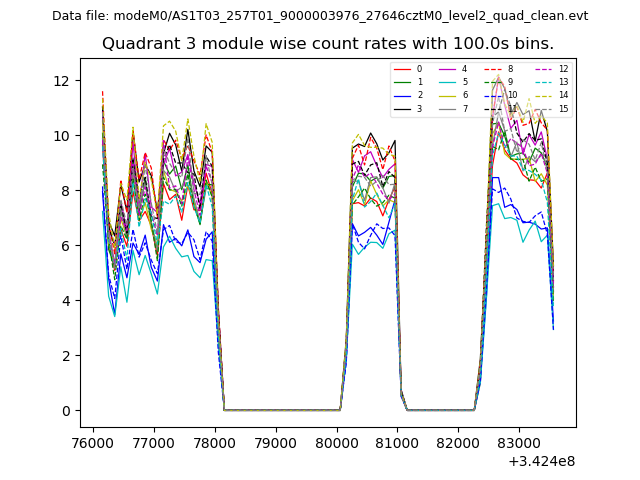
| Module-wise count rates for Quadrant A Data is divided into 100 sec bins |
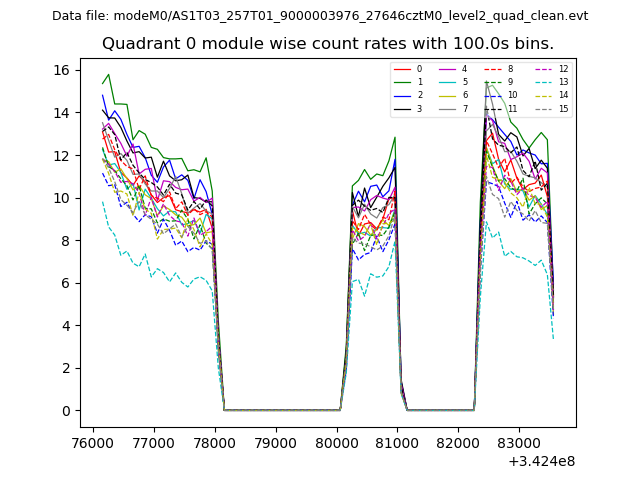 |
 |
| Module-wise count rates for Quadrant B Data is divided into 100 sec bins |
 |
 |
| Module-wise count rates for Quadrant C Data is divided into 100 sec bins |
 |
 |
| Module-wise count rates for Quadrant D Data is divided into 100 sec bins |
 |
 |
| Parameter | Plot |
|---|---|
| CZT HV Monitor | 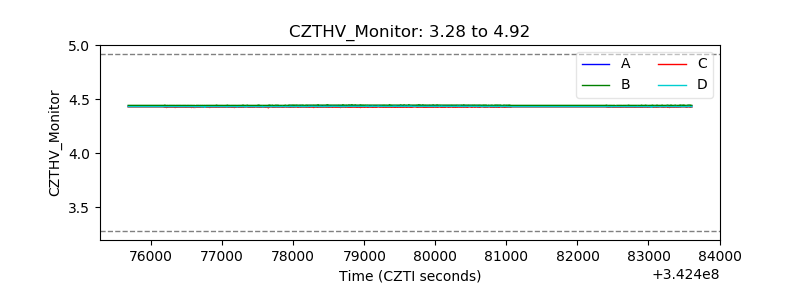 |
| D_VDD | 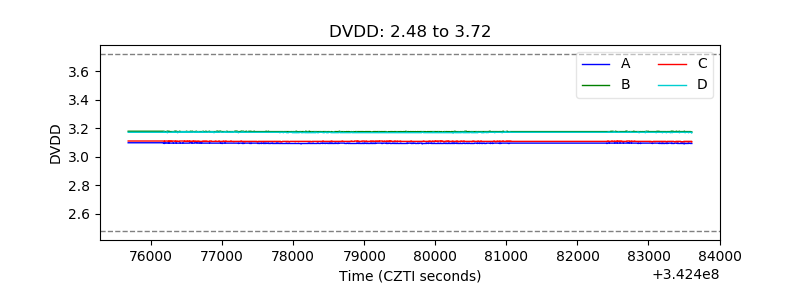 |
| Temperature 1 | 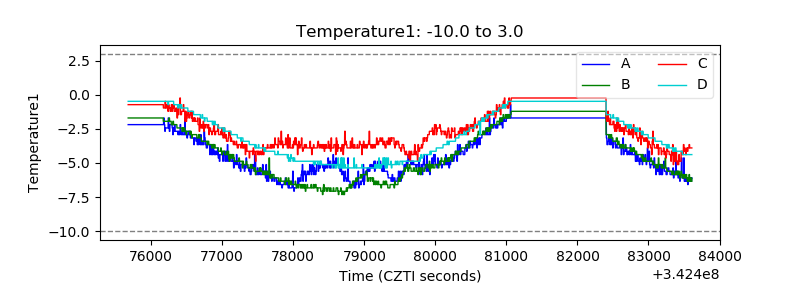 |
| Veto HV Monitor |  |
| Veto LLD | 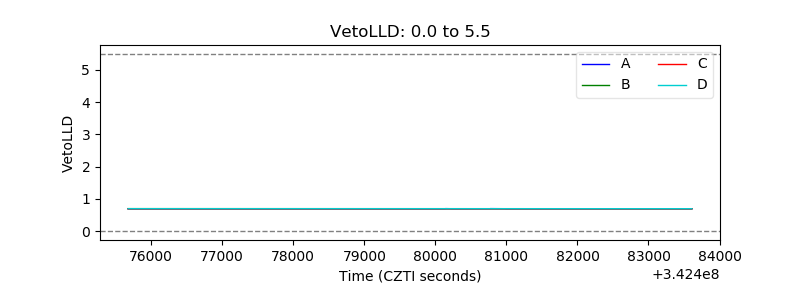 |
| Alpha Counter | 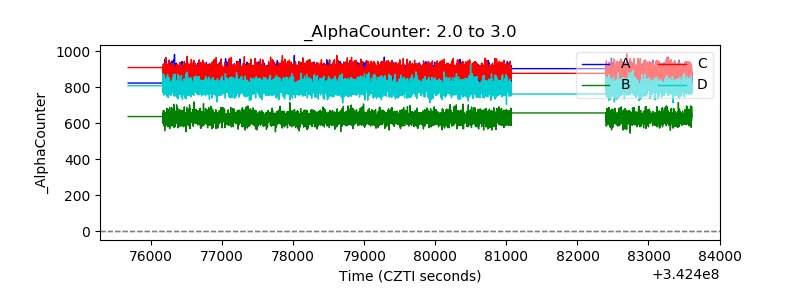 |
| _CPM_Rate | 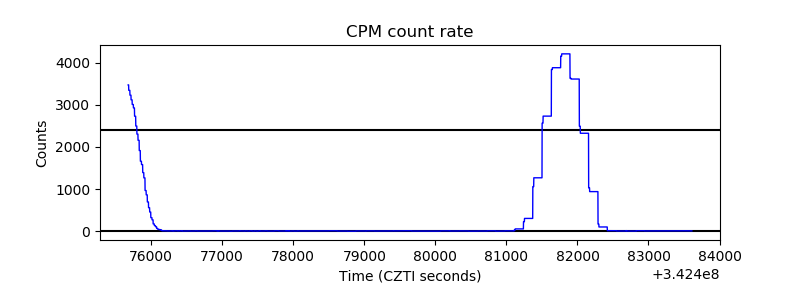 |
| CZT Counter | 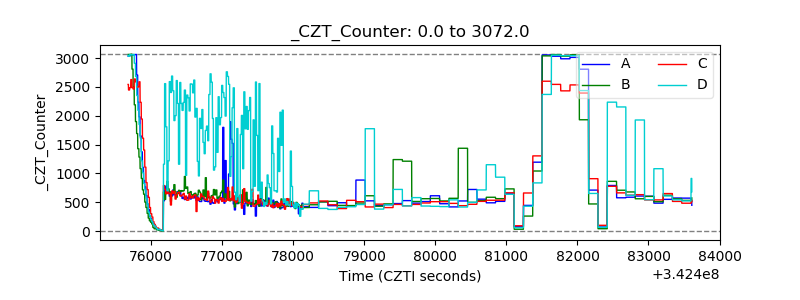 |
| +2.5 Volts monitor |  |
| +5 Volts monitor | 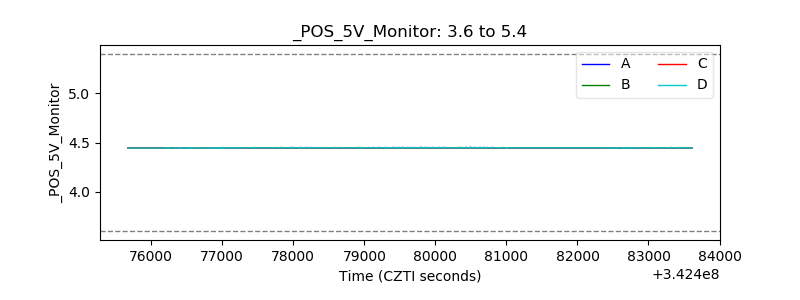 |
| _ROLL_ROT | 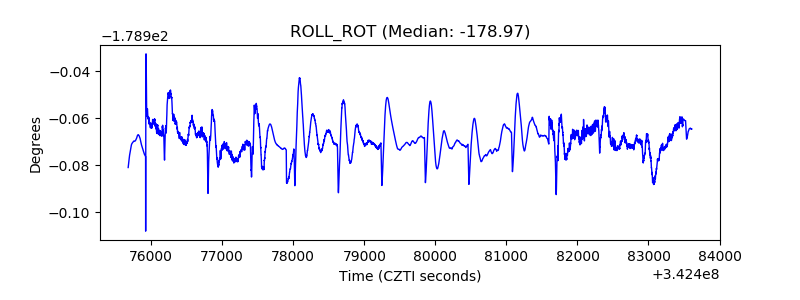 |
| _Roll_DEC |  |
| _Roll_RA | 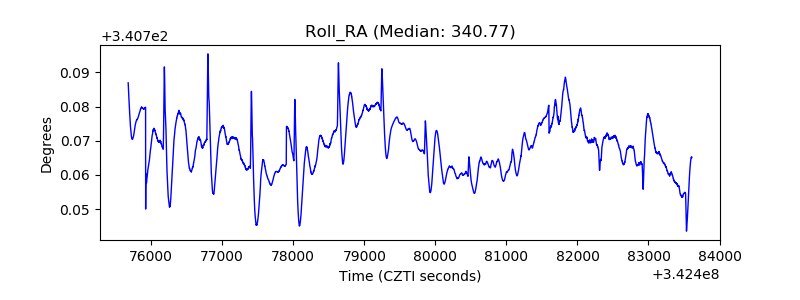 |
| Veto Counter | 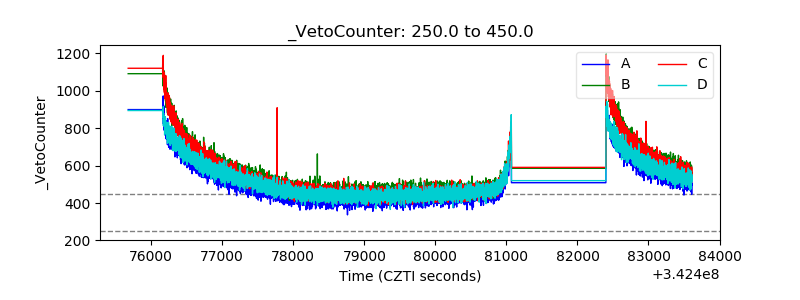 |