| Param | Original file | Final file |
|---|---|---|
| Filename | modeM0/AS1T03_257T01_9000003976_27648cztM0_level2.evt | modeM0/AS1T03_257T01_9000003976_27648cztM0_level2_quad_clean.evt |
| Size (bytes) | 485,991,360 | 84,021,120 |
| Size | 463.5 MB | 80.1 MB |
| Events in quadrant A | 3,396,995 | 540,746 |
| Events in quadrant B | 3,590,653 | 559,259 |
| Events in quadrant C | 3,207,023 | 522,699 |
| Events in quadrant D | 4,099,954 | 485,650 |
| Mode M9 | |||
|---|---|---|---|
| Quadrant | BADHDUFLAG | Total packets | Discarded packets |
| A | 0 | 19 | 0 |
| B | 0 | 20 | 0 |
| C | 0 | 20 | 0 |
| D | 0 | 20 | 0 |
| Mode M0 | |||
|---|---|---|---|
| Quadrant | BADHDUFLAG | Total packets | Discarded packets |
| A | 0 | 13950 | 0 |
| B | 0 | 14468 | 0 |
| C | 0 | 13194 | 0 |
| D | 0 | 16368 | 0 |
| Quadrant | Total seconds | Saturated seconds | Saturation percentage |
|---|---|---|---|
| A | 6248 | 40 | 0.640205% |
| B | 6248 | 93 | 1.488476% |
| C | 6248 | 62 | 0.992318% |
| D | 6248 | 271 | 4.337388% |
Noise dominated data is calculated using 1-second bins in cleaned event files. If a bin has >2000 counts, and if more than 50% of those come from <1% of pixels, then it is considered to be noise-dominated and hence unusable.
| Quadrant | # 1 sec bins | Bins with >0 counts | Bins with >2000 counts | High rate bins dominated by noise | Noise dominated (total time) | Noise dominated (detector-on time) | Marked lightcurve |
|---|---|---|---|---|---|---|---|
| A | 7613 | 6249 | 1 | 1 | 0.01% | 0.02% | 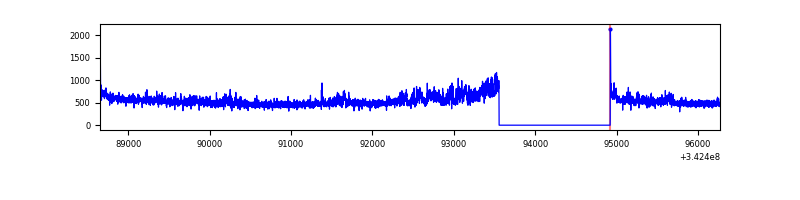 |
| B | 7613 | 6249 | 14 | 14 | 0.18% | 0.22% | 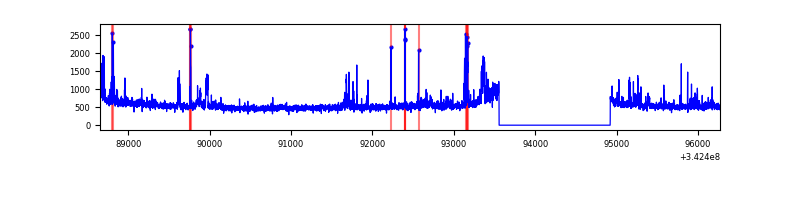 |
| C | 7613 | 6248 | 0 | 0 | 0.00% | 0.00% | 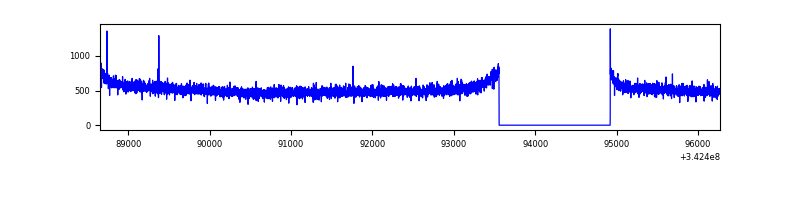 |
| D | 7613 | 6249 | 237 | 237 | 3.11% | 3.79% | 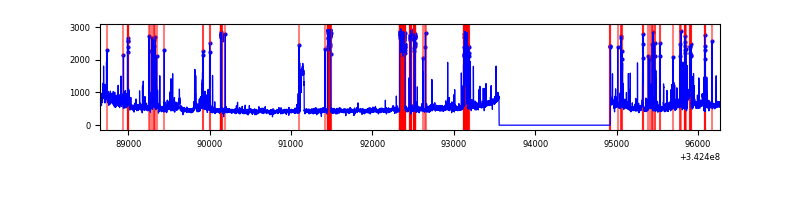 |
Top three noisy pixels from each quadrant. If the there are fewer than three noisy pixels in the level2.evt file, extra rows are filled as -1
| Pixel properties | Quadrant properties | ||||||
|---|---|---|---|---|---|---|---|
| Quadrant | DetID | PixID | Counts | Sigma | Mean | Median | Sigma |
| A | 6 | 16 | 243456 | 1507.16 | 814 | 803 | 161.0 |
| A | 8 | 192 | 11582 | 66.95 | 814 | 803 | 161.0 |
| A | 13 | 254 | 10488 | 60.16 | 814 | 803 | 161.0 |
| B | 10 | 245 | 205037 | 1335.33 | 822 | 804 | 152.9 |
| B | 5 | 255 | 70340 | 454.65 | 822 | 804 | 152.9 |
| B | 15 | 33 | 33776 | 215.58 | 822 | 804 | 152.9 |
| C | 14 | 238 | 128830 | 691.57 | 788 | 795 | 185.1 |
| C | 2 | 16 | 6728 | 32.05 | 788 | 795 | 185.1 |
| C | 13 | 61 | 5292 | 24.29 | 788 | 795 | 185.1 |
| D | 1 | 52 | 827780 | 4570.35 | 760 | 742 | 181.0 |
| D | 11 | 176 | 164410 | 904.46 | 760 | 742 | 181.0 |
| D | 7 | 80 | 85687 | 469.42 | 760 | 742 | 181.0 |
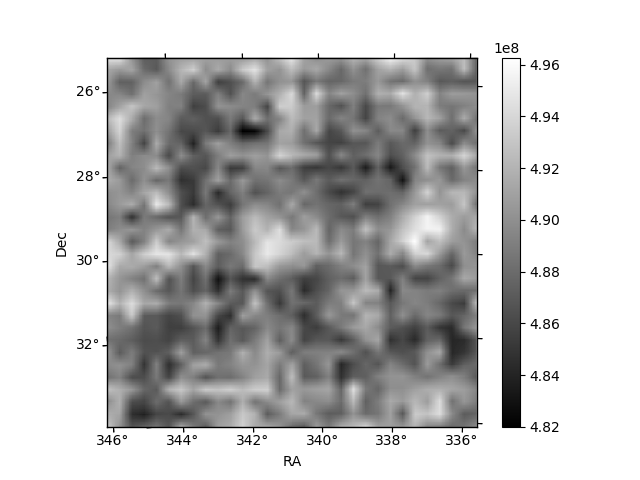
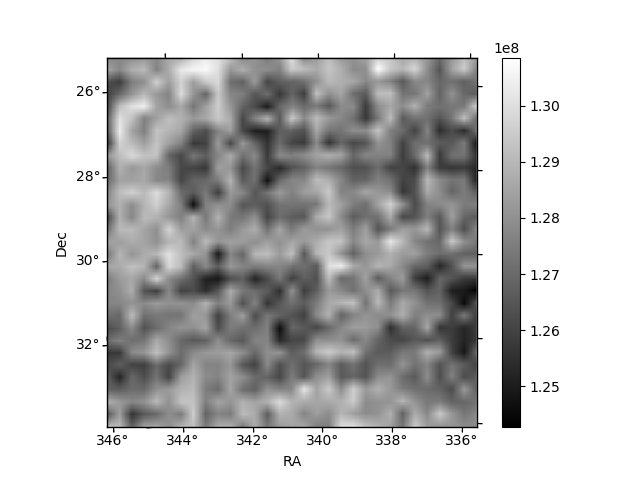
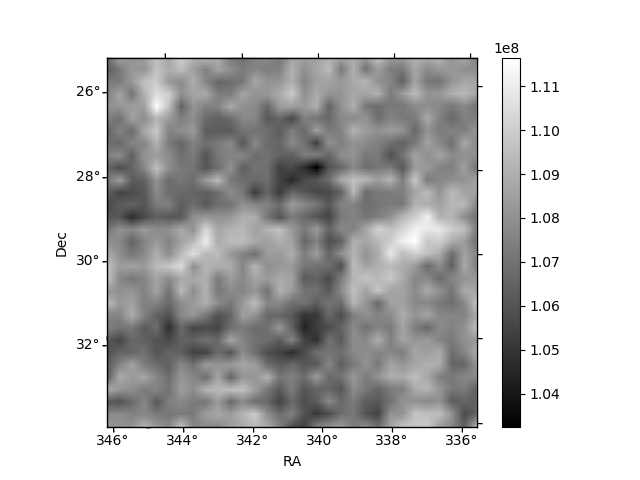
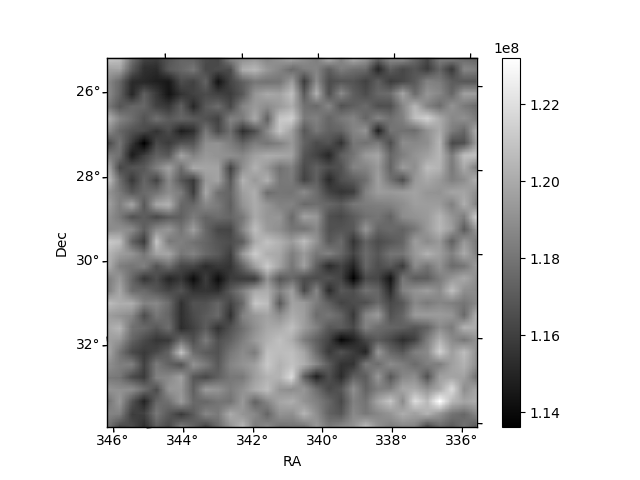
Histogram calculated using DETX and DETY for each event in the final _common_clean file
| Quadrant A | 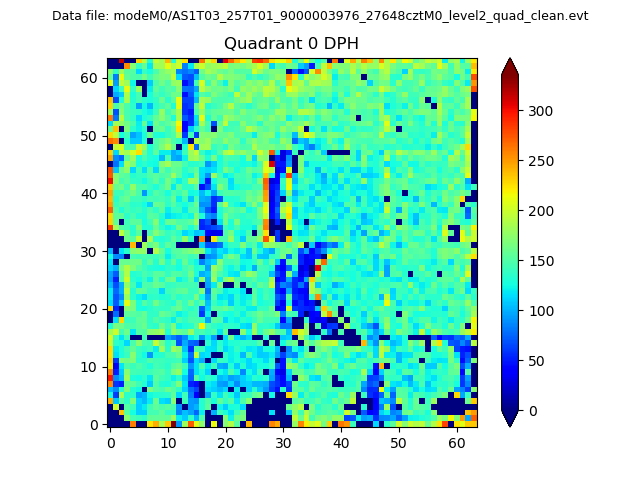 |
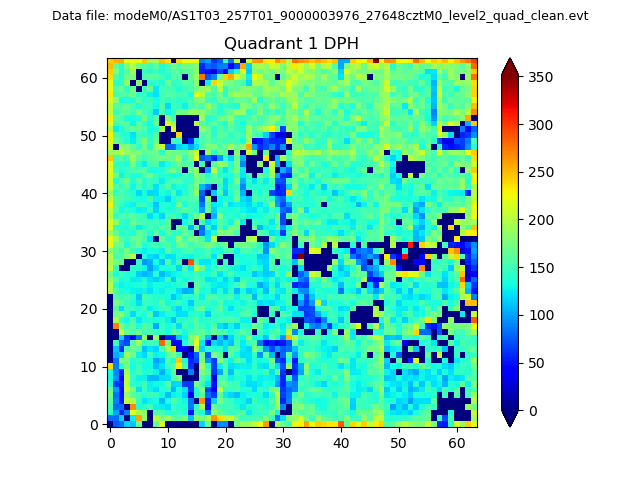 |
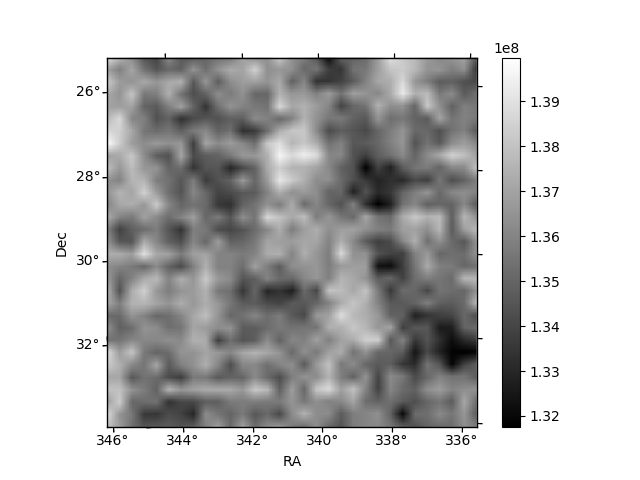
Quadrant B |
|---|---|---|---|
| Quadrant D | 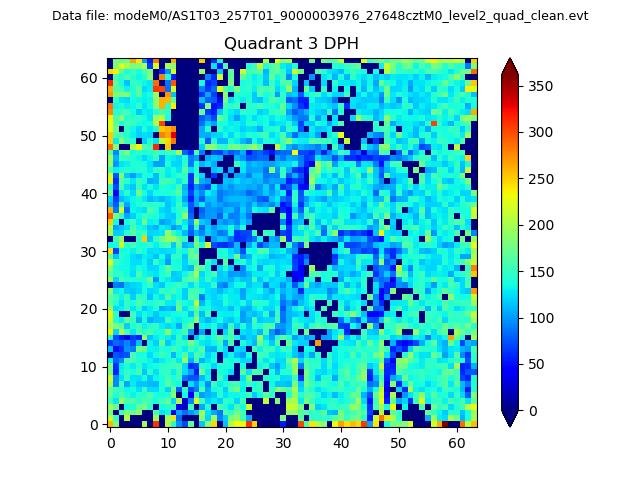 |
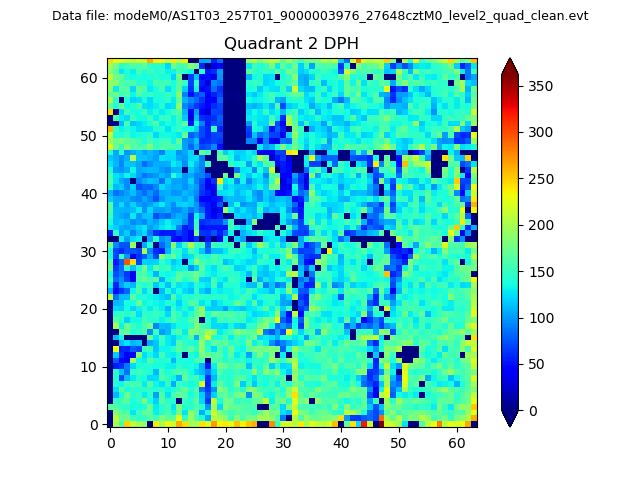 |
Quadrant C |
| Plot type | Count rate plots | Images |
|---|---|---|
| Comparison with Poisson distribution Blue bars denote a histogram of data divided into 1 sec bins. Red curve is a Poisson curve with rate = median count rate of data. |
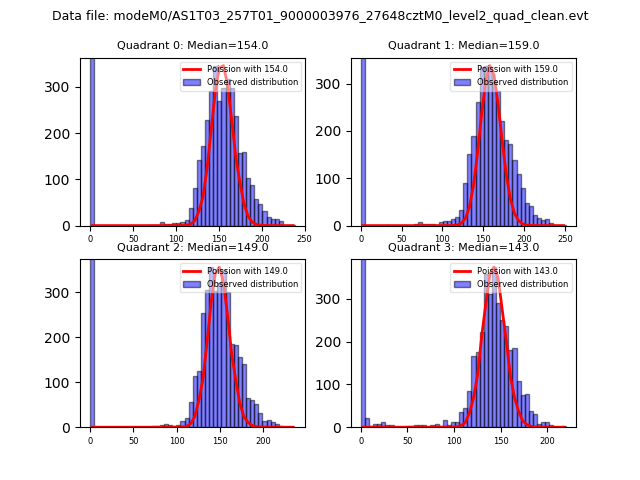 |
 |
| Quadrant-wise count rates Data is divided into 100 sec bins |
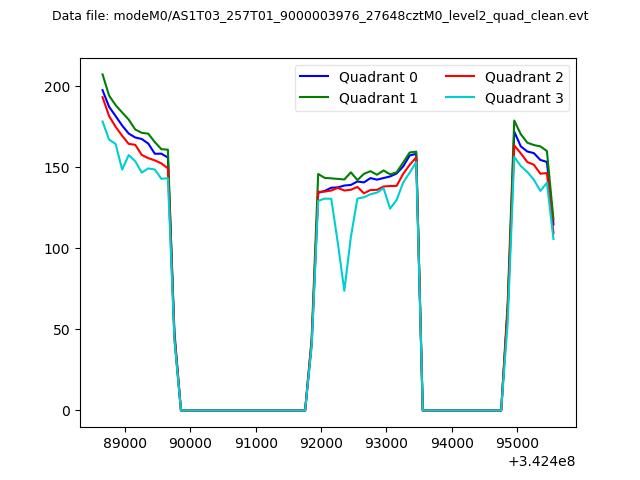 |
|
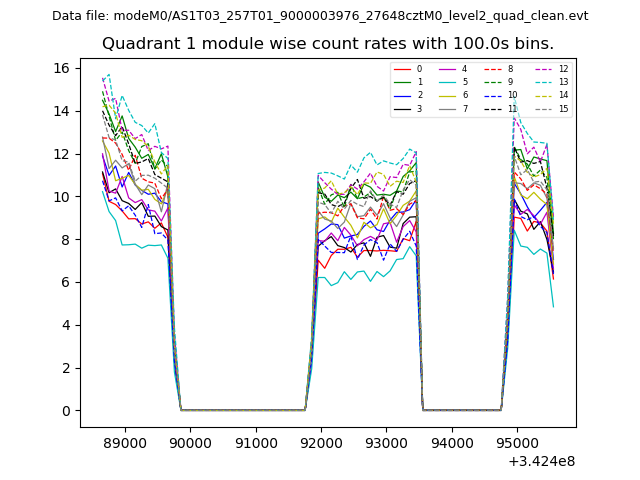
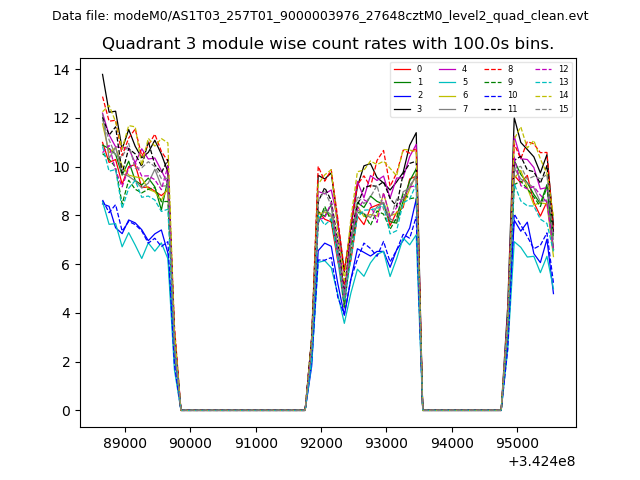
| Module-wise count rates for Quadrant A Data is divided into 100 sec bins |
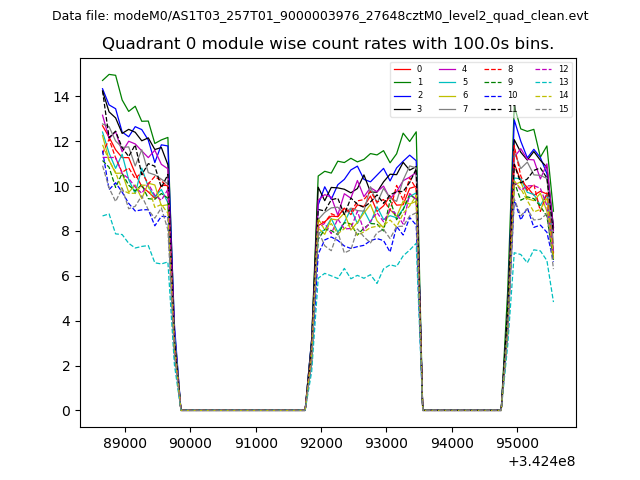 |
 |
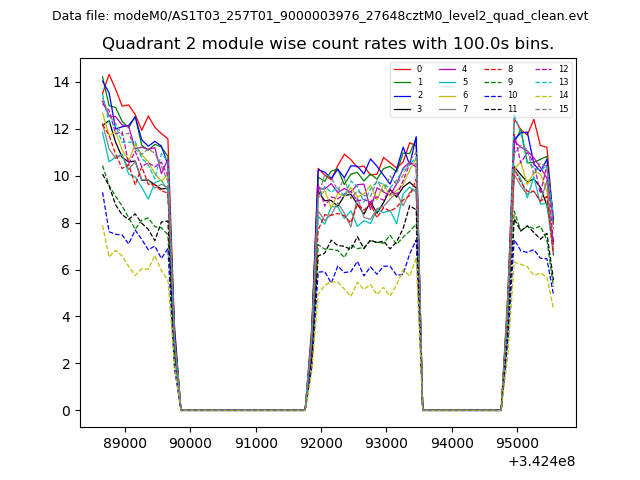
| Module-wise count rates for Quadrant B Data is divided into 100 sec bins |
 |
 |
| Module-wise count rates for Quadrant C Data is divided into 100 sec bins |
 |
 |
| Module-wise count rates for Quadrant D Data is divided into 100 sec bins |
 |
 |
| Parameter | Plot |
|---|---|
| CZT HV Monitor | 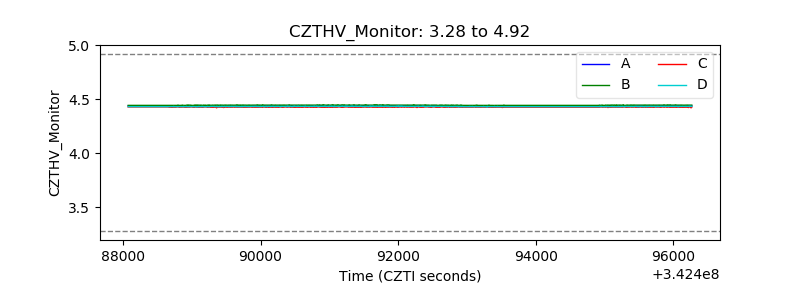 |
| D_VDD | 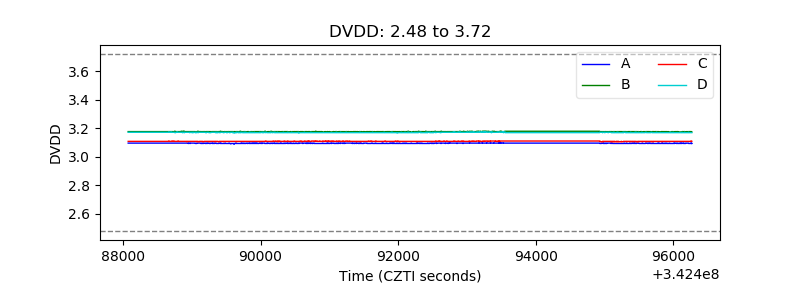 |
| Temperature 1 | 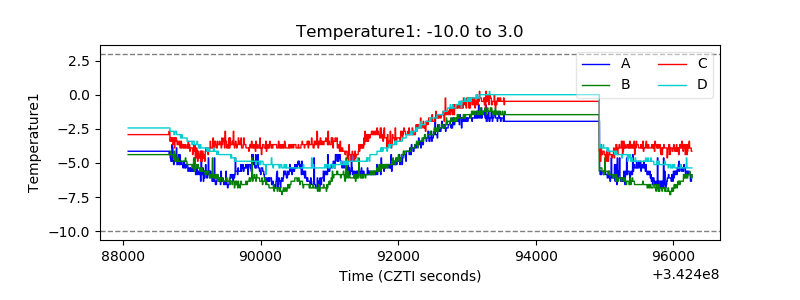 |
| Veto HV Monitor | 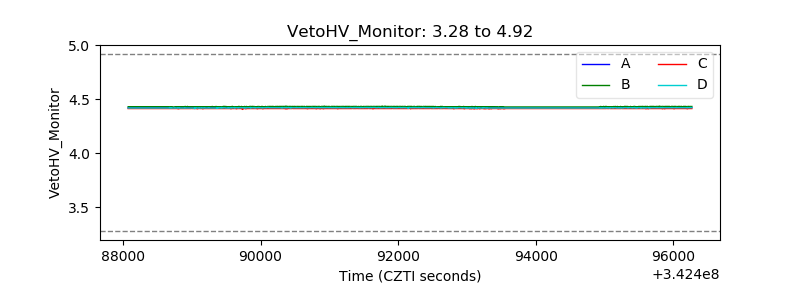 |
| Veto LLD | 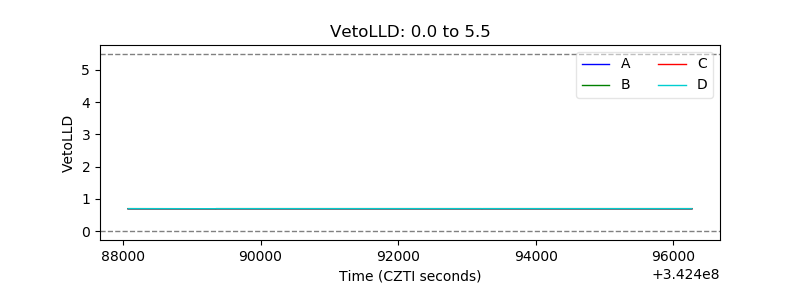 |
| Alpha Counter | 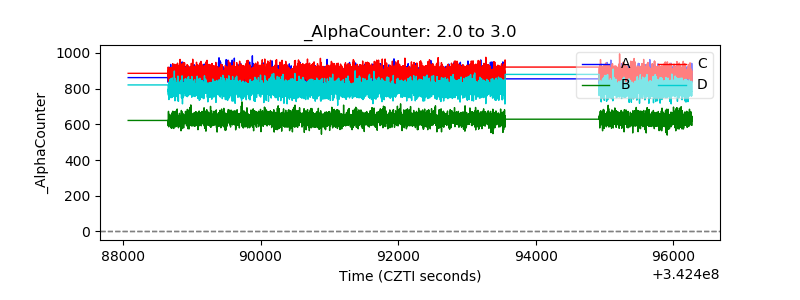 |
| _CPM_Rate | 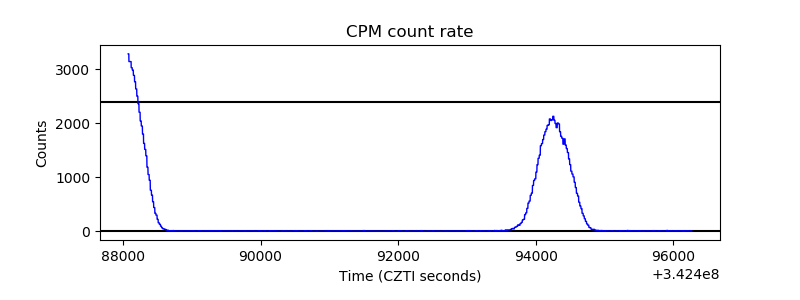 |
| CZT Counter | 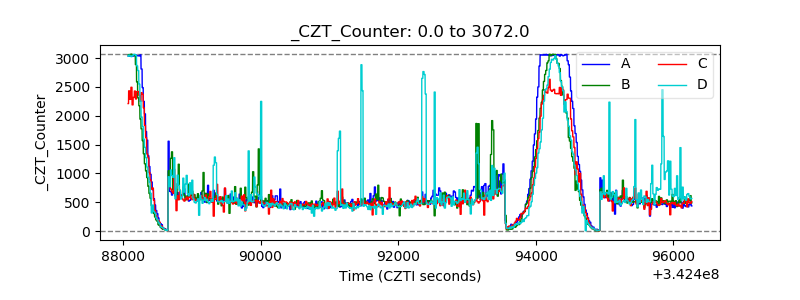 |
| +2.5 Volts monitor |  |
| +5 Volts monitor |  |
| _ROLL_ROT | 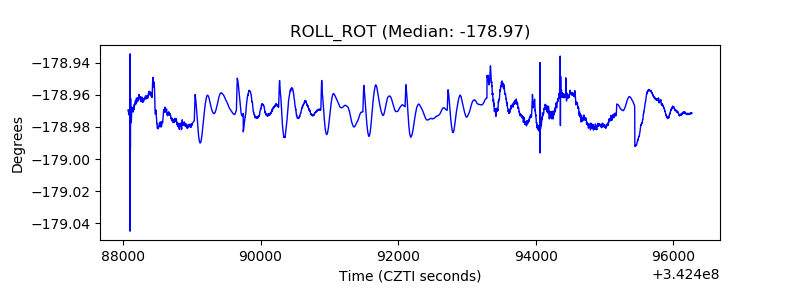 |
| _Roll_DEC | 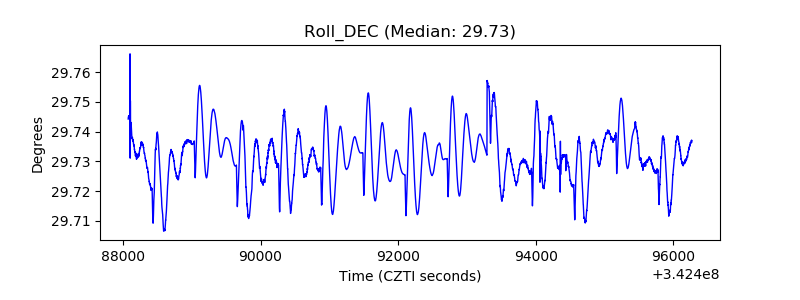 |
| _Roll_RA | 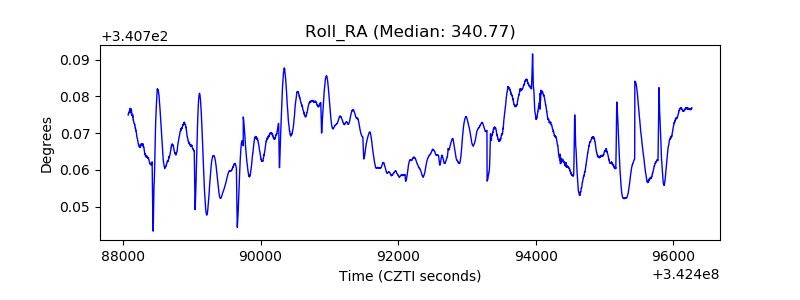 |
| Veto Counter | 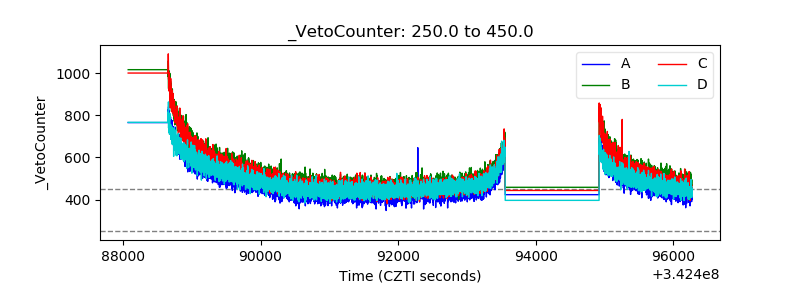 |