| Param | Original file | Final file |
|---|---|---|
| Filename | modeM0/AS1T03_257T01_9000003976_27649cztM0_level2.evt | modeM0/AS1T03_257T01_9000003976_27649cztM0_level2_quad_clean.evt |
| Size (bytes) | 574,945,920 | 76,904,640 |
| Size | 548.3 MB | 73.3 MB |
| Events in quadrant A | 3,413,028 | 488,335 |
| Events in quadrant B | 3,680,856 | 502,182 |
| Events in quadrant C | 3,372,799 | 471,435 |
| Events in quadrant D | 6,491,128 | 399,125 |
| Mode M9 | |||
|---|---|---|---|
| Quadrant | BADHDUFLAG | Total packets | Discarded packets |
| A | 0 | 12 | 0 |
| B | 0 | 13 | 0 |
| C | 0 | 13 | 0 |
| D | 0 | 13 | 0 |
| Mode M0 | |||
|---|---|---|---|
| Quadrant | BADHDUFLAG | Total packets | Discarded packets |
| A | 0 | 14256 | 0 |
| B | 0 | 14969 | 0 |
| C | 0 | 14013 | 0 |
| D | 0 | 23876 | 0 |
| Quadrant | Total seconds | Saturated seconds | Saturation percentage |
|---|---|---|---|
| A | 6704 | 92 | 1.372315% |
| B | 6704 | 136 | 2.028640% |
| C | 6704 | 116 | 1.730310% |
| D | 6704 | 1017 | 15.170048% |
Noise dominated data is calculated using 1-second bins in cleaned event files. If a bin has >2000 counts, and if more than 50% of those come from <1% of pixels, then it is considered to be noise-dominated and hence unusable.
| Quadrant | # 1 sec bins | Bins with >0 counts | Bins with >2000 counts | High rate bins dominated by noise | Noise dominated (total time) | Noise dominated (detector-on time) | Marked lightcurve |
|---|---|---|---|---|---|---|---|
| A | 7759 | 6704 | 1 | 1 | 0.01% | 0.01% | 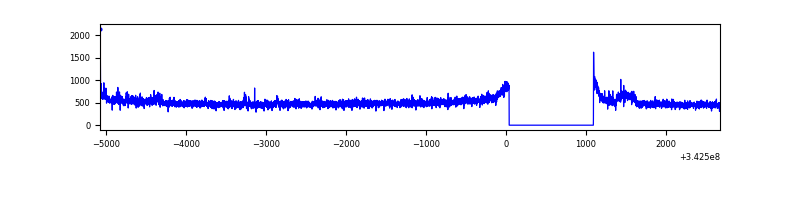 |
| B | 7759 | 6704 | 13 | 13 | 0.17% | 0.19% | 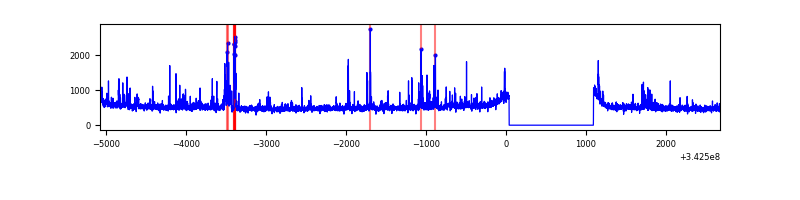 |
| C | 7759 | 6704 | 1 | 1 | 0.01% | 0.01% | 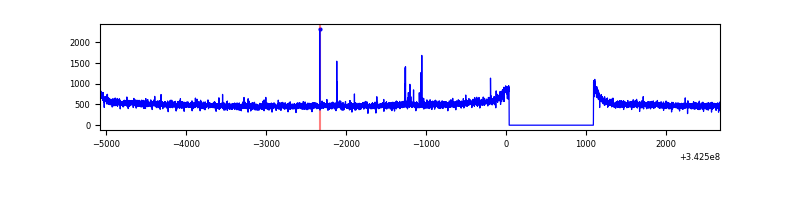 |
| D | 7759 | 6704 | 631 | 631 | 8.13% | 9.41% | 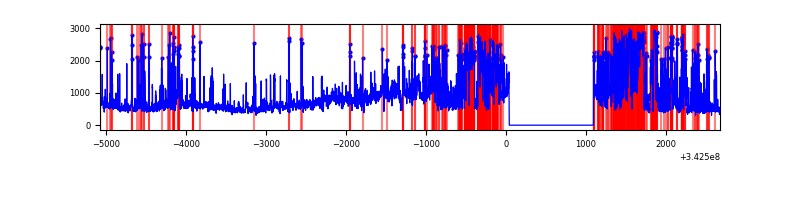 |
Top three noisy pixels from each quadrant. If the there are fewer than three noisy pixels in the level2.evt file, extra rows are filled as -1
| Pixel properties | Quadrant properties | ||||||
|---|---|---|---|---|---|---|---|
| Quadrant | DetID | PixID | Counts | Sigma | Mean | Median | Sigma |
| A | 6 | 16 | 100221 | 579.54 | 856 | 839 | 171.5 |
| A | 13 | 254 | 10526 | 56.49 | 856 | 839 | 171.5 |
| A | 8 | 192 | 9631 | 51.27 | 856 | 839 | 171.5 |
| B | 5 | 255 | 157590 | 961.62 | 858 | 836 | 163.0 |
| B | 10 | 245 | 115899 | 705.87 | 858 | 836 | 163.0 |
| B | 15 | 32 | 23529 | 139.21 | 858 | 836 | 163.0 |
| C | 14 | 238 | 132092 | 673.64 | 825 | 832 | 194.9 |
| C | 2 | 16 | 26687 | 132.69 | 825 | 832 | 194.9 |
| C | 13 | 61 | 5513 | 24.02 | 825 | 832 | 194.9 |
| D | 1 | 52 | 3239428 | 18195.73 | 749 | 729 | 178.0 |
| D | 11 | 176 | 161402 | 902.7 | 749 | 729 | 178.0 |
| D | 12 | 233 | 86898 | 484.12 | 749 | 729 | 178.0 |
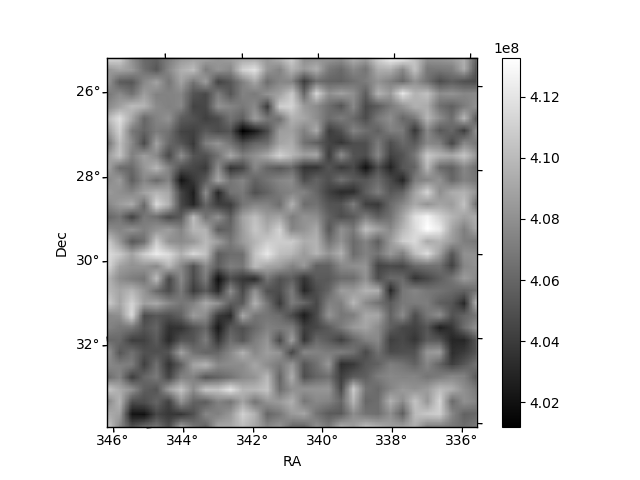
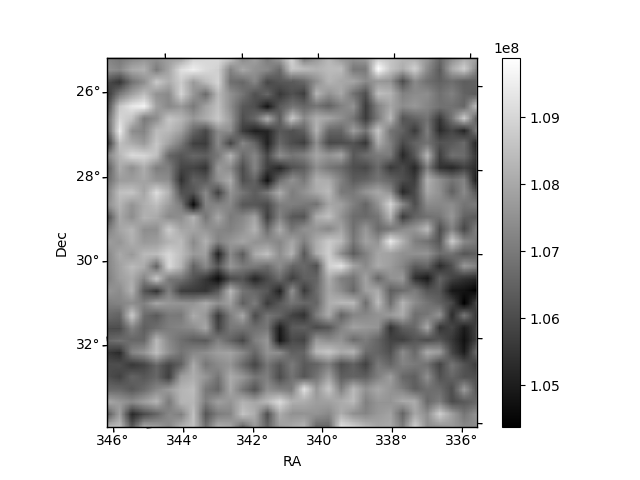
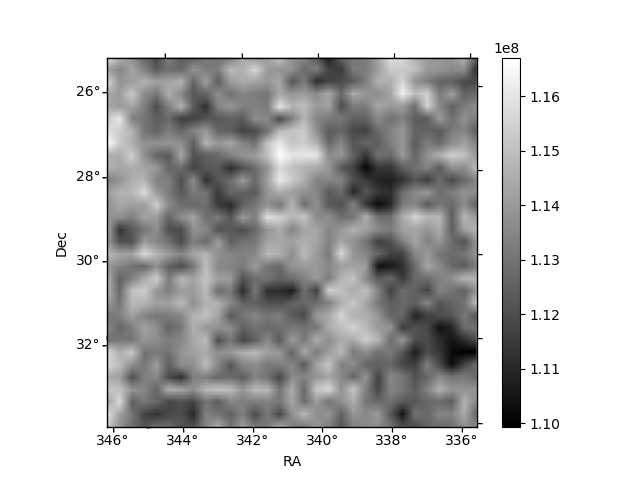
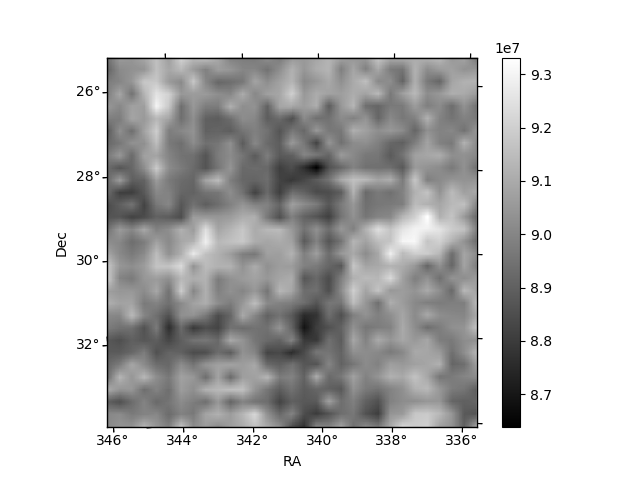
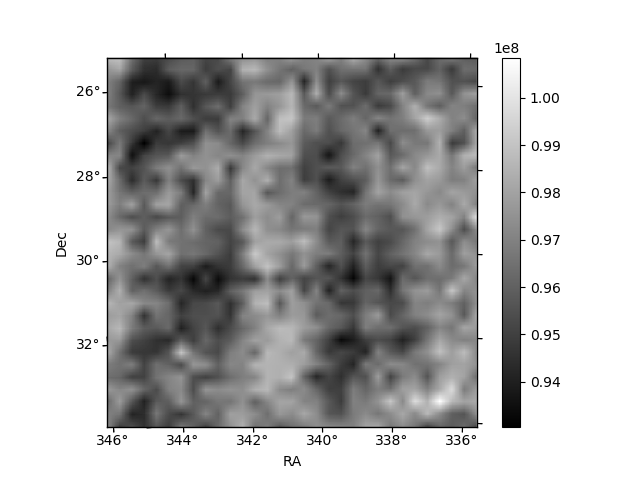
Histogram calculated using DETX and DETY for each event in the final _common_clean file
| Quadrant A | 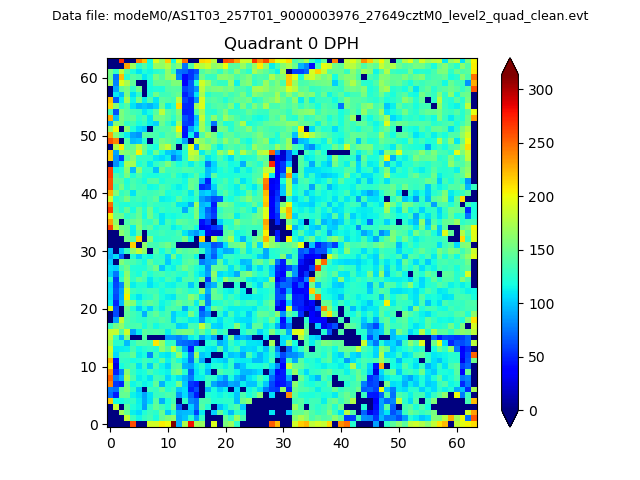 |
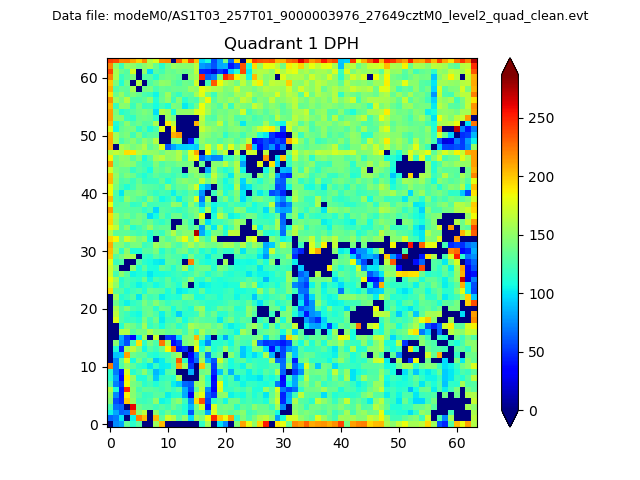 |
Quadrant B |
|---|---|---|---|
| Quadrant D | 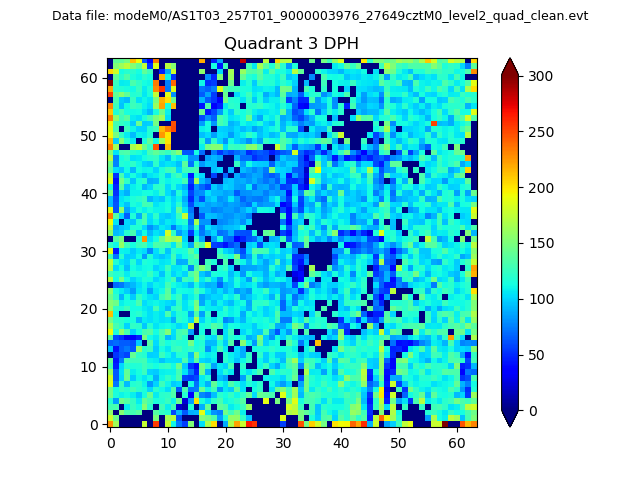 |
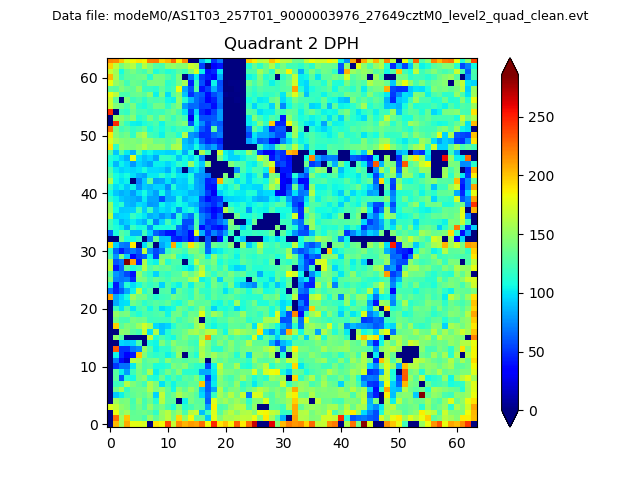 |
Quadrant C |
| Plot type | Count rate plots | Images |
|---|---|---|
| Comparison with Poisson distribution Blue bars denote a histogram of data divided into 1 sec bins. Red curve is a Poisson curve with rate = median count rate of data. |
 |
 |
| Quadrant-wise count rates Data is divided into 100 sec bins |
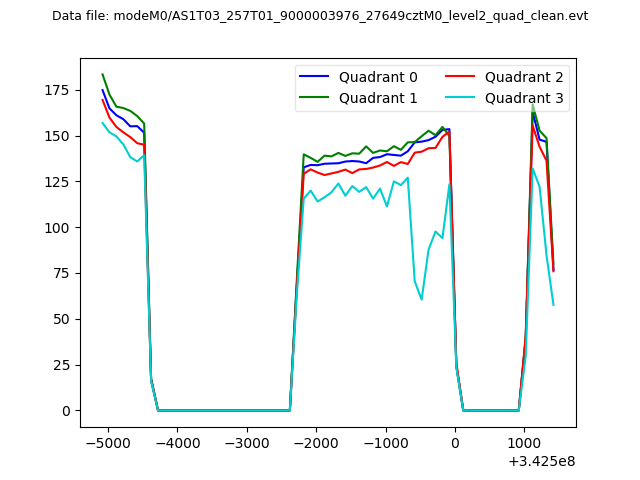 |
|
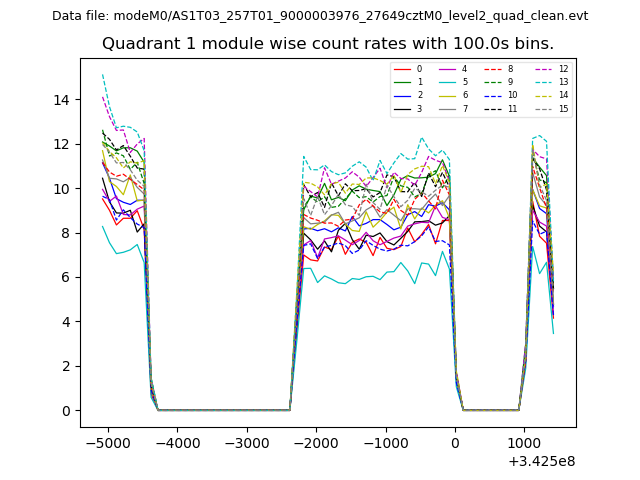
| Module-wise count rates for Quadrant A Data is divided into 100 sec bins |
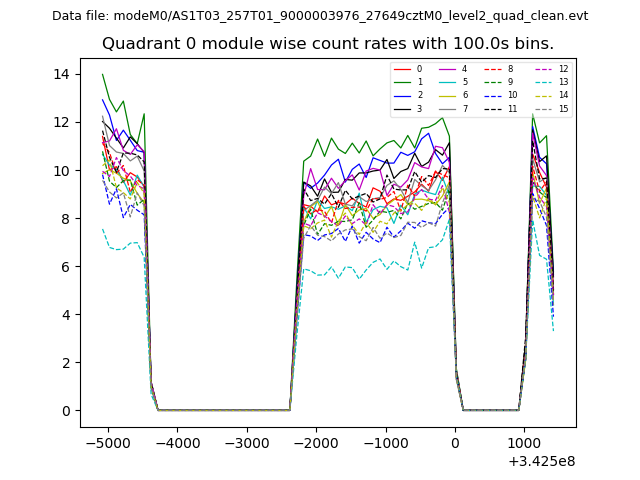 |
 |
| Module-wise count rates for Quadrant B Data is divided into 100 sec bins |
 |
 |
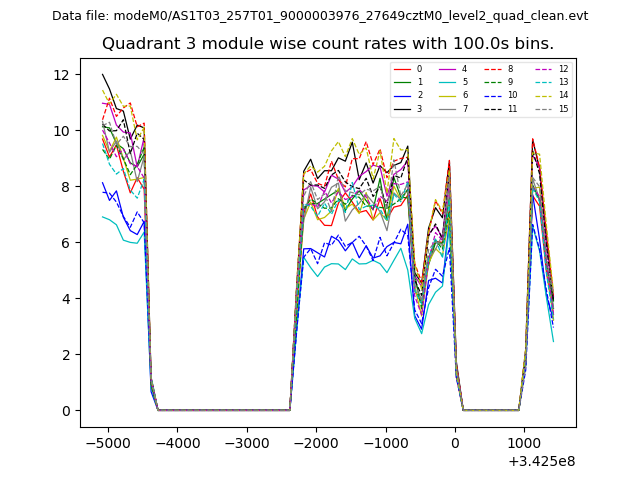
| Module-wise count rates for Quadrant C Data is divided into 100 sec bins |
 |
 |
| Module-wise count rates for Quadrant D Data is divided into 100 sec bins |
 |
 |
| Parameter | Plot |
|---|---|
| CZT HV Monitor |  |
| D_VDD | 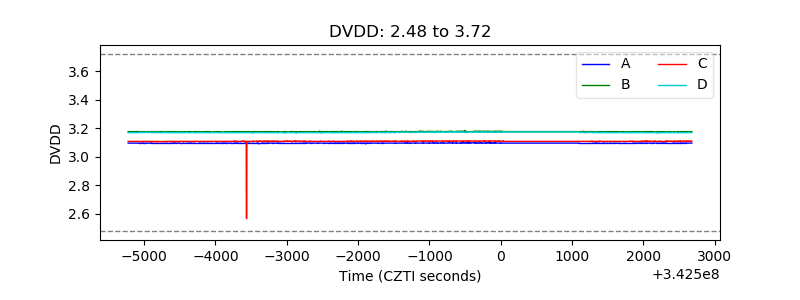 |
| Temperature 1 | 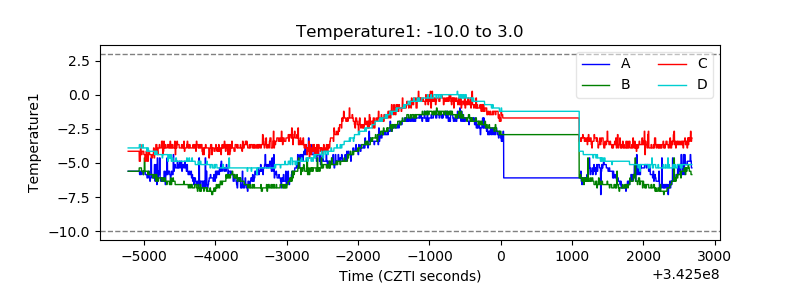 |
| Veto HV Monitor |  |
| Veto LLD | 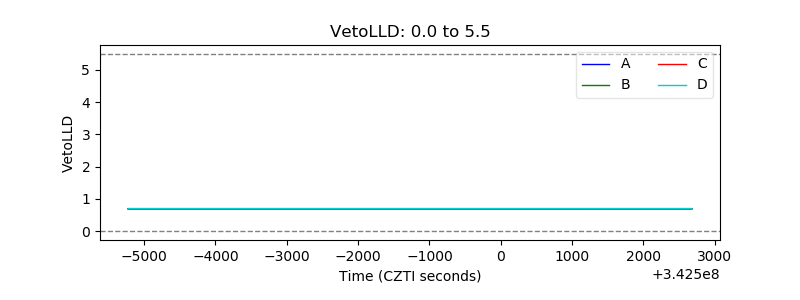 |
| Alpha Counter | 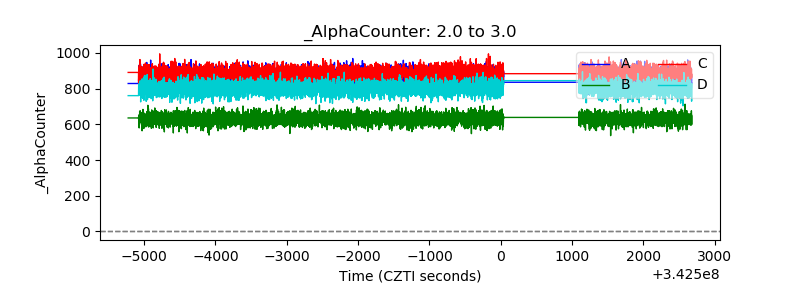 |
| _CPM_Rate | 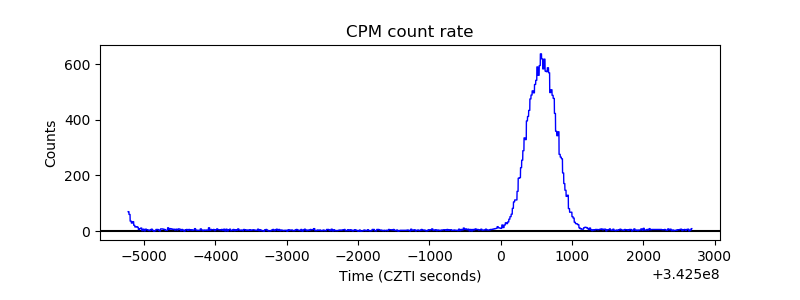 |
| CZT Counter | 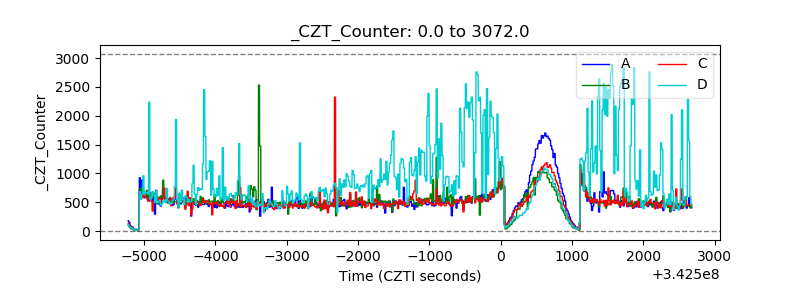 |
| +2.5 Volts monitor |  |
| +5 Volts monitor |  |
| _ROLL_ROT | 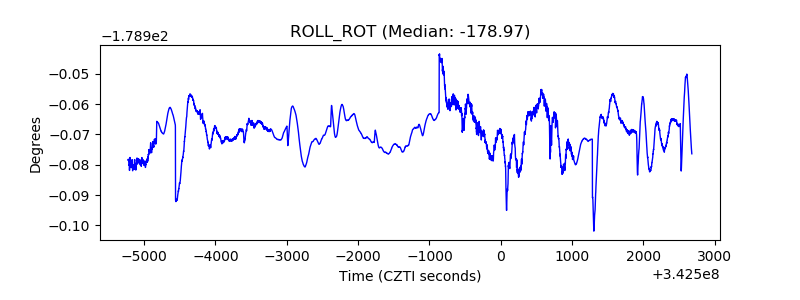 |
| _Roll_DEC | 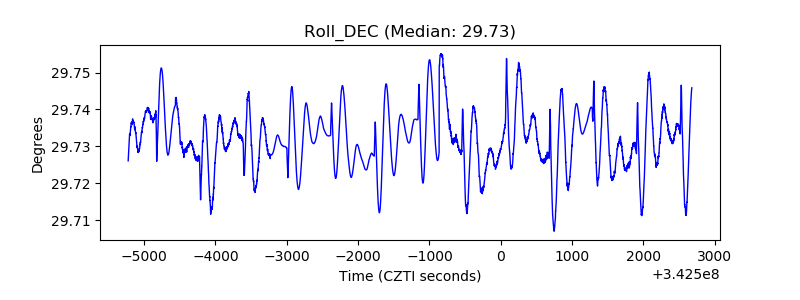 |
| _Roll_RA | 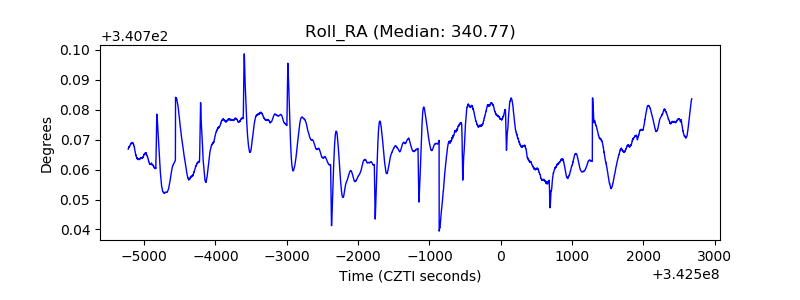 |
| Veto Counter | 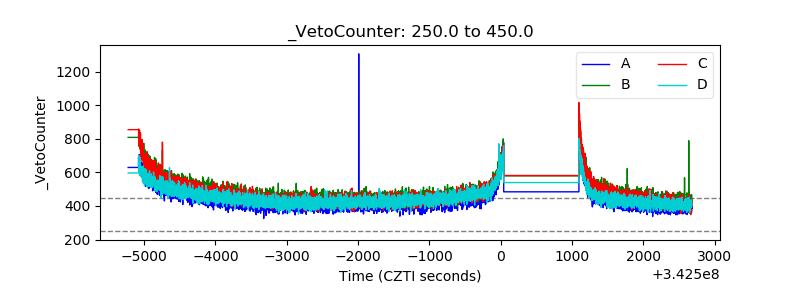 |