| Param | Original file | Final file |
|---|---|---|
| Filename | modeM0/AS1T03_257T01_9000003976_27650cztM0_level2.evt | modeM0/AS1T03_257T01_9000003976_27650cztM0_level2_quad_clean.evt |
| Size (bytes) | 663,900,480 | 74,672,640 |
| Size | 633.1 MB | 71.2 MB |
| Events in quadrant A | 3,577,223 | 465,147 |
| Events in quadrant B | 4,280,355 | 470,271 |
| Events in quadrant C | 3,493,294 | 453,702 |
| Events in quadrant D | 8,271,878 | 374,272 |
| Mode M9 | |||
|---|---|---|---|
| Quadrant | BADHDUFLAG | Total packets | Discarded packets |
| A | 0 | 18 | 0 |
| B | 0 | 18 | 0 |
| C | 0 | 18 | 0 |
| D | 0 | 18 | 0 |
| Mode M0 | |||
|---|---|---|---|
| Quadrant | BADHDUFLAG | Total packets | Discarded packets |
| A | 0 | 15253 | 0 |
| B | 0 | 17183 | 0 |
| C | 0 | 14757 | 0 |
| D | 0 | 29412 | 0 |
| Quadrant | Total seconds | Saturated seconds | Saturation percentage |
|---|---|---|---|
| A | 7140 | 136 | 1.904762% |
| B | 7141 | 303 | 4.243103% |
| C | 7141 | 156 | 2.184568% |
| D | 7141 | 1666 | 23.330066% |
Noise dominated data is calculated using 1-second bins in cleaned event files. If a bin has >2000 counts, and if more than 50% of those come from <1% of pixels, then it is considered to be noise-dominated and hence unusable.
| Quadrant | # 1 sec bins | Bins with >0 counts | Bins with >2000 counts | High rate bins dominated by noise | Noise dominated (total time) | Noise dominated (detector-on time) | Marked lightcurve |
|---|---|---|---|---|---|---|---|
| A | 8930 | 7141 | 0 | 0 | 0.00% | 0.00% | 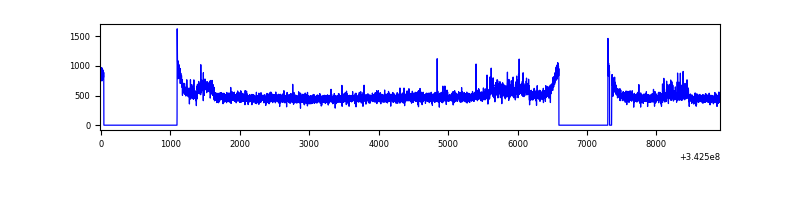 |
| B | 8931 | 7141 | 100 | 100 | 1.12% | 1.40% | 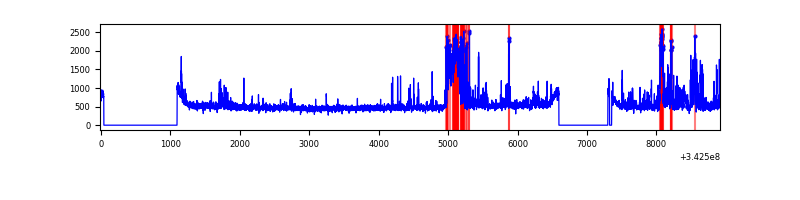 |
| C | 8931 | 7141 | 0 | 0 | 0.00% | 0.00% | 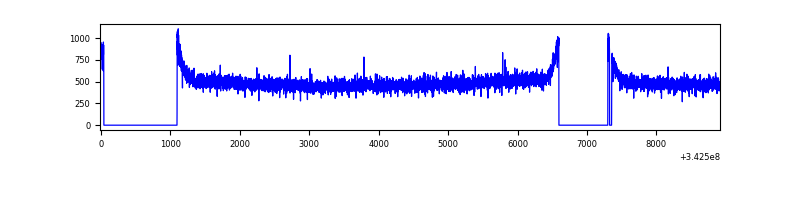 |
| D | 8931 | 7142 | 1363 | 1363 | 15.26% | 19.08% | 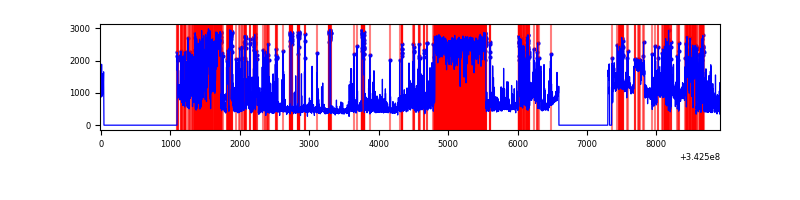 |
Top three noisy pixels from each quadrant. If the there are fewer than three noisy pixels in the level2.evt file, extra rows are filled as -1
| Pixel properties | Quadrant properties | ||||||
|---|---|---|---|---|---|---|---|
| Quadrant | DetID | PixID | Counts | Sigma | Mean | Median | Sigma |
| A | 6 | 16 | 134915 | 746.75 | 891 | 872 | 179.5 |
| A | 13 | 254 | 11228 | 57.69 | 891 | 872 | 179.5 |
| A | 3 | 137 | 8596 | 43.03 | 891 | 872 | 179.5 |
| B | 10 | 245 | 457672 | 2685.81 | 888 | 863 | 170.1 |
| B | 5 | 255 | 193091 | 1130.21 | 888 | 863 | 170.1 |
| B | 15 | 32 | 78915 | 458.91 | 888 | 863 | 170.1 |
| C | 14 | 238 | 136687 | 669.64 | 860 | 866 | 202.8 |
| C | 13 | 61 | 5836 | 24.5 | 860 | 866 | 202.8 |
| C | 7 | 247 | 3649 | 13.72 | 860 | 866 | 202.8 |
| D | 1 | 52 | 4814669 | 26127.14 | 770 | 749 | 184.2 |
| D | 11 | 176 | 202055 | 1092.57 | 770 | 749 | 184.2 |
| D | 12 | 233 | 166689 | 900.63 | 770 | 749 | 184.2 |
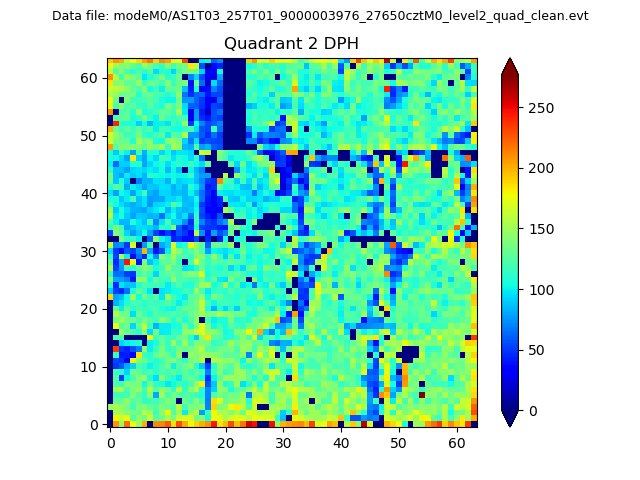
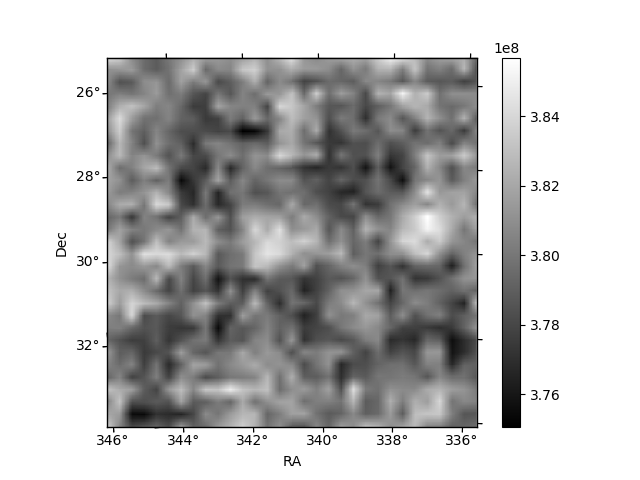
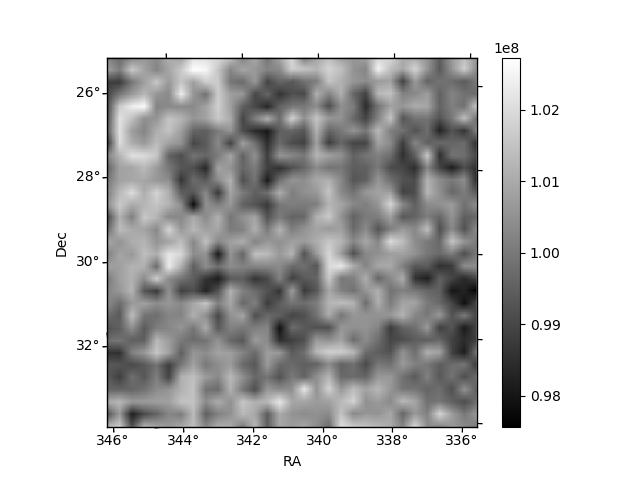
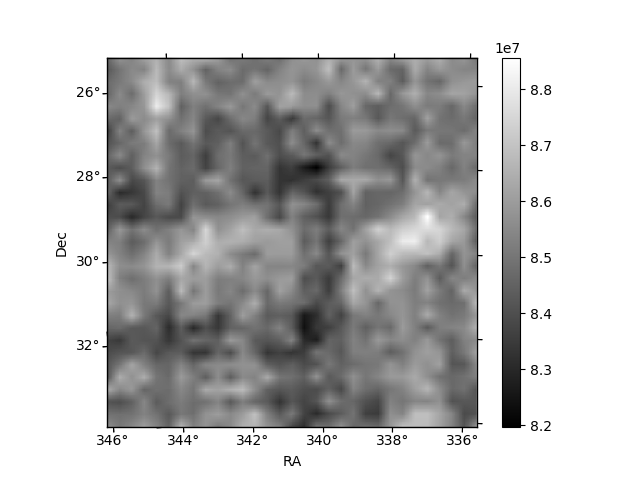
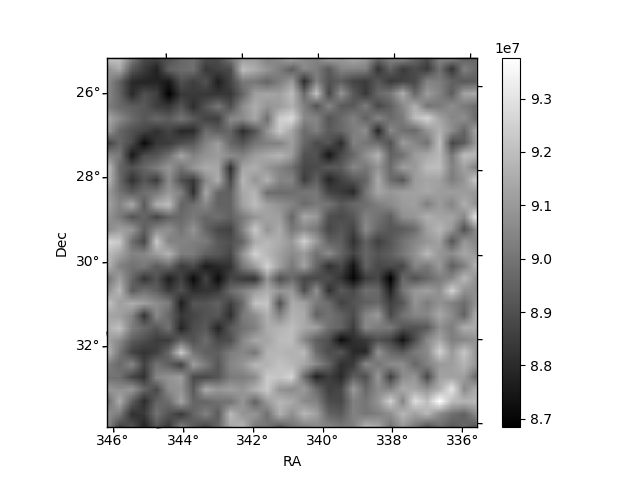
Histogram calculated using DETX and DETY for each event in the final _common_clean file
| Quadrant A | 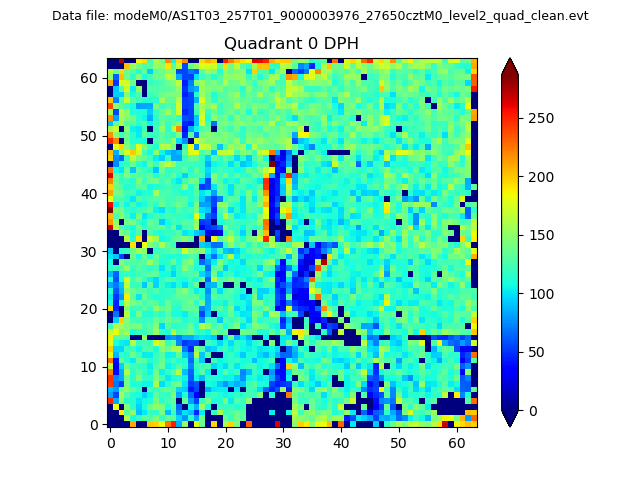 |
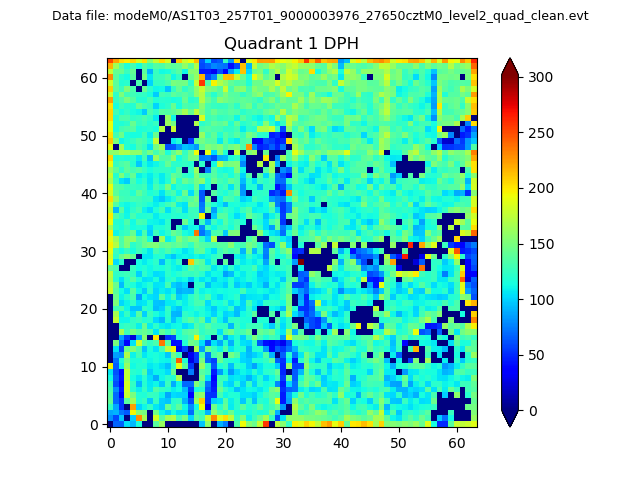 |
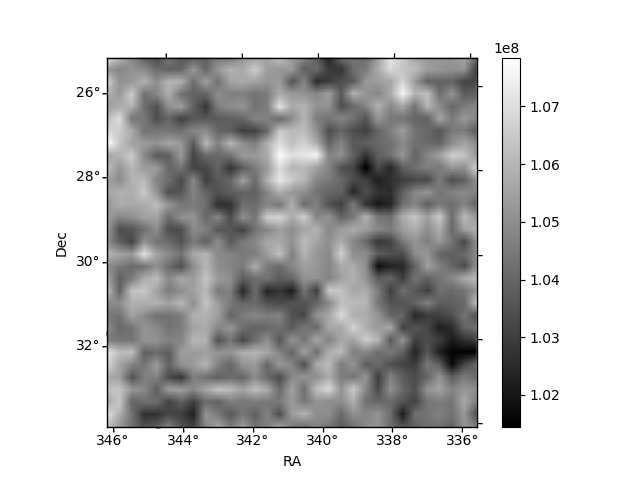
Quadrant B |
|---|---|---|---|
| Quadrant D | 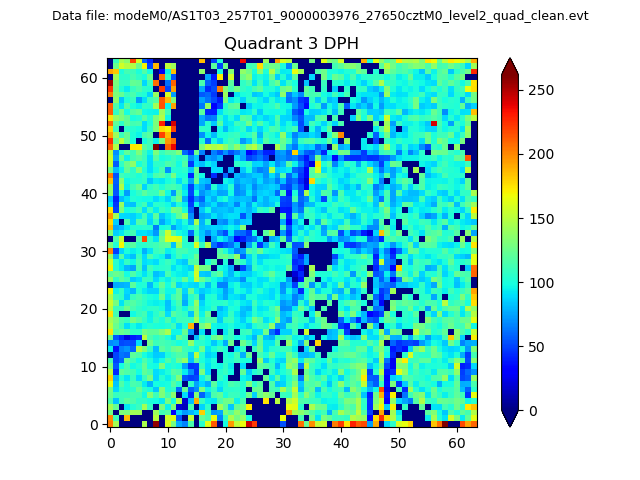 |
 |
Quadrant C |
| Plot type | Count rate plots | Images |
|---|---|---|
| Comparison with Poisson distribution Blue bars denote a histogram of data divided into 1 sec bins. Red curve is a Poisson curve with rate = median count rate of data. |
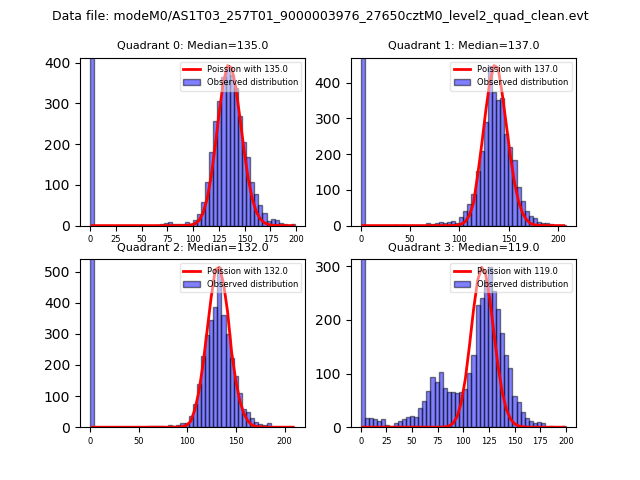 |
 |
| Quadrant-wise count rates Data is divided into 100 sec bins |
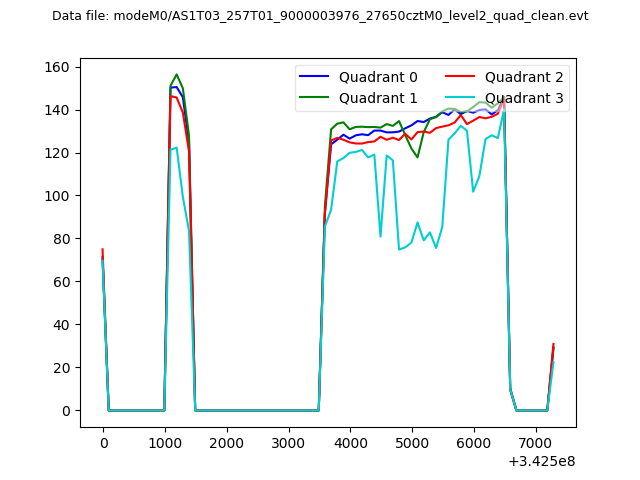 |
|
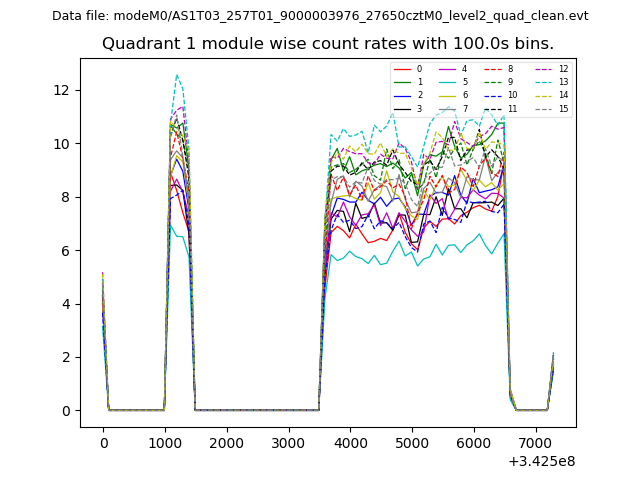
| Module-wise count rates for Quadrant A Data is divided into 100 sec bins |
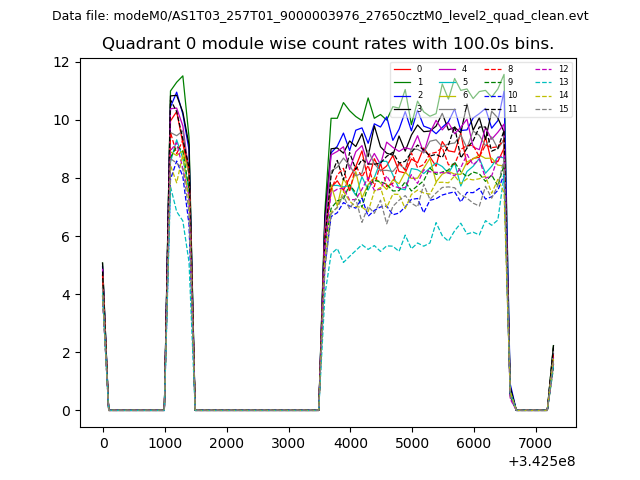 |
 |
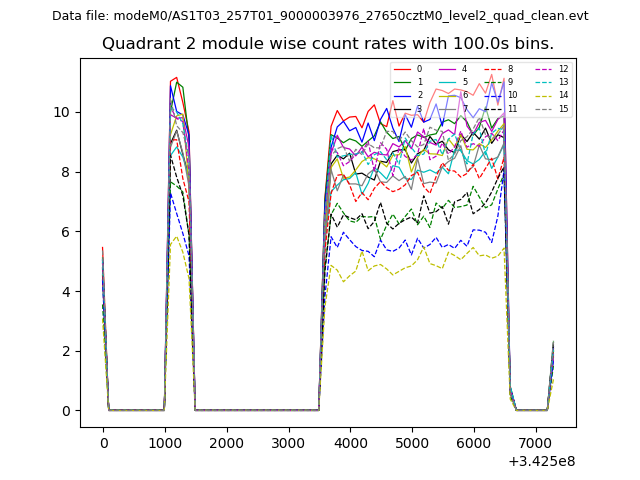
| Module-wise count rates for Quadrant B Data is divided into 100 sec bins |
 |
 |
| Module-wise count rates for Quadrant C Data is divided into 100 sec bins |
 |
 |
| Module-wise count rates for Quadrant D Data is divided into 100 sec bins |
 |
 |
| Parameter | Plot |
|---|---|
| CZT HV Monitor | 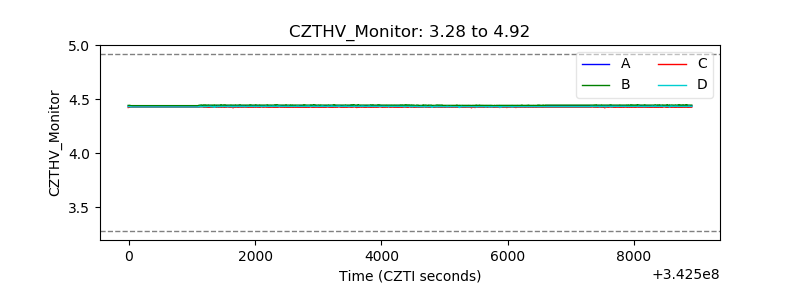 |
| D_VDD | 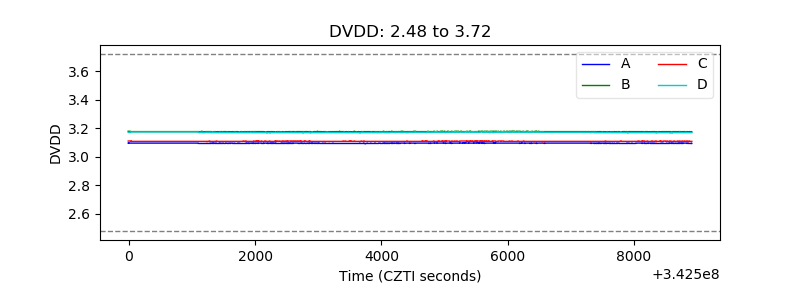 |
| Temperature 1 | 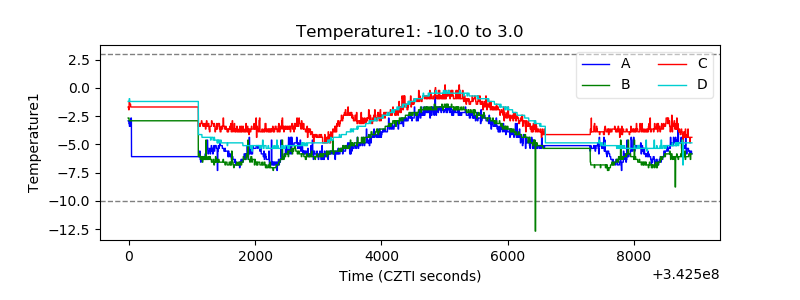 |
| Veto HV Monitor | 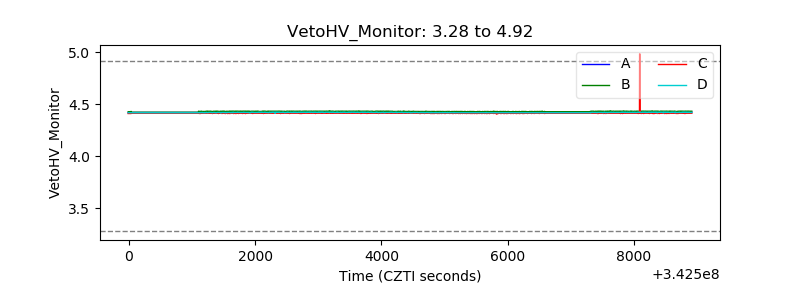 |
| Veto LLD | 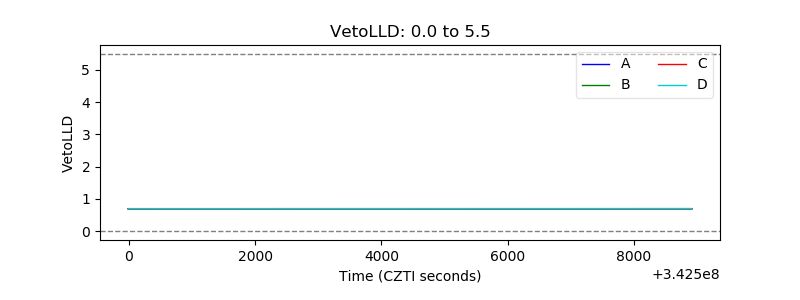 |
| Alpha Counter | 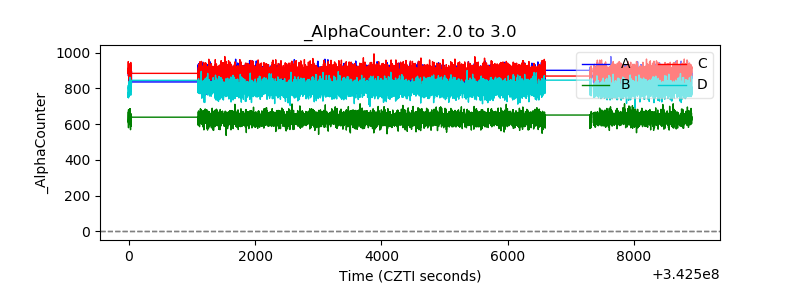 |
| _CPM_Rate | 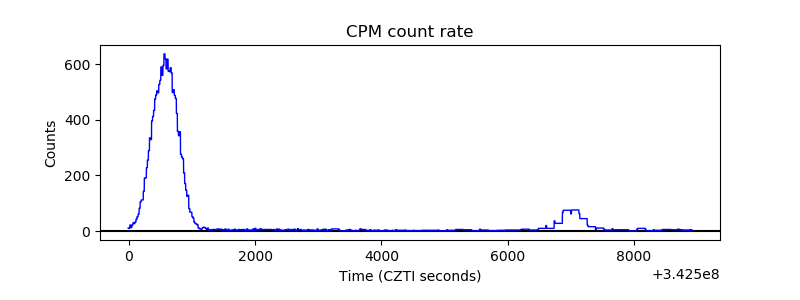 |
| CZT Counter | 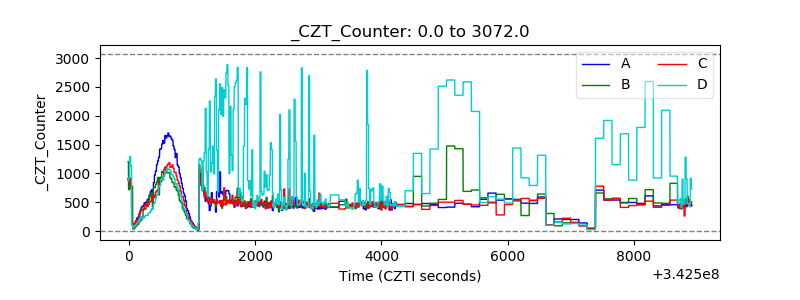 |
| +2.5 Volts monitor |  |
| +5 Volts monitor |  |
| _ROLL_ROT | 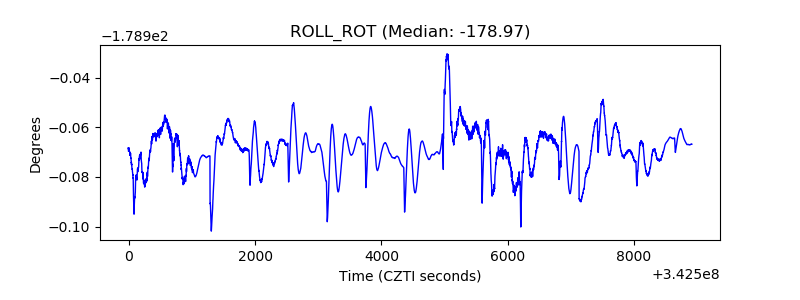 |
| _Roll_DEC | 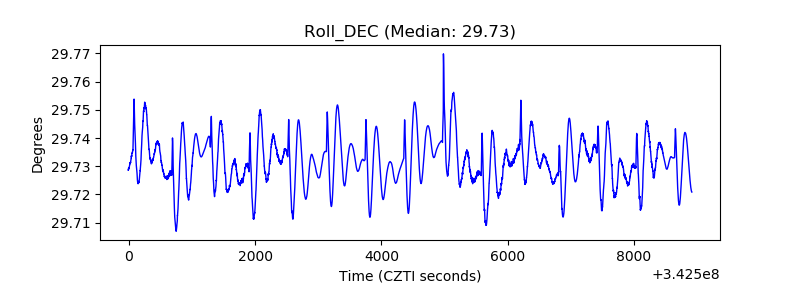 |
| _Roll_RA | 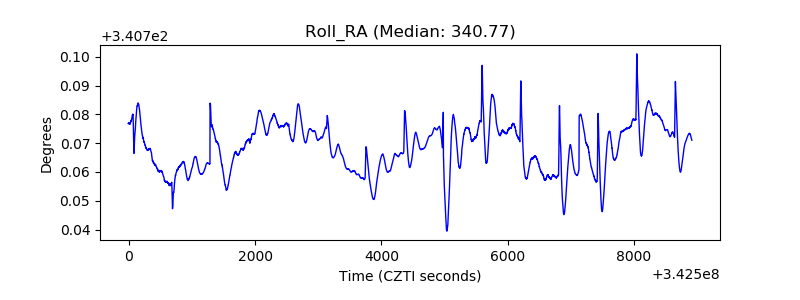 |
| Veto Counter |  |