| Param | Original file | Final file |
|---|---|---|
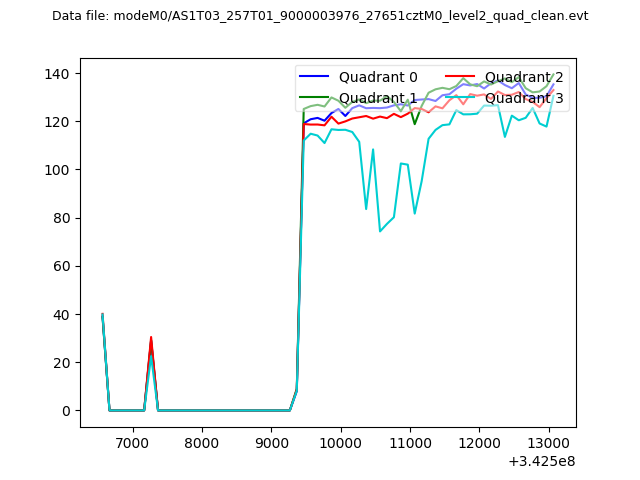
| Filename | modeM0/AS1T03_257T01_9000003976_27651cztM0_level2.evt | modeM0/AS1T03_257T01_9000003976_27651cztM0_level2_quad_clean.evt |
| Size (bytes) | 711,843,840 | 79,220,160 |
| Size | 678.9 MB | 75.6 MB |
| Events in quadrant A | 3,685,345 | 484,651 |
| Events in quadrant B | 4,662,048 | 493,093 |
| Events in quadrant C | 3,687,337 | 471,849 |
| Events in quadrant D | 9,010,276 | 421,394 |
| Mode M9 | |||
|---|---|---|---|
| Quadrant | BADHDUFLAG | Total packets | Discarded packets |
| A | 0 | 9 | 0 |
| B | 0 | 9 | 0 |
| C | 0 | 9 | 0 |
| D | 0 | 9 | 0 |
| Mode M0 | |||
|---|---|---|---|
| Quadrant | BADHDUFLAG | Total packets | Discarded packets |
| A | 0 | 15781 | 0 |
| B | 0 | 18652 | 0 |
| C | 0 | 15733 | 0 |
| D | 0 | 31992 | 0 |
| Quadrant | Total seconds | Saturated seconds | Saturation percentage |
|---|---|---|---|
| A | 7573 | 177 | 2.337251% |
| B | 7574 | 397 | 5.241616% |
| C | 7574 | 202 | 2.667019% |
| D | 7573 | 1823 | 24.072362% |
Noise dominated data is calculated using 1-second bins in cleaned event files. If a bin has >2000 counts, and if more than 50% of those come from <1% of pixels, then it is considered to be noise-dominated and hence unusable.
| Quadrant | # 1 sec bins | Bins with >0 counts | Bins with >2000 counts | High rate bins dominated by noise | Noise dominated (total time) | Noise dominated (detector-on time) | Marked lightcurve |
|---|---|---|---|---|---|---|---|
| A | 8513 | 7574 | 0 | 0 | 0.00% | 0.00% | 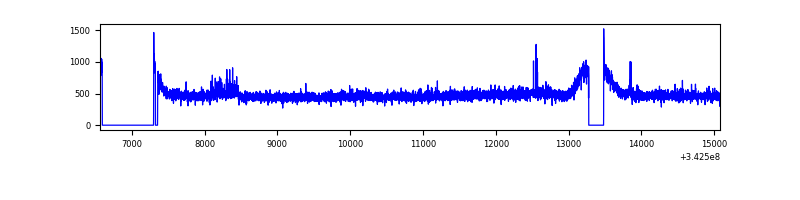 |
| B | 8514 | 7574 | 109 | 109 | 1.28% | 1.44% | 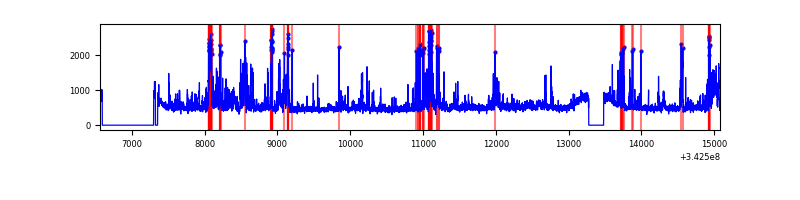 |
| C | 8514 | 7574 | 0 | 0 | 0.00% | 0.00% | 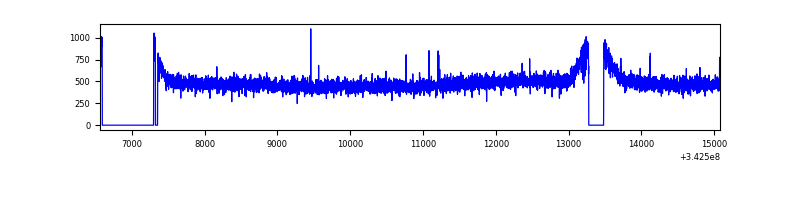 |
| D | 8512 | 7573 | 1380 | 1380 | 16.21% | 18.22% | 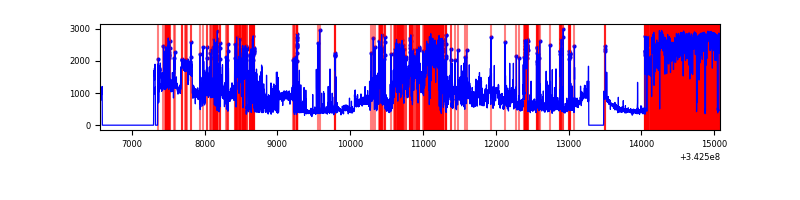 |
Top three noisy pixels from each quadrant. If the there are fewer than three noisy pixels in the level2.evt file, extra rows are filled as -1
| Pixel properties | Quadrant properties | ||||||
|---|---|---|---|---|---|---|---|
| Quadrant | DetID | PixID | Counts | Sigma | Mean | Median | Sigma |
| A | 6 | 16 | 51211 | 263.22 | 939 | 917 | 191.1 |
| A | 13 | 254 | 13113 | 63.83 | 939 | 917 | 191.1 |
| A | 3 | 137 | 9220 | 43.45 | 939 | 917 | 191.1 |
| B | 10 | 245 | 564589 | 3124.93 | 932 | 906 | 180.4 |
| B | 5 | 255 | 296255 | 1637.35 | 932 | 906 | 180.4 |
| B | 15 | 32 | 44272 | 240.41 | 932 | 906 | 180.4 |
| C | 14 | 238 | 142920 | 656.68 | 908 | 913 | 216.3 |
| C | 13 | 61 | 6352 | 25.15 | 908 | 913 | 216.3 |
| C | 2 | 16 | 5198 | 19.81 | 908 | 913 | 216.3 |
| D | 1 | 52 | 5734270 | 29976.52 | 791 | 767 | 191.3 |
| D | 11 | 176 | 110952 | 576.08 | 791 | 767 | 191.3 |
| D | 7 | 80 | 70907 | 366.71 | 791 | 767 | 191.3 |
Histogram calculated using DETX and DETY for each event in the final _common_clean file
| Quadrant A | 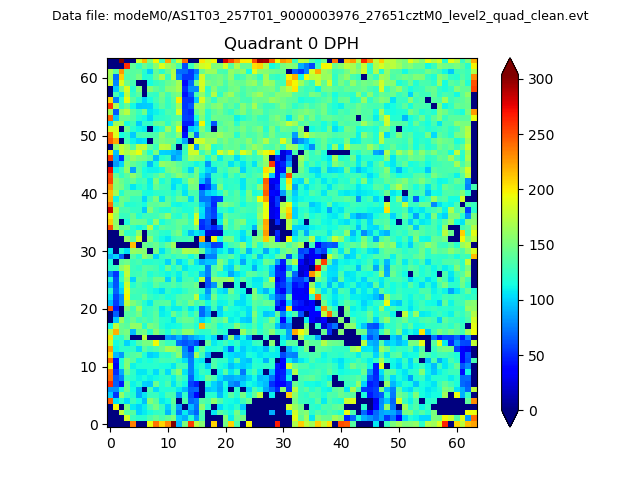 |
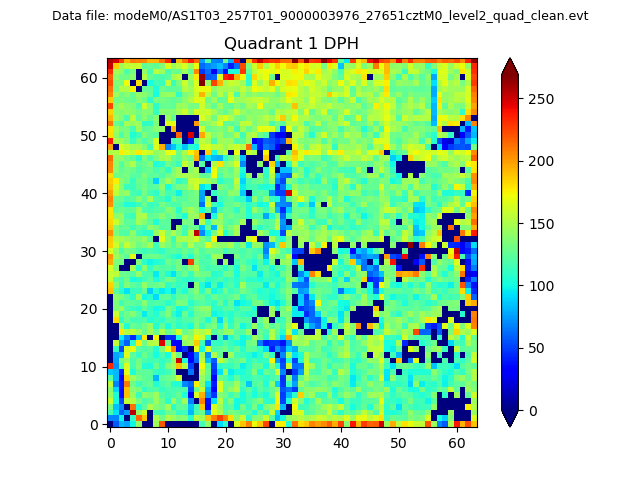 |
Quadrant B |
|---|---|---|---|
| Quadrant D | 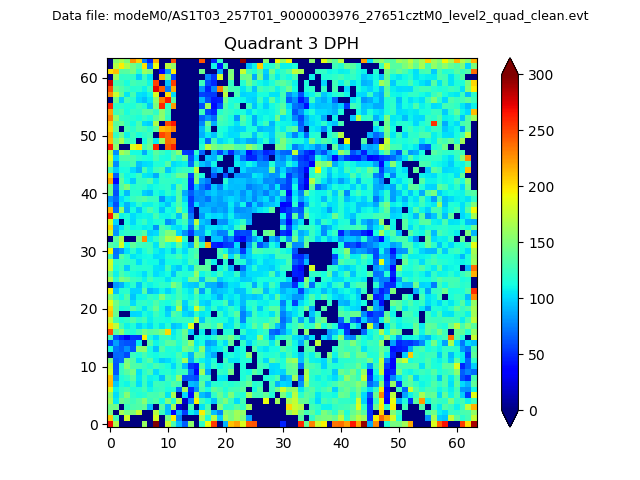 |
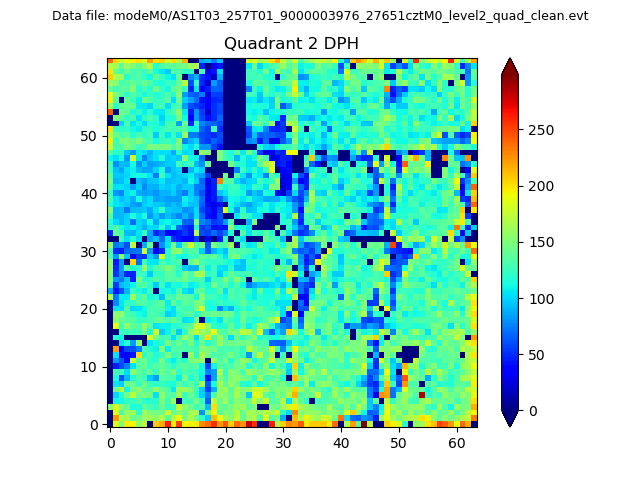 |
Quadrant C |
| Plot type | Count rate plots | Images |
|---|---|---|
| Comparison with Poisson distribution Blue bars denote a histogram of data divided into 1 sec bins. Red curve is a Poisson curve with rate = median count rate of data. |
 |
 |
| Quadrant-wise count rates Data is divided into 100 sec bins |
 |
|
| Module-wise count rates for Quadrant A Data is divided into 100 sec bins |
 |
 |
| Module-wise count rates for Quadrant B Data is divided into 100 sec bins |
 |
 |
| Module-wise count rates for Quadrant C Data is divided into 100 sec bins |
 |
 |
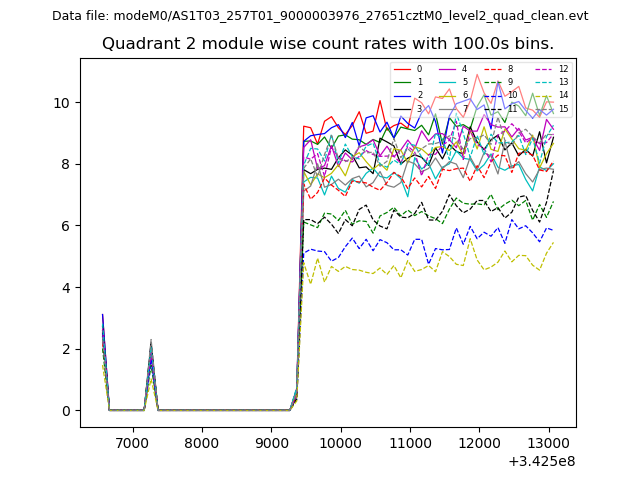
| Module-wise count rates for Quadrant D Data is divided into 100 sec bins |
 |
 |
| Parameter | Plot |
|---|---|
| CZT HV Monitor |  |
| D_VDD | 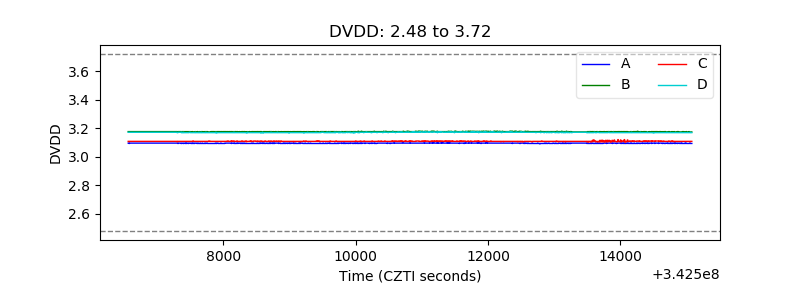 |
| Temperature 1 | 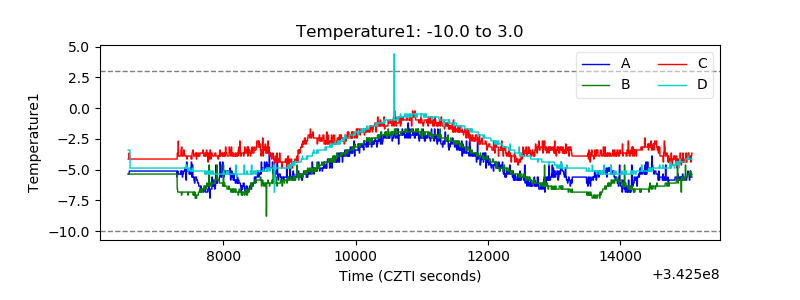 |
| Veto HV Monitor | 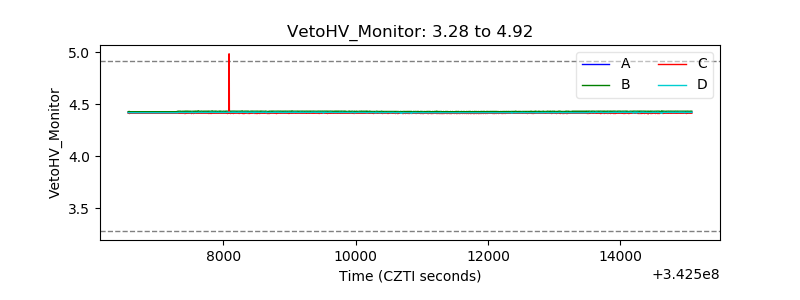 |
| Veto LLD | 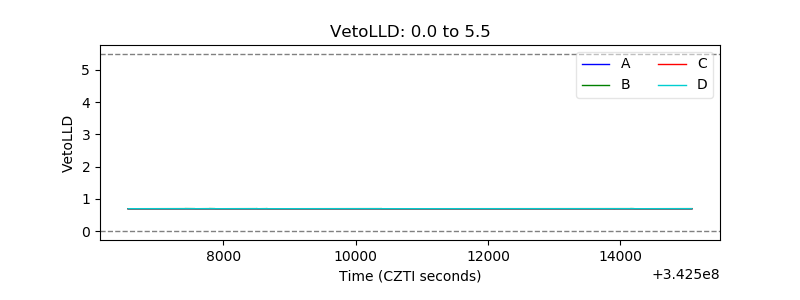 |
| Alpha Counter | 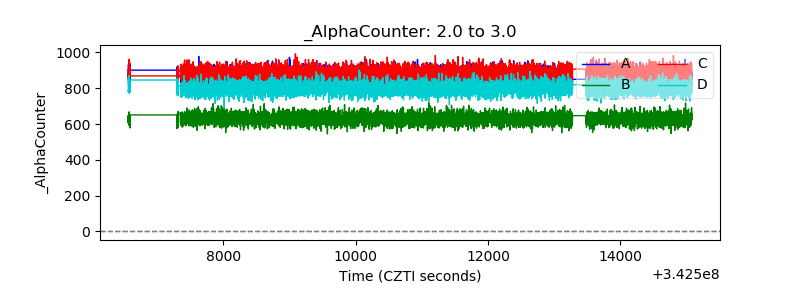 |
| _CPM_Rate | 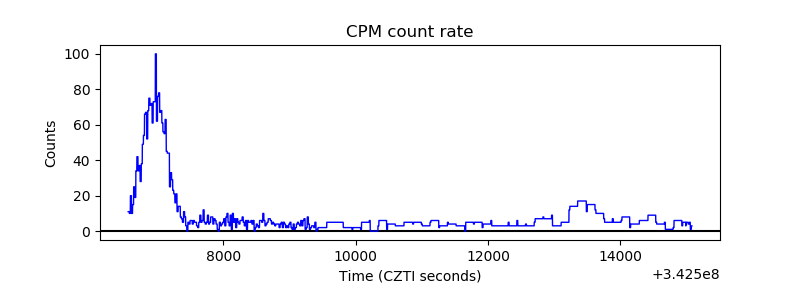 |
| CZT Counter | 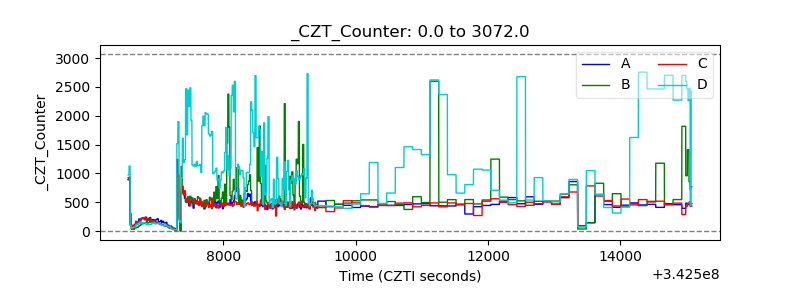 |
| +2.5 Volts monitor |  |
| +5 Volts monitor | 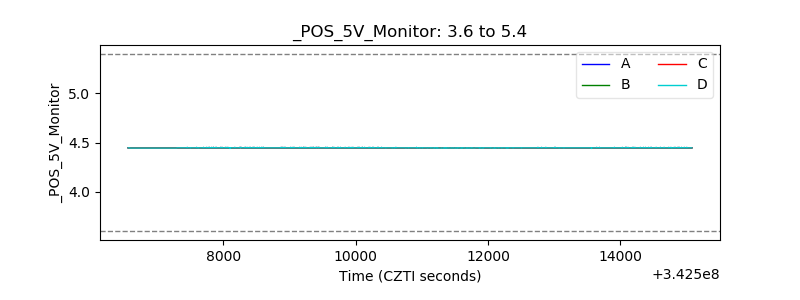 |
| _ROLL_ROT | 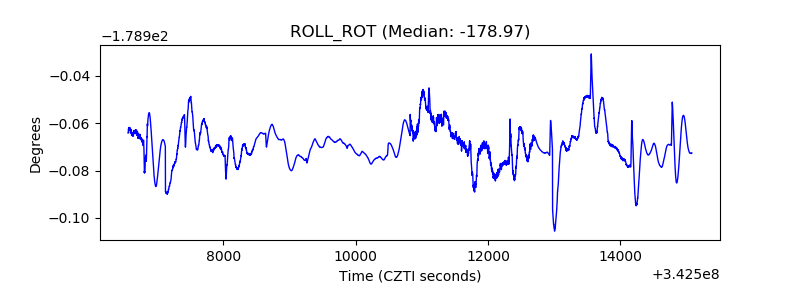 |
| _Roll_DEC | 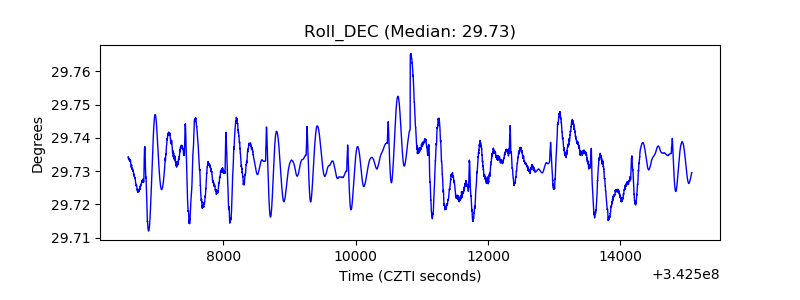 |
| _Roll_RA | 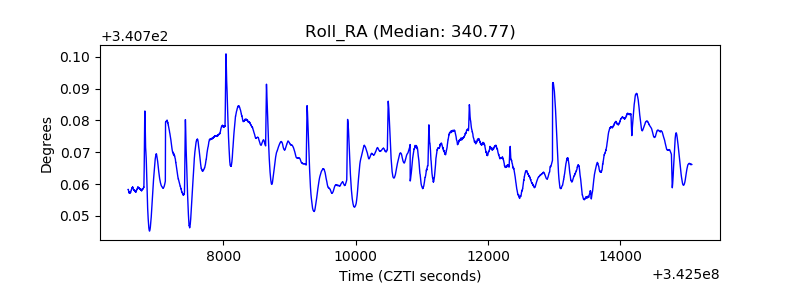 |
| Veto Counter | 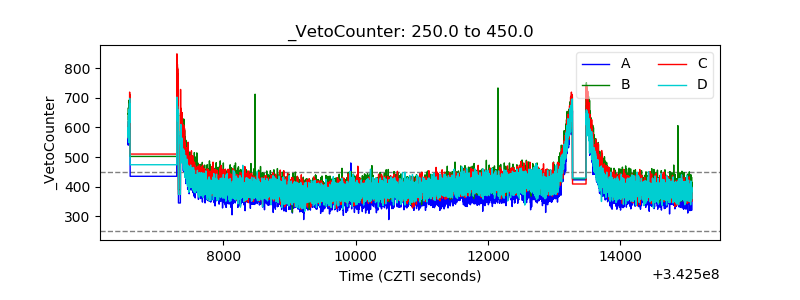 |