| Param | Original file | Final file |
|---|---|---|
| Filename | modeM0/AS1T03_257T01_9000003976_27652cztM0_level2.evt | modeM0/AS1T03_257T01_9000003976_27652cztM0_level2_quad_clean.evt |
| Size (bytes) | 825,865,920 | 73,624,320 |
| Size | 787.6 MB | 70.2 MB |
| Events in quadrant A | 3,843,562 | 509,792 |
| Events in quadrant B | 5,254,760 | 503,362 |
| Events in quadrant C | 3,975,211 | 493,494 |
| Events in quadrant D | 11,397,846 | 167,605 |
| Mode M9 | |||
|---|---|---|---|
| Quadrant | BADHDUFLAG | Total packets | Discarded packets |
| A | 0 | 1 | 0 |
| B | 0 | 2 | 0 |
| C | 0 | 2 | 0 |
| D | 0 | 2 | 0 |
| Mode M0 | |||
|---|---|---|---|
| Quadrant | BADHDUFLAG | Total packets | Discarded packets |
| A | 0 | 16553 | 0 |
| B | 0 | 20798 | 0 |
| C | 0 | 16956 | 0 |
| D | 0 | 39244 | 0 |
| Quadrant | Total seconds | Saturated seconds | Saturation percentage |
|---|---|---|---|
| A | 7966 | 272 | 3.414512% |
| B | 7966 | 659 | 8.272659% |
| C | 7965 | 297 | 3.728814% |
| D | 7965 | 4394 | 55.166353% |
Noise dominated data is calculated using 1-second bins in cleaned event files. If a bin has >2000 counts, and if more than 50% of those come from <1% of pixels, then it is considered to be noise-dominated and hence unusable.
| Quadrant | # 1 sec bins | Bins with >0 counts | Bins with >2000 counts | High rate bins dominated by noise | Noise dominated (total time) | Noise dominated (detector-on time) | Marked lightcurve |
|---|---|---|---|---|---|---|---|
| A | 8011 | 7966 | 0 | 0 | 0.00% | 0.00% | 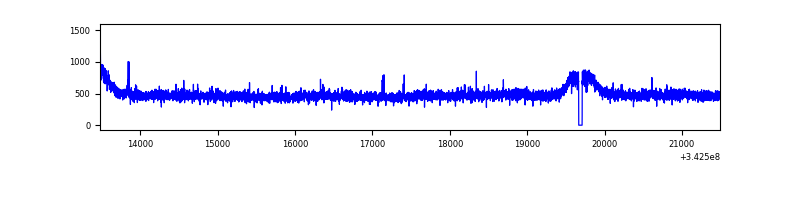 |
| B | 8011 | 7966 | 268 | 268 | 3.35% | 3.36% | 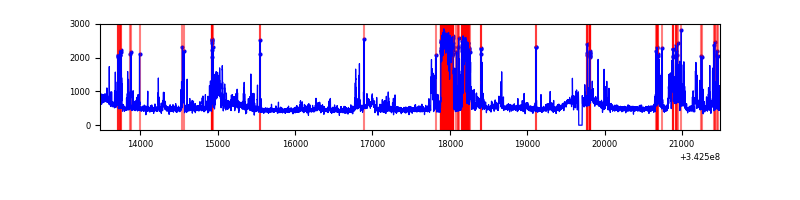 |
| C | 8010 | 7965 | 4 | 4 | 0.05% | 0.05% | 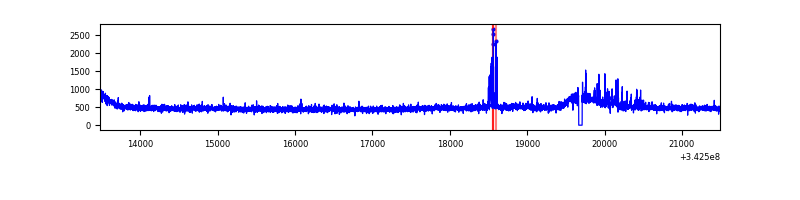 |
| D | 8010 | 7966 | 2419 | 2419 | 30.20% | 30.37% | 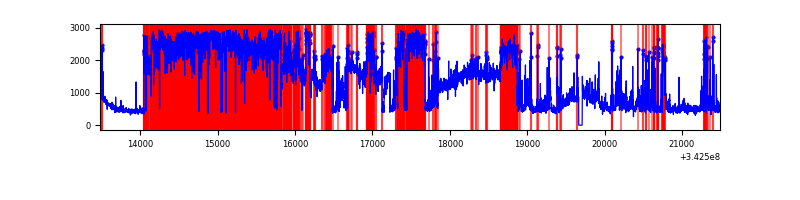 |
Top three noisy pixels from each quadrant. If the there are fewer than three noisy pixels in the level2.evt file, extra rows are filled as -1
| Pixel properties | Quadrant properties | ||||||
|---|---|---|---|---|---|---|---|
| Quadrant | DetID | PixID | Counts | Sigma | Mean | Median | Sigma |
| A | 6 | 16 | 29932 | 144.07 | 986 | 963 | 201.1 |
| A | 13 | 254 | 14159 | 65.63 | 986 | 963 | 201.1 |
| A | 3 | 137 | 9859 | 44.24 | 986 | 963 | 201.1 |
| B | 10 | 245 | 1364811 | 7273.69 | 967 | 941 | 187.5 |
| B | 12 | 111 | 23663 | 121.18 | 967 | 941 | 187.5 |
| B | 11 | 111 | 21526 | 109.78 | 967 | 941 | 187.5 |
| C | 14 | 238 | 148779 | 662.47 | 949 | 956 | 223.1 |
| C | 2 | 16 | 113442 | 504.1 | 949 | 956 | 223.1 |
| C | 8 | 128 | 6821 | 26.28 | 949 | 956 | 223.1 |
| D | 1 | 52 | 9039121 | 64813.27 | 575 | 557 | 139.5 |
| D | 12 | 233 | 99980 | 712.94 | 575 | 557 | 139.5 |
| D | 2 | 250 | 35170 | 248.2 | 575 | 557 | 139.5 |
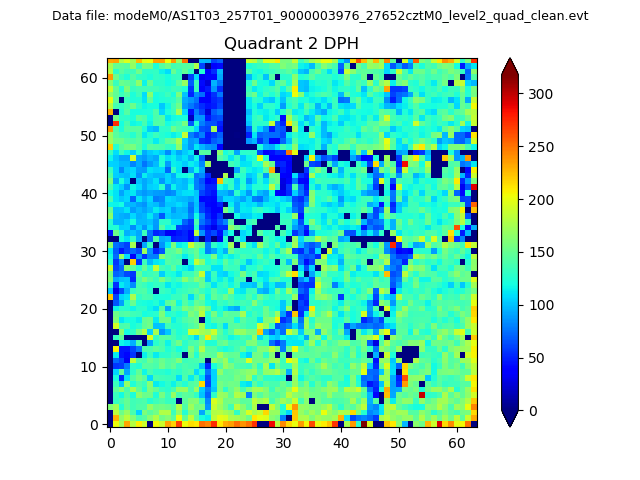
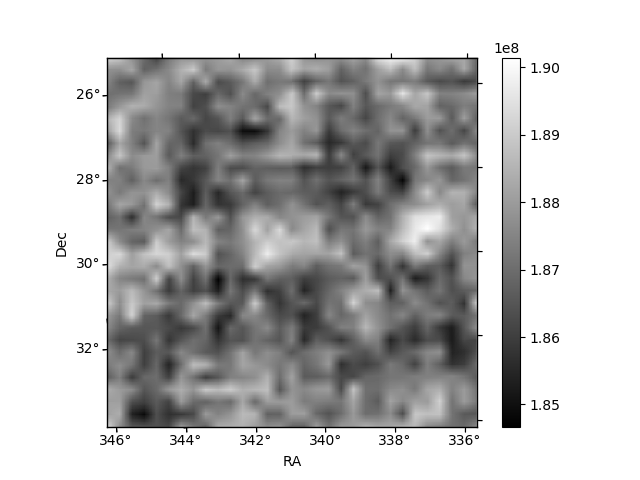
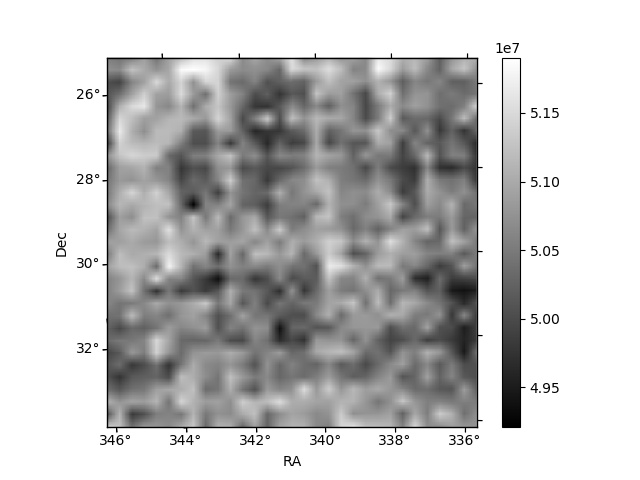
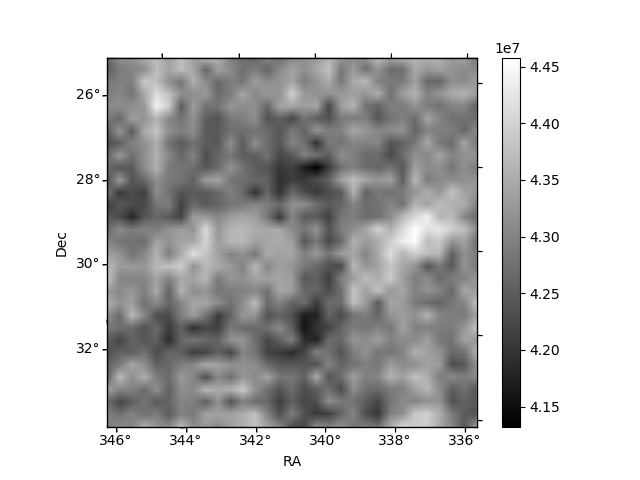
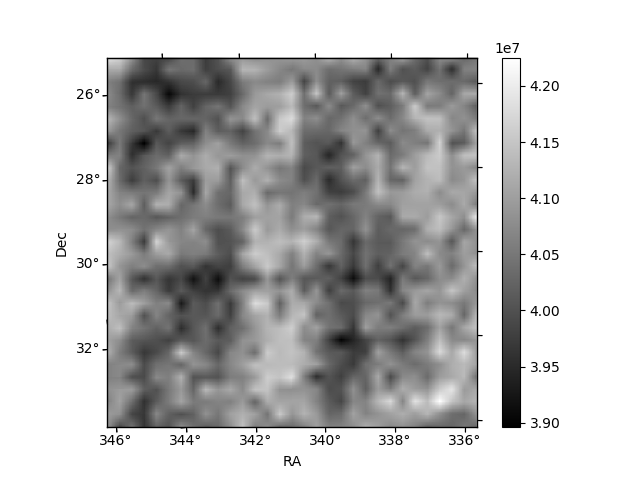
Histogram calculated using DETX and DETY for each event in the final _common_clean file
| Quadrant A | 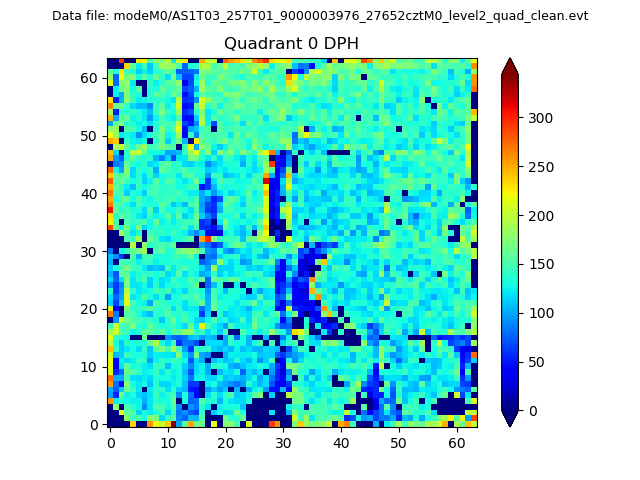 |
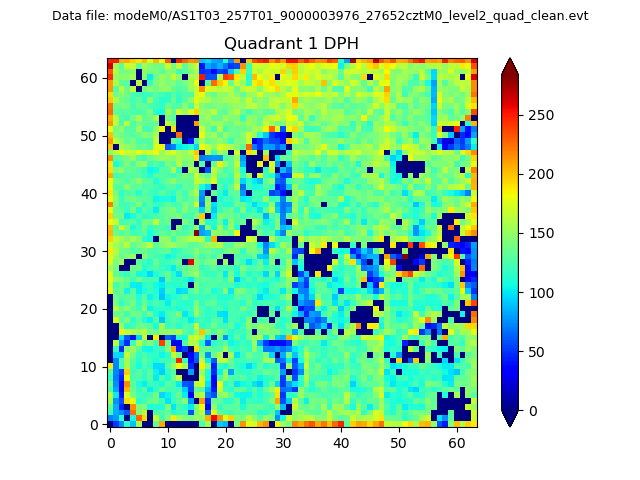 |
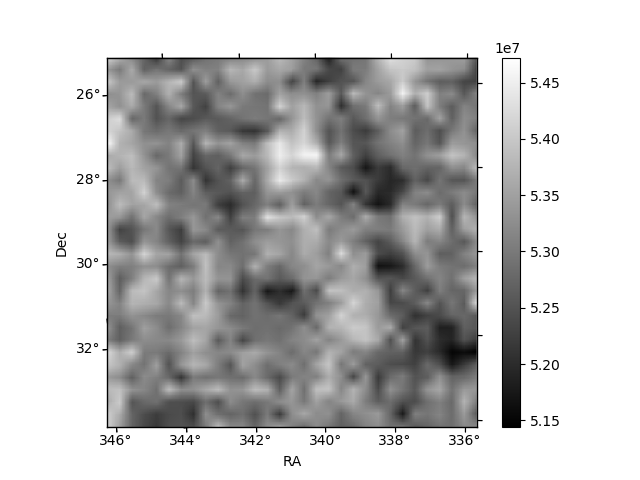
Quadrant B |
|---|---|---|---|
| Quadrant D | 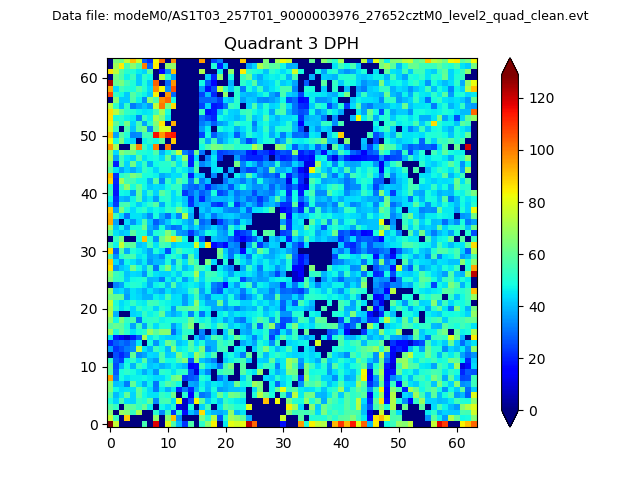 |
 |
Quadrant C |
| Plot type | Count rate plots | Images |
|---|---|---|
| Comparison with Poisson distribution Blue bars denote a histogram of data divided into 1 sec bins. Red curve is a Poisson curve with rate = median count rate of data. |
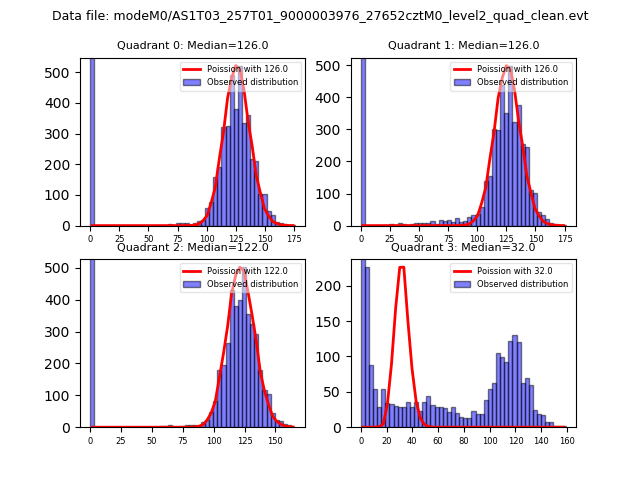 |
 |
| Quadrant-wise count rates Data is divided into 100 sec bins |
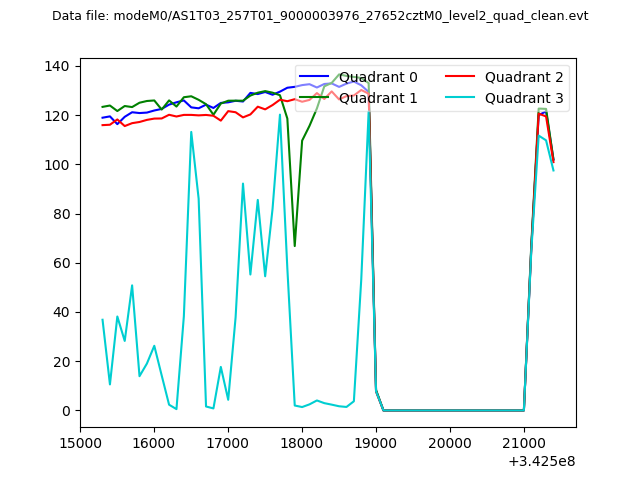 |
|
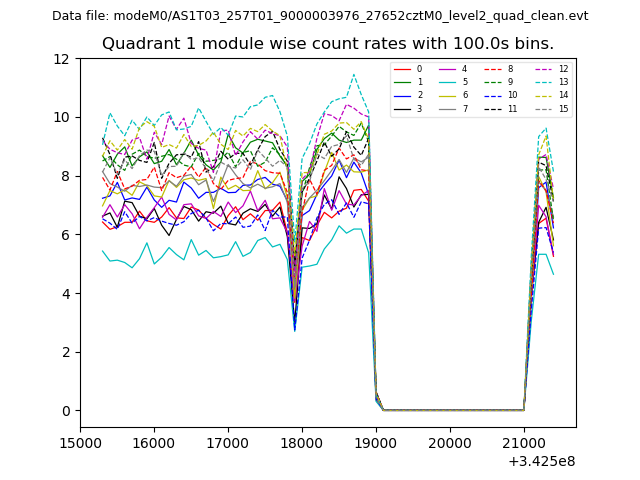
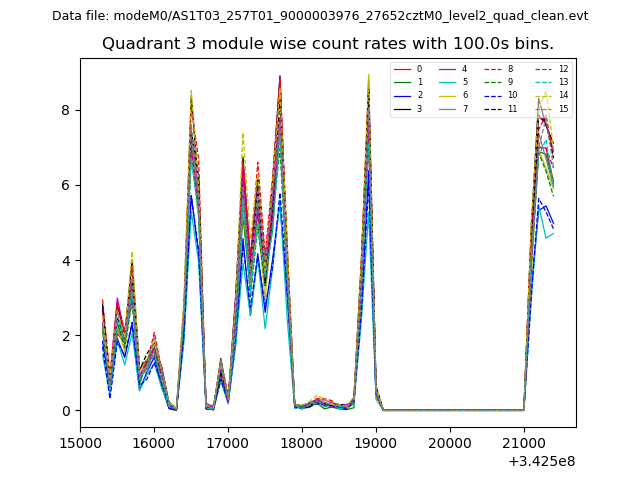
| Module-wise count rates for Quadrant A Data is divided into 100 sec bins |
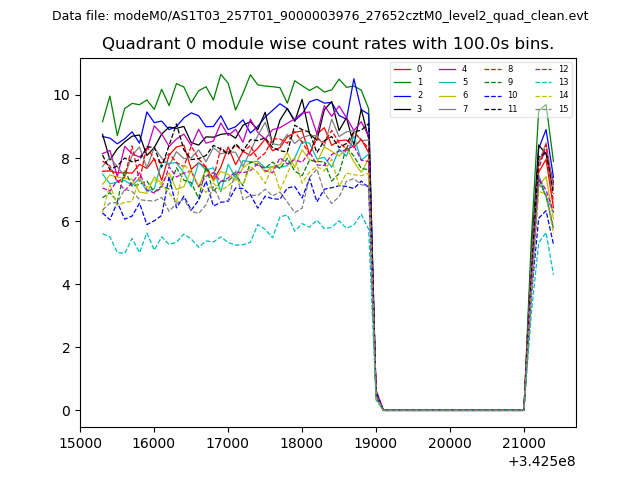 |
 |
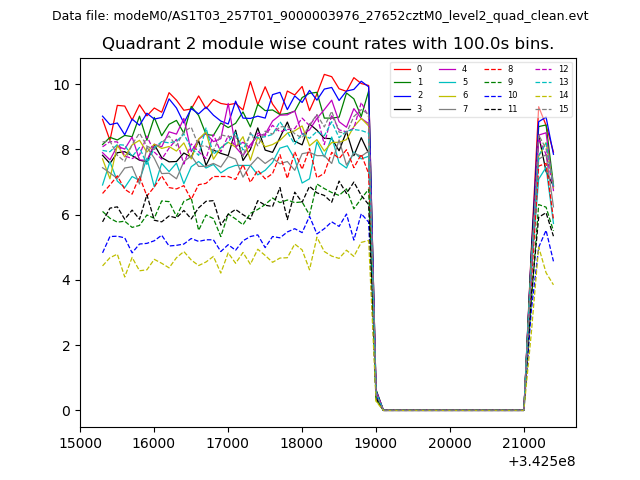
| Module-wise count rates for Quadrant B Data is divided into 100 sec bins |
 |
 |
| Module-wise count rates for Quadrant C Data is divided into 100 sec bins |
 |
 |
| Module-wise count rates for Quadrant D Data is divided into 100 sec bins |
 |
 |
| Parameter | Plot |
|---|---|
| CZT HV Monitor | 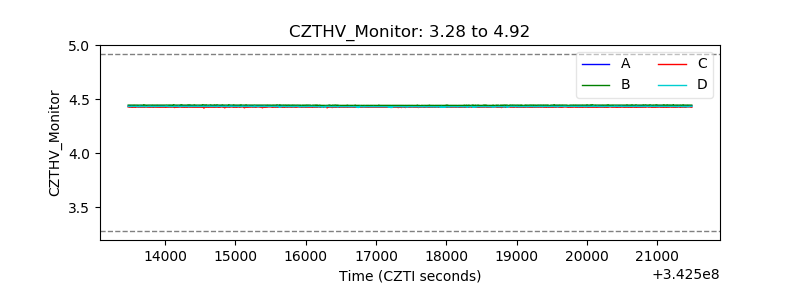 |
| D_VDD | 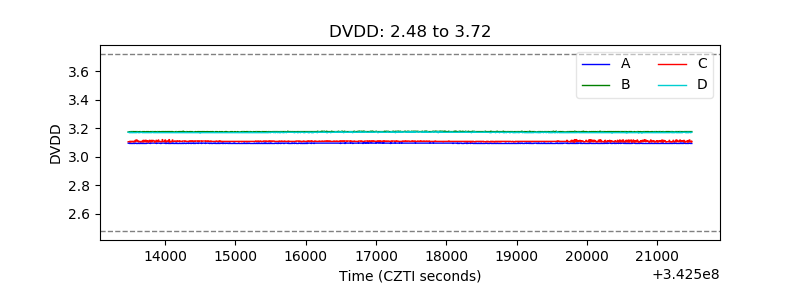 |
| Temperature 1 | 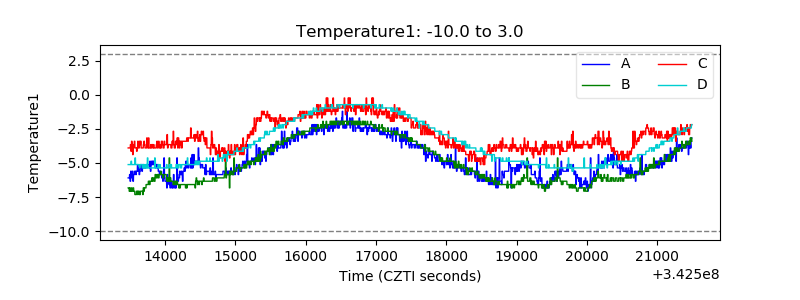 |
| Veto HV Monitor | 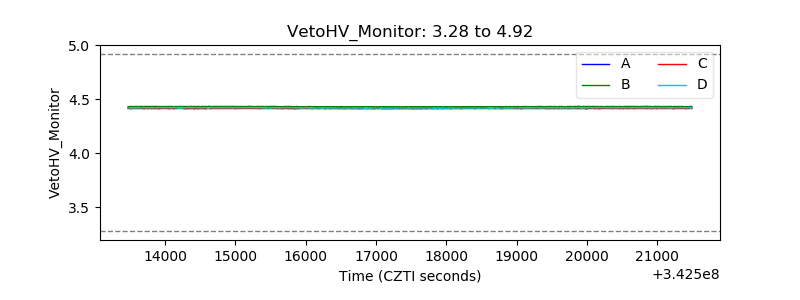 |
| Veto LLD | 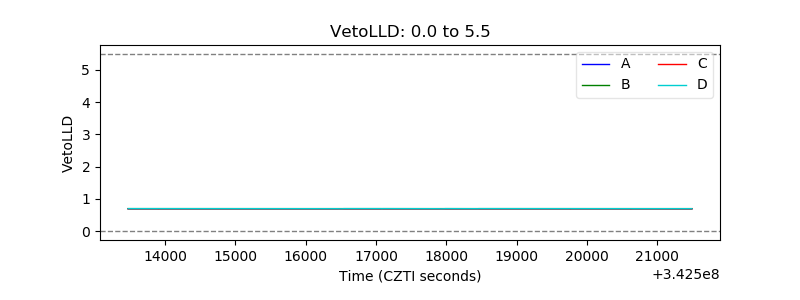 |
| Alpha Counter | 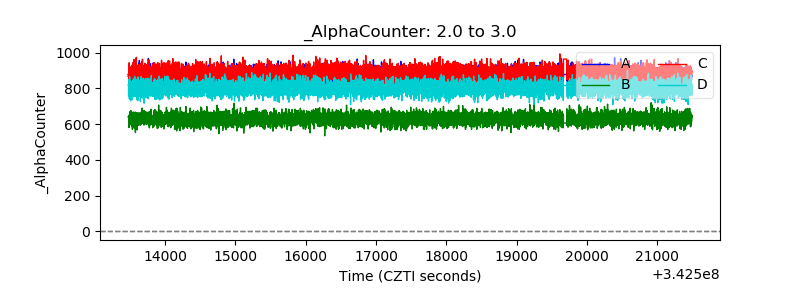 |
| _CPM_Rate | 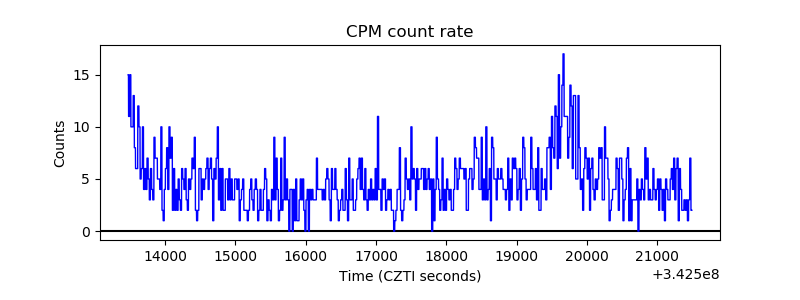 |
| CZT Counter | 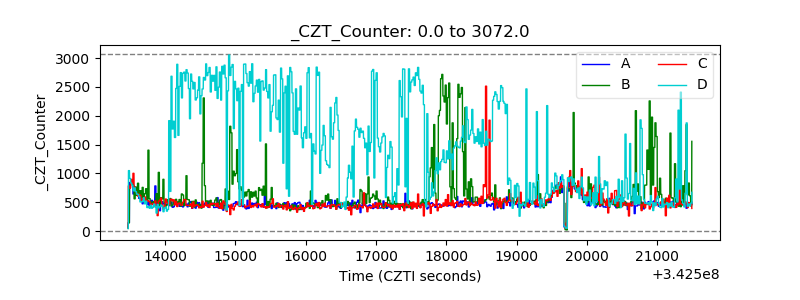 |
| +2.5 Volts monitor | 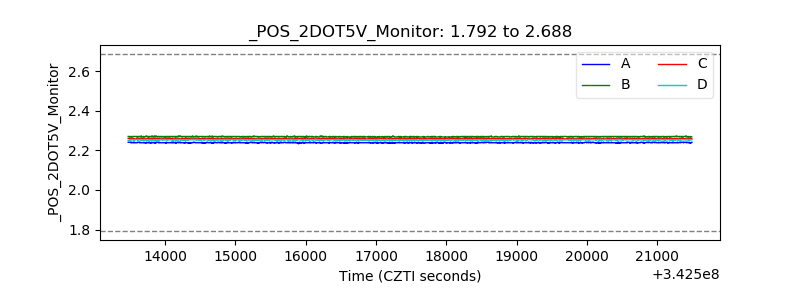 |
| +5 Volts monitor | 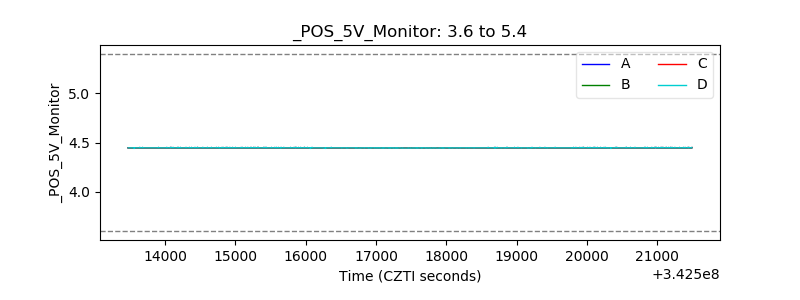 |
| _ROLL_ROT | 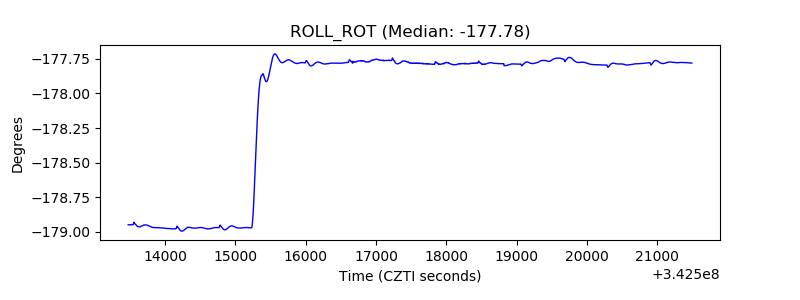 |
| _Roll_DEC |  |
| _Roll_RA | 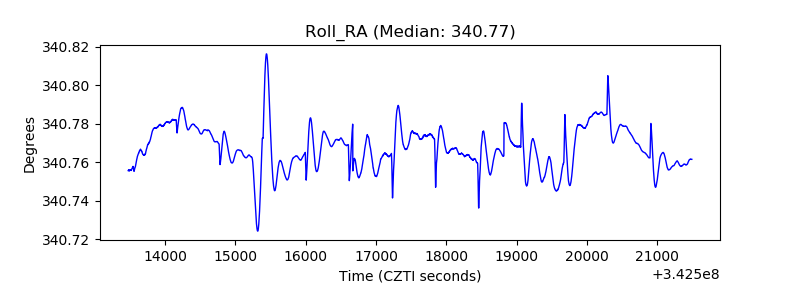 |
| Veto Counter | 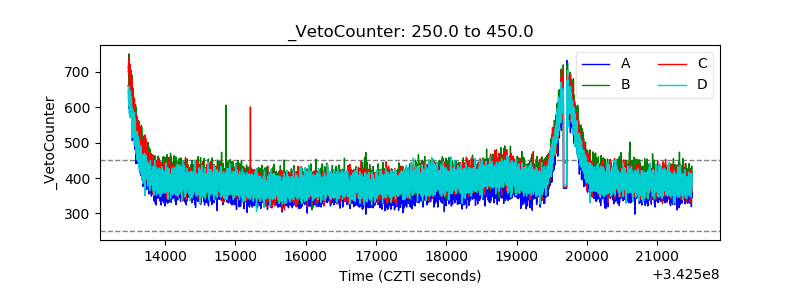 |