| Param | Original file | Final file |
|---|---|---|
| Filename | modeM0/AS1T03_257T01_9000003976_27653cztM0_level2.evt | modeM0/AS1T03_257T01_9000003976_27653cztM0_level2_quad_clean.evt |
| Size (bytes) | 700,698,240 | 89,470,080 |
| Size | 668.2 MB | 85.3 MB |
| Events in quadrant A | 3,904,409 | 563,873 |
| Events in quadrant B | 4,755,464 | 571,180 |
| Events in quadrant C | 3,964,390 | 549,062 |
| Events in quadrant D | 8,054,079 | 468,370 |
| Mode M9 | |||
|---|---|---|---|
| Quadrant | BADHDUFLAG | Total packets | Discarded packets |
| A | 0 | 5 | 0 |
| B | 0 | 5 | 0 |
| C | 0 | 5 | 0 |
| D | 0 | 5 | 0 |
| Mode M0 | |||
|---|---|---|---|
| Quadrant | BADHDUFLAG | Total packets | Discarded packets |
| A | 0 | 16769 | 0 |
| B | 0 | 19227 | 0 |
| C | 0 | 16882 | 0 |
| D | 0 | 29238 | 0 |
| Quadrant | Total seconds | Saturated seconds | Saturation percentage |
|---|---|---|---|
| A | 8011 | 301 | 3.757334% |
| B | 8011 | 458 | 5.717139% |
| C | 8011 | 322 | 4.019473% |
| D | 8011 | 1497 | 18.686806% |
Noise dominated data is calculated using 1-second bins in cleaned event files. If a bin has >2000 counts, and if more than 50% of those come from <1% of pixels, then it is considered to be noise-dominated and hence unusable.
| Quadrant | # 1 sec bins | Bins with >0 counts | Bins with >2000 counts | High rate bins dominated by noise | Noise dominated (total time) | Noise dominated (detector-on time) | Marked lightcurve |
|---|---|---|---|---|---|---|---|
| A | 8416 | 8011 | 0 | 0 | 0.00% | 0.00% | 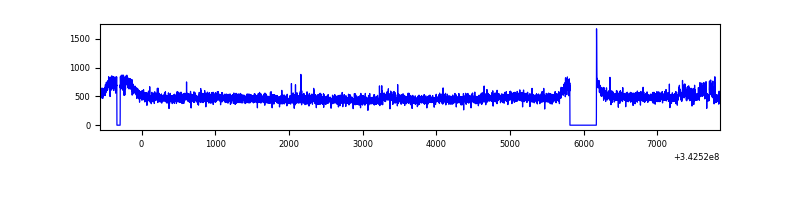 |
| B | 8416 | 8011 | 83 | 83 | 0.99% | 1.04% | 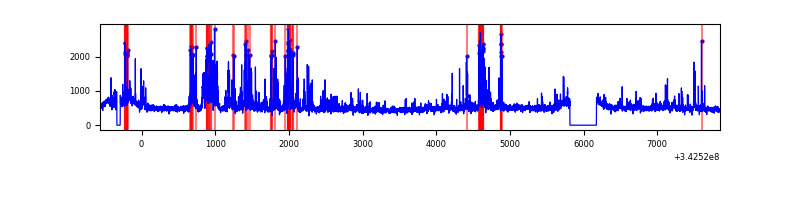 |
| C | 8416 | 8011 | 0 | 0 | 0.00% | 0.00% | 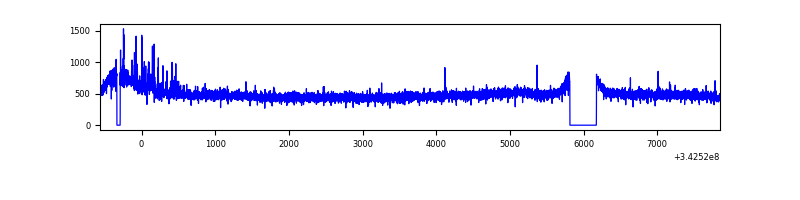 |
| D | 8416 | 8012 | 1245 | 1245 | 14.79% | 15.54% | 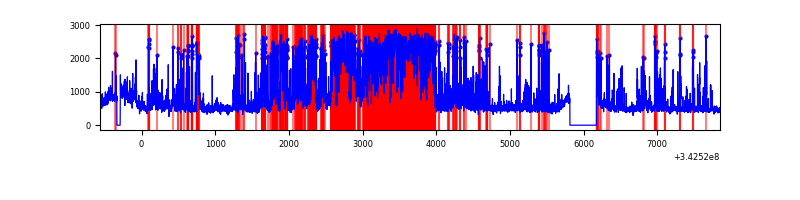 |
Top three noisy pixels from each quadrant. If the there are fewer than three noisy pixels in the level2.evt file, extra rows are filled as -1
| Pixel properties | Quadrant properties | ||||||
|---|---|---|---|---|---|---|---|
| Quadrant | DetID | PixID | Counts | Sigma | Mean | Median | Sigma |
| A | 6 | 16 | 50749 | 245.67 | 992 | 967 | 202.6 |
| A | 7 | 192 | 18545 | 86.75 | 992 | 967 | 202.6 |
| A | 13 | 254 | 13224 | 60.49 | 992 | 967 | 202.6 |
| B | 10 | 245 | 843275 | 4429.25 | 979 | 952 | 190.2 |
| B | 12 | 111 | 24139 | 121.93 | 979 | 952 | 190.2 |
| B | 15 | 32 | 22600 | 113.83 | 979 | 952 | 190.2 |
| C | 14 | 238 | 152539 | 680.58 | 951 | 956 | 222.7 |
| C | 2 | 16 | 79986 | 354.83 | 951 | 956 | 222.7 |
| C | 8 | 128 | 12288 | 50.88 | 951 | 956 | 222.7 |
| D | 1 | 52 | 1923854 | 8900.16 | 902 | 874 | 216.1 |
| D | 12 | 233 | 1909150 | 8832.11 | 902 | 874 | 216.1 |
| D | 7 | 80 | 638043 | 2949.02 | 902 | 874 | 216.1 |
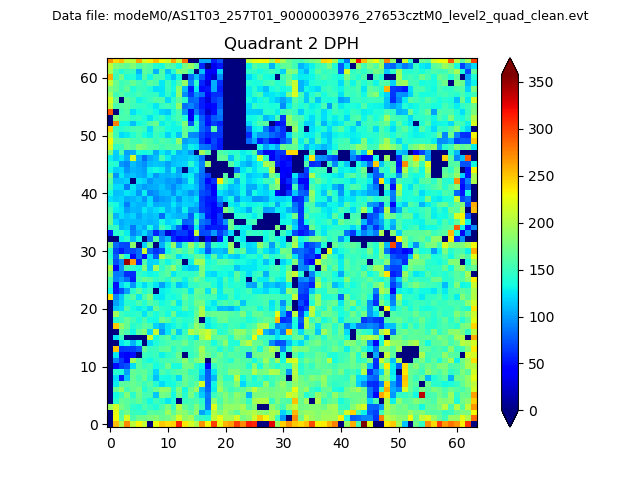
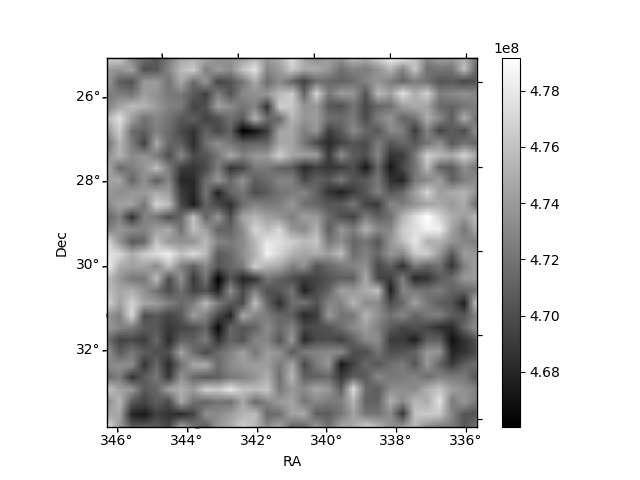
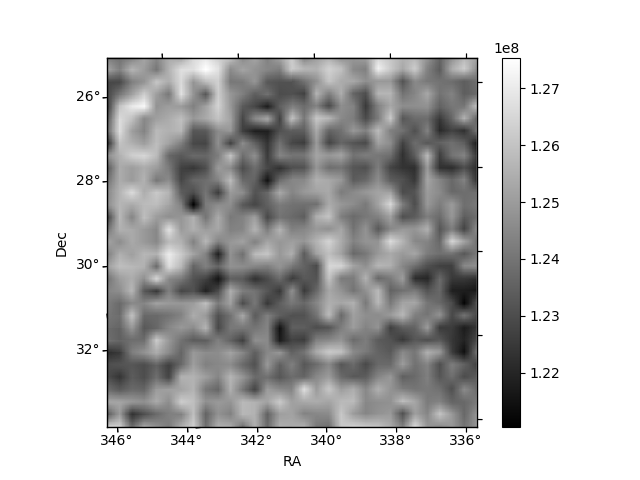
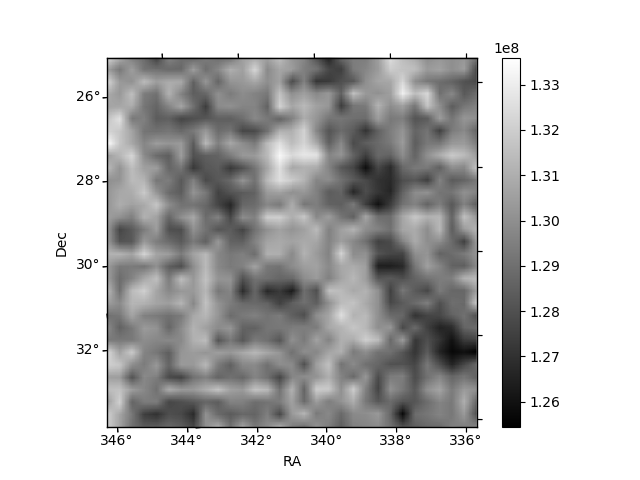
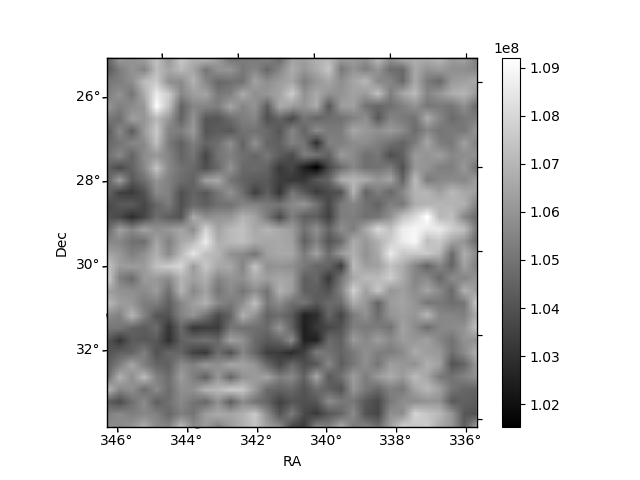
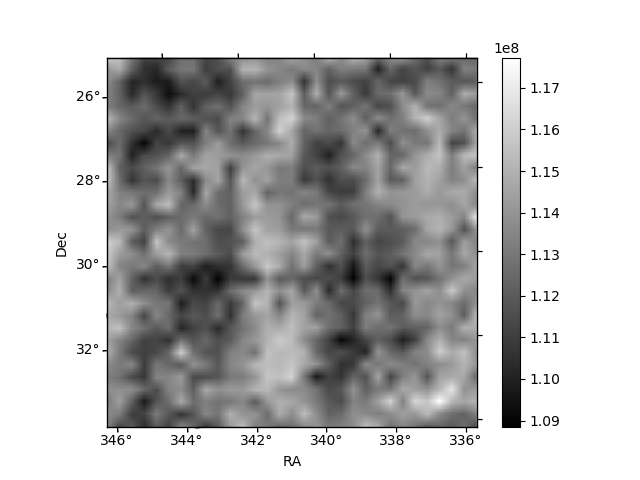
Histogram calculated using DETX and DETY for each event in the final _common_clean file
| Quadrant A | 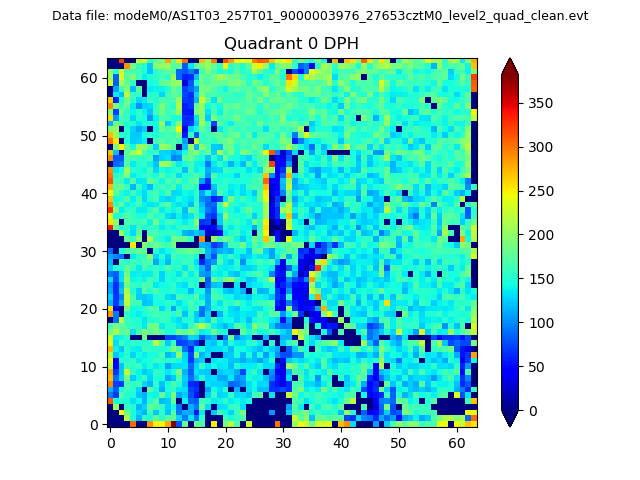 |
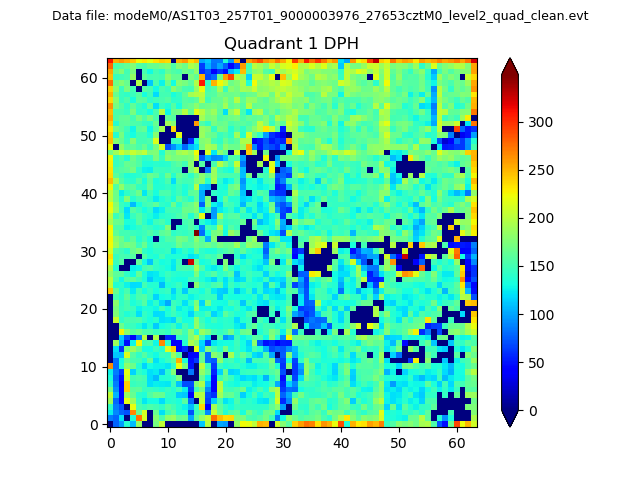 |
Quadrant B |
|---|---|---|---|
| Quadrant D | 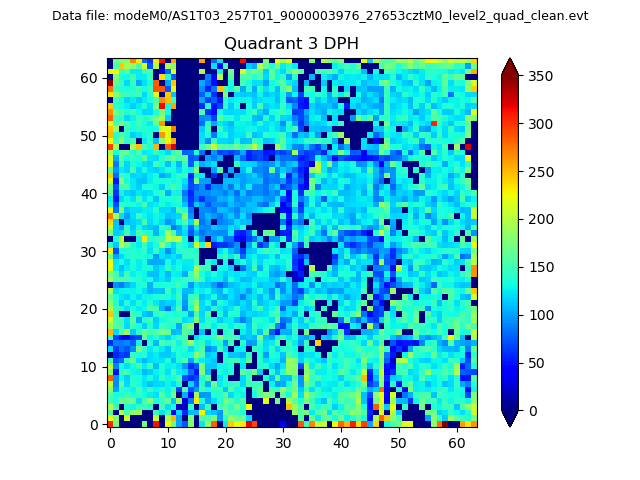 |
 |
Quadrant C |
| Plot type | Count rate plots | Images |
|---|---|---|
| Comparison with Poisson distribution Blue bars denote a histogram of data divided into 1 sec bins. Red curve is a Poisson curve with rate = median count rate of data. |
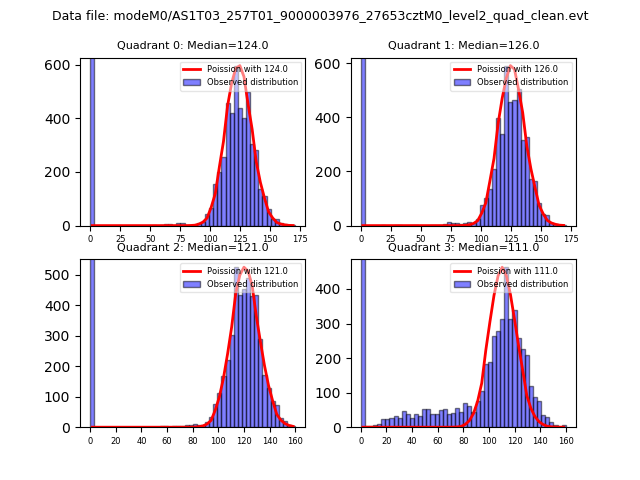 |
 |
| Quadrant-wise count rates Data is divided into 100 sec bins |
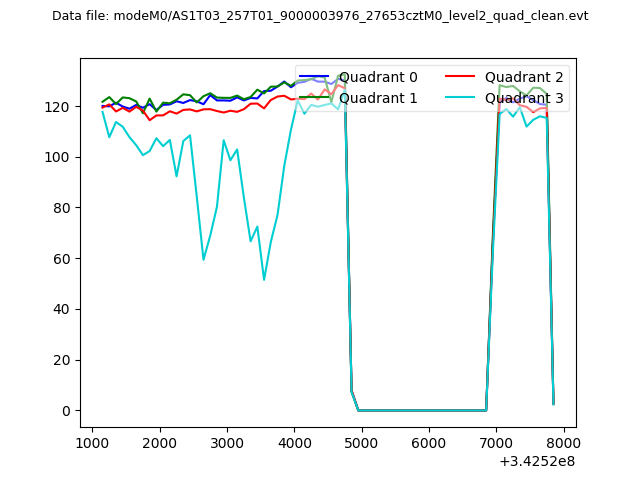 |
|
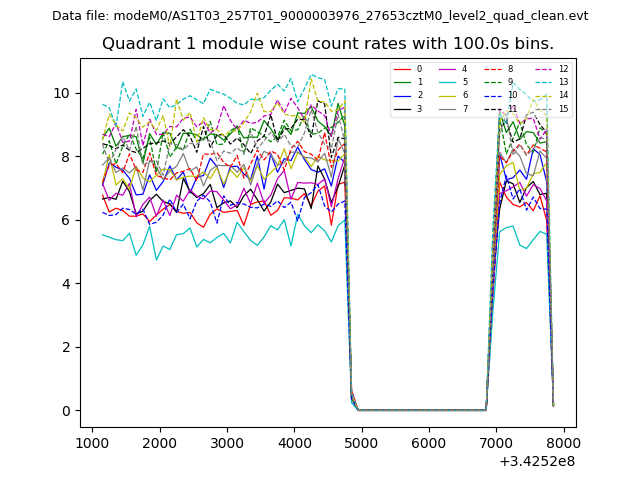
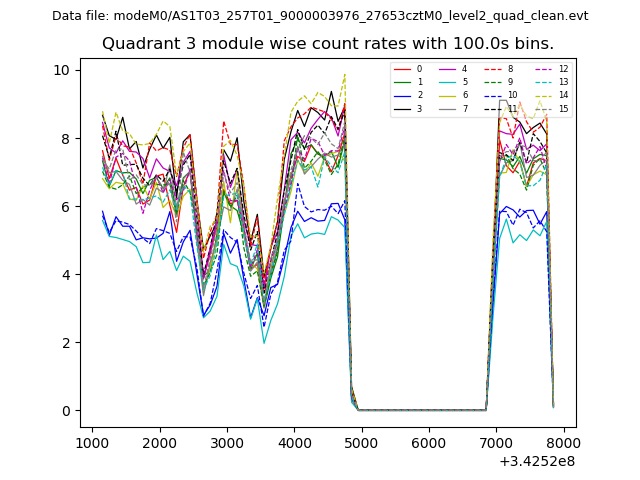
| Module-wise count rates for Quadrant A Data is divided into 100 sec bins |
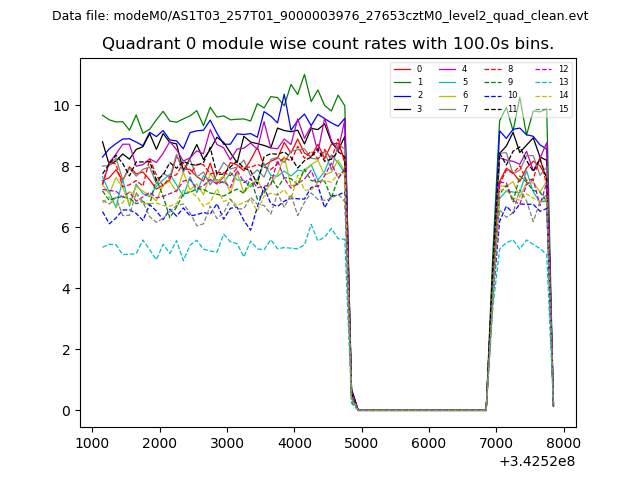 |
 |
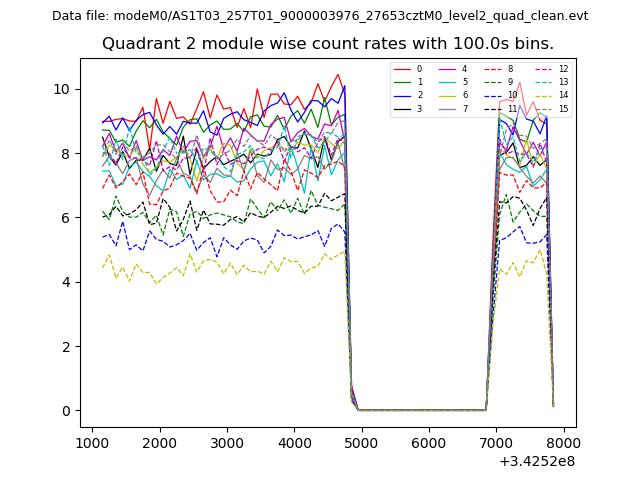
| Module-wise count rates for Quadrant B Data is divided into 100 sec bins |
 |
 |
| Module-wise count rates for Quadrant C Data is divided into 100 sec bins |
 |
 |
| Module-wise count rates for Quadrant D Data is divided into 100 sec bins |
 |
 |
| Parameter | Plot |
|---|---|
| CZT HV Monitor | 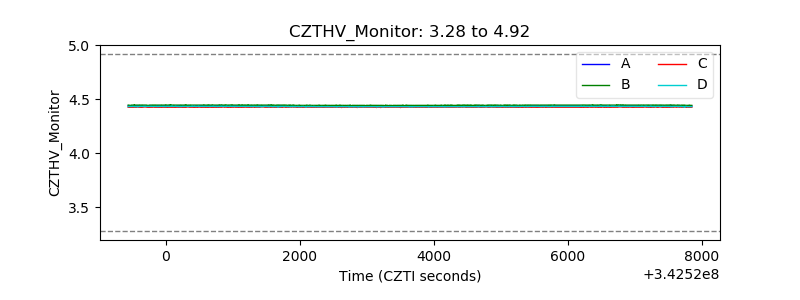 |
| D_VDD | 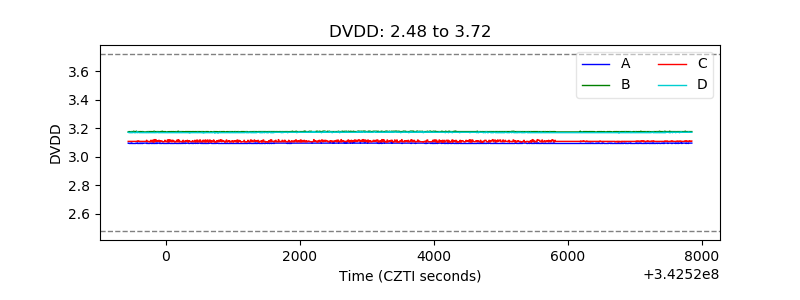 |
| Temperature 1 | 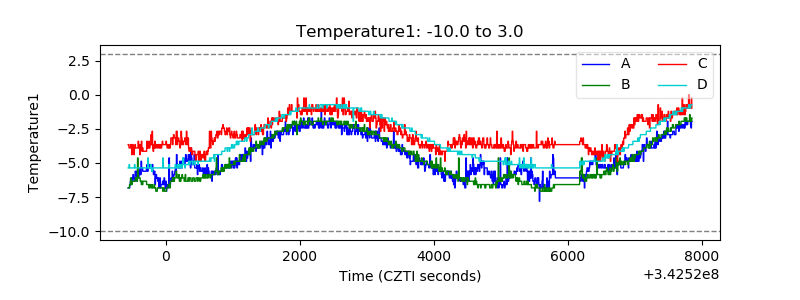 |
| Veto HV Monitor | 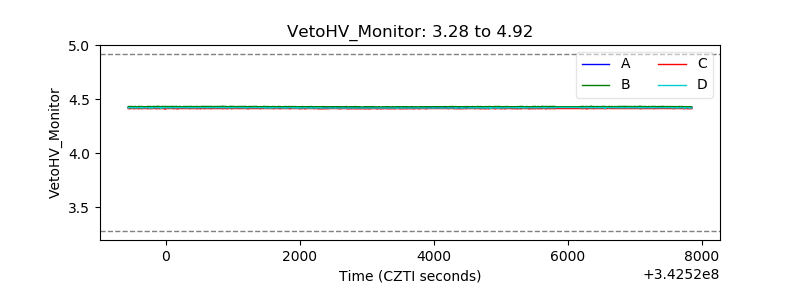 |
| Veto LLD |  |
| Alpha Counter | 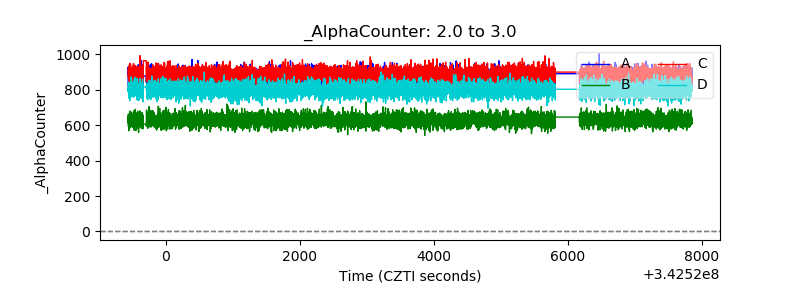 |
| _CPM_Rate | 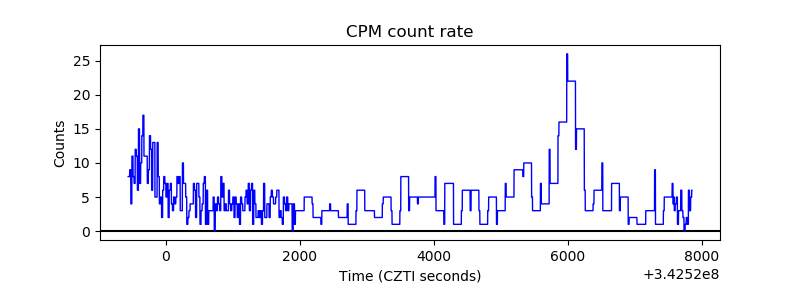 |
| CZT Counter |  |
| +2.5 Volts monitor |  |
| +5 Volts monitor |  |
| _ROLL_ROT | 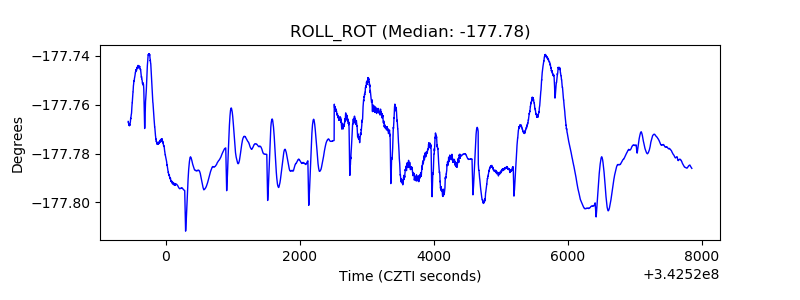 |
| _Roll_DEC | 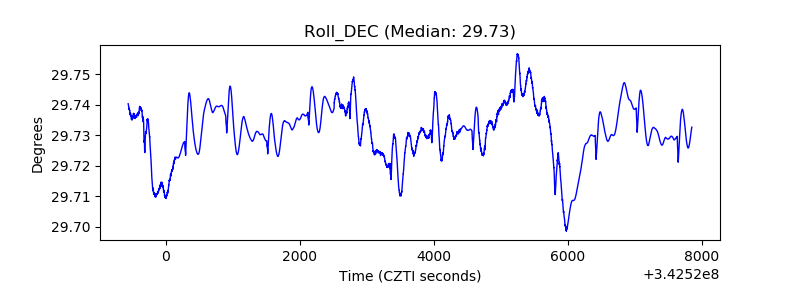 |
| _Roll_RA | 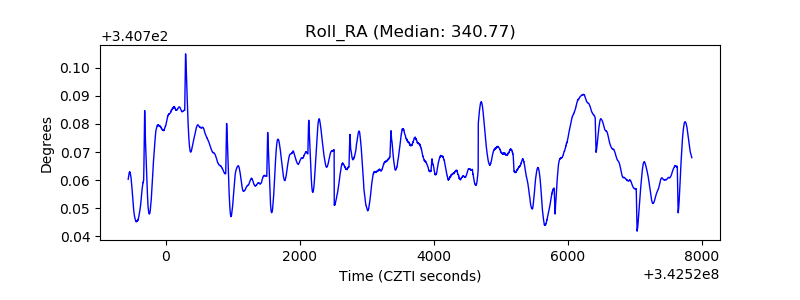 |
| Veto Counter | 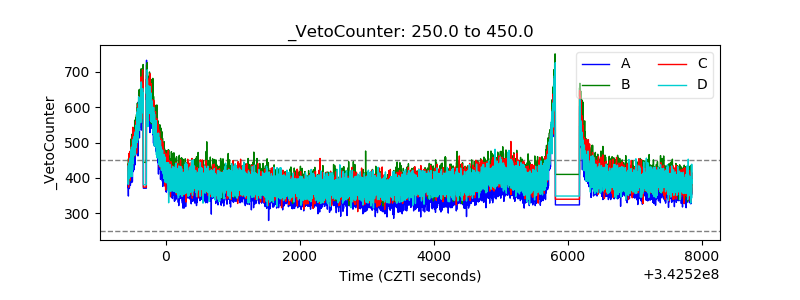 |