| Param | Original file | Final file |
|---|---|---|
| Filename | modeM0/AS1T03_257T01_9000003976_27655cztM0_level2.evt | modeM0/AS1T03_257T01_9000003976_27655cztM0_level2_quad_clean.evt |
| Size (bytes) | 771,799,680 | 134,778,240 |
| Size | 736.0 MB | 128.5 MB |
| Events in quadrant A | 4,563,110 | 883,899 |
| Events in quadrant B | 5,197,633 | 893,636 |
| Events in quadrant C | 4,549,763 | 855,711 |
| Events in quadrant D | 8,394,241 | 763,357 |
| Mode M9 | |||
|---|---|---|---|
| Quadrant | BADHDUFLAG | Total packets | Discarded packets |
| A | 0 | 6 | 0 |
| B | 0 | 6 | 0 |
| C | 0 | 6 | 0 |
| D | 0 | 6 | 0 |
| Mode M0 | |||
|---|---|---|---|
| Quadrant | BADHDUFLAG | Total packets | Discarded packets |
| A | 0 | 20211 | 0 |
| B | 0 | 21803 | 0 |
| C | 0 | 20009 | 0 |
| D | 0 | 31506 | 0 |
| Quadrant | Total seconds | Saturated seconds | Saturation percentage |
|---|---|---|---|
| A | 9885 | 71 | 0.718260% |
| B | 9886 | 218 | 2.205139% |
| C | 9886 | 98 | 0.991301% |
| D | 9886 | 1183 | 11.966417% |
Noise dominated data is calculated using 1-second bins in cleaned event files. If a bin has >2000 counts, and if more than 50% of those come from <1% of pixels, then it is considered to be noise-dominated and hence unusable.
| Quadrant | # 1 sec bins | Bins with >0 counts | Bins with >2000 counts | High rate bins dominated by noise | Noise dominated (total time) | Noise dominated (detector-on time) | Marked lightcurve |
|---|---|---|---|---|---|---|---|
| A | 10410 | 9885 | 2 | 2 | 0.02% | 0.02% |  |
| B | 10411 | 9886 | 124 | 124 | 1.19% | 1.25% |  |
| C | 10411 | 9886 | 0 | 0 | 0.00% | 0.00% |  |
| D | 10411 | 9886 | 1036 | 1036 | 9.95% | 10.48% |  |
Top three noisy pixels from each quadrant. If the there are fewer than three noisy pixels in the level2.evt file, extra rows are filled as -1
| Pixel properties | Quadrant properties | ||||||
|---|---|---|---|---|---|---|---|
| Quadrant | DetID | PixID | Counts | Sigma | Mean | Median | Sigma |
| A | 6 | 16 | 61561 | 259.41 | 1160 | 1135 | 232.9 |
| A | 13 | 254 | 17884 | 71.91 | 1160 | 1135 | 232.9 |
| A | 13 | 248 | 13111 | 51.41 | 1160 | 1135 | 232.9 |
| B | 15 | 222 | 357481 | 1630.91 | 1145 | 1113 | 218.5 |
| B | 10 | 245 | 143295 | 650.69 | 1145 | 1113 | 218.5 |
| B | 4 | 200 | 74517 | 335.93 | 1145 | 1113 | 218.5 |
| C | 14 | 238 | 178067 | 674.65 | 1116 | 1122 | 262.3 |
| C | 15 | 208 | 12657 | 43.98 | 1116 | 1122 | 262.3 |
| C | 2 | 16 | 10940 | 37.43 | 1116 | 1122 | 262.3 |
| D | 1 | 52 | 3450671 | 13524.63 | 1062 | 1033 | 255.1 |
| D | 7 | 80 | 688341 | 2694.66 | 1062 | 1033 | 255.1 |
| D | 2 | 250 | 166344 | 648.12 | 1062 | 1033 | 255.1 |
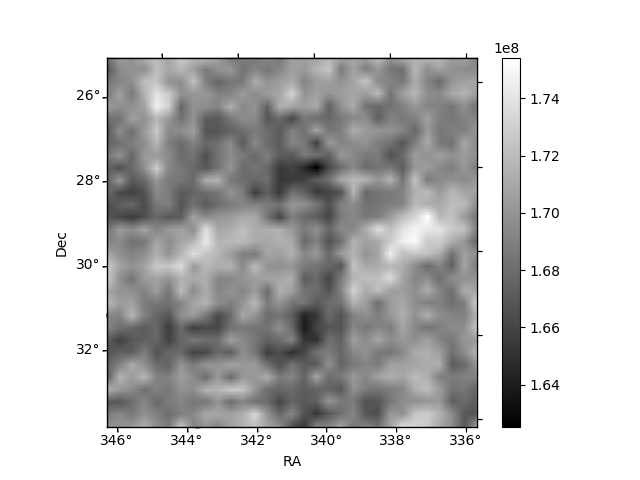
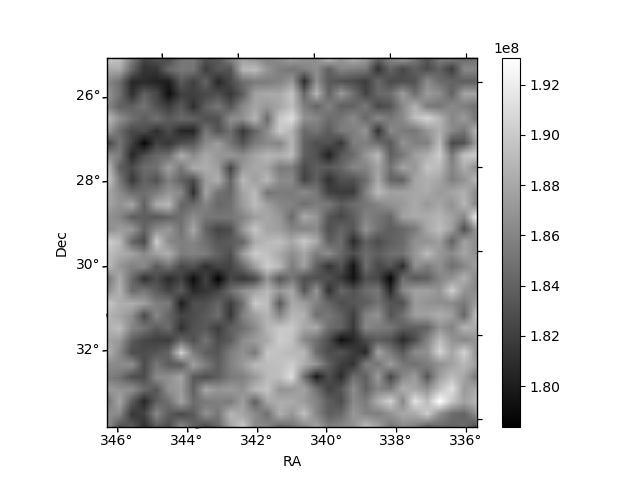
Histogram calculated using DETX and DETY for each event in the final _common_clean file
| Quadrant A | 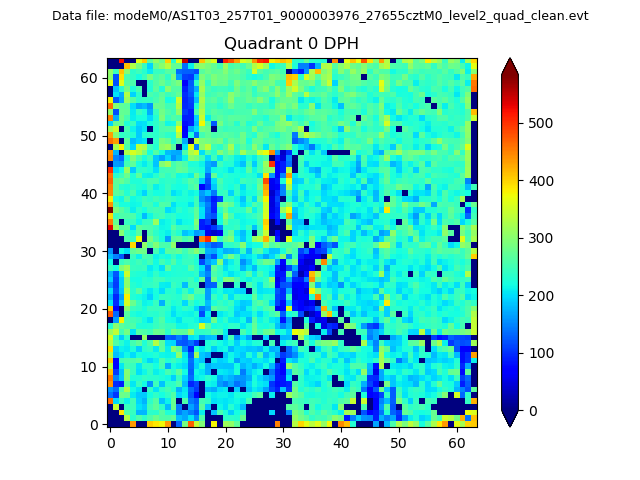 |
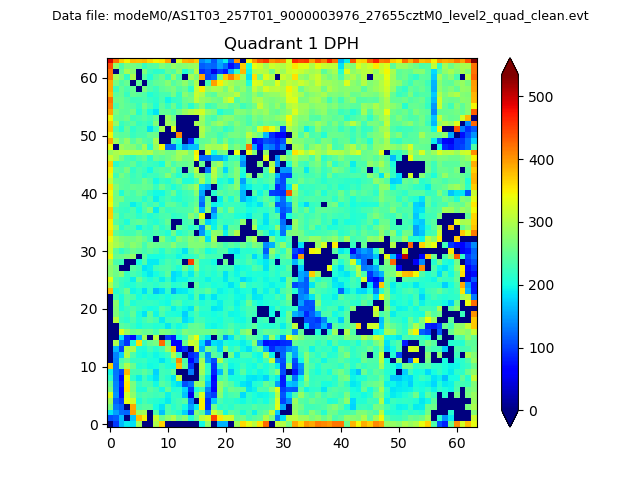 |
Quadrant B |
|---|---|---|---|
| Quadrant D | 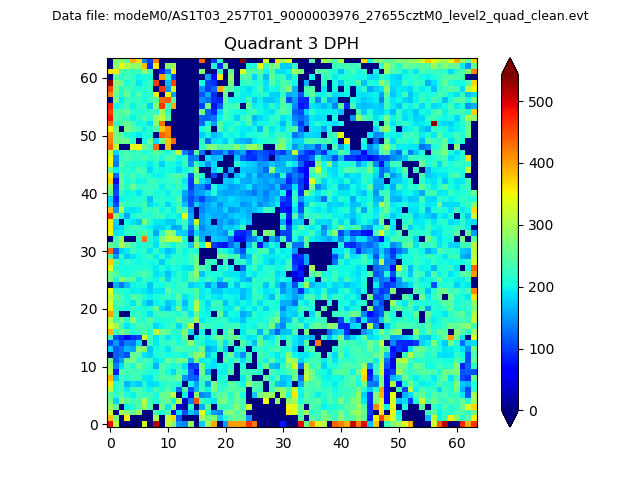 |
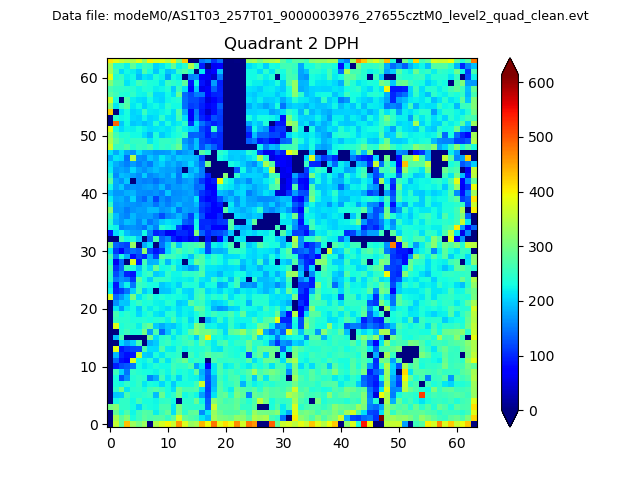 |
Quadrant C |
| Plot type | Count rate plots | Images |
|---|---|---|
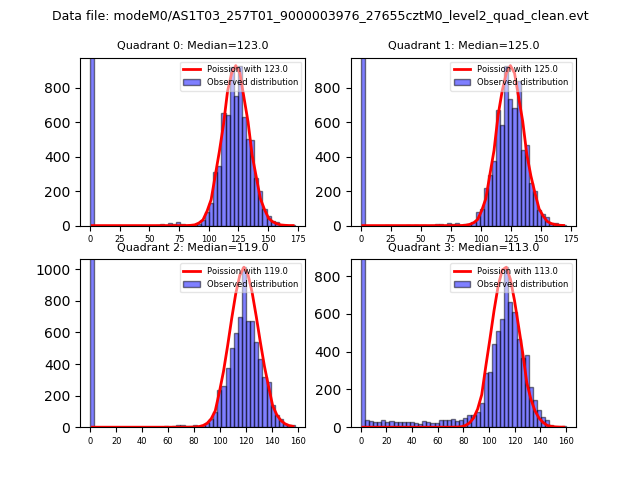
| Comparison with Poisson distribution Blue bars denote a histogram of data divided into 1 sec bins. Red curve is a Poisson curve with rate = median count rate of data. |
 |
 |
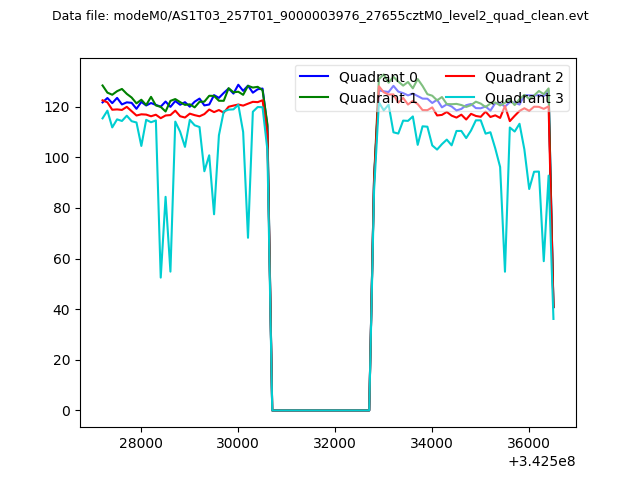
| Quadrant-wise count rates Data is divided into 100 sec bins |
 |
|
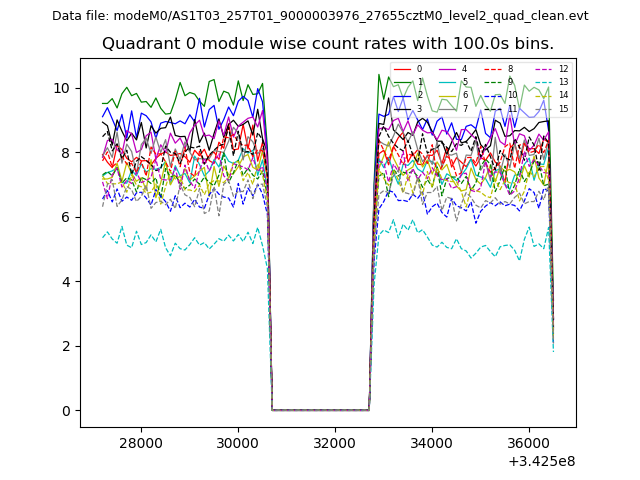
| Module-wise count rates for Quadrant A Data is divided into 100 sec bins |
 |
 |
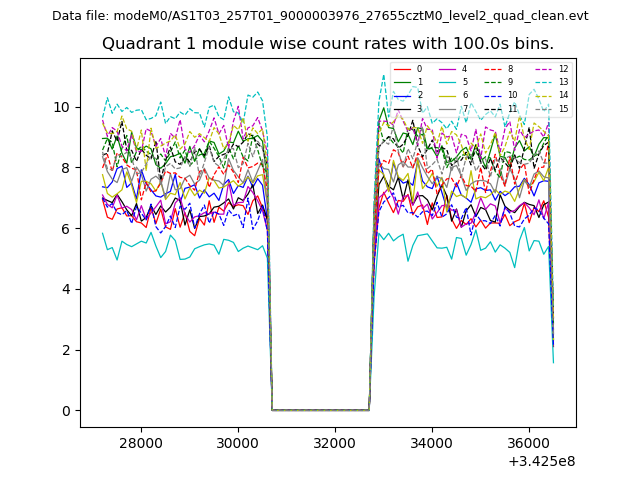
| Module-wise count rates for Quadrant B Data is divided into 100 sec bins |
 |
 |
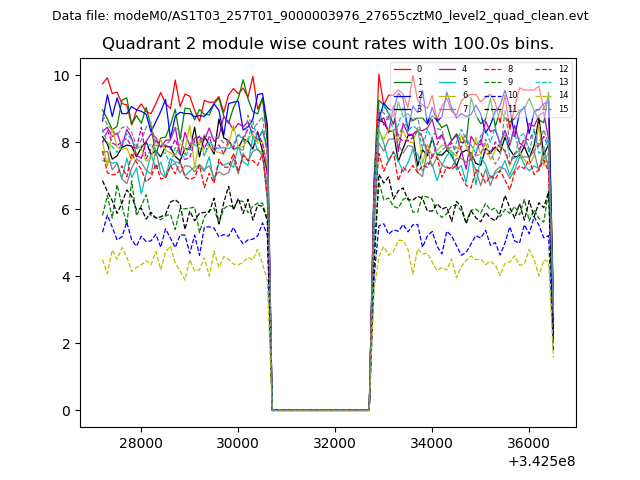
| Module-wise count rates for Quadrant C Data is divided into 100 sec bins |
 |
 |
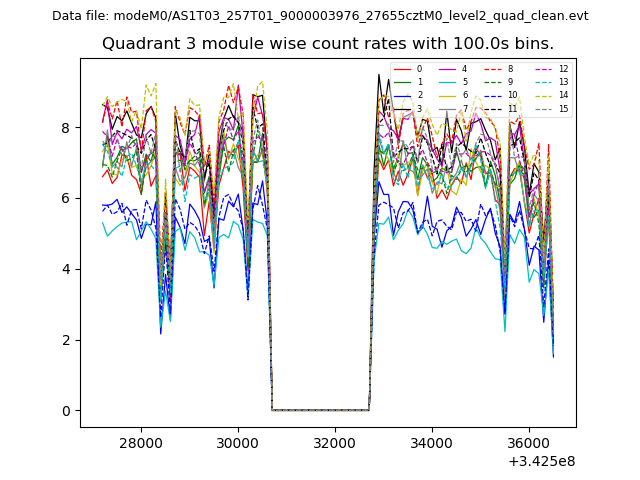
| Module-wise count rates for Quadrant D Data is divided into 100 sec bins |
 |
 |
| Parameter | Plot |
|---|---|
| CZT HV Monitor | 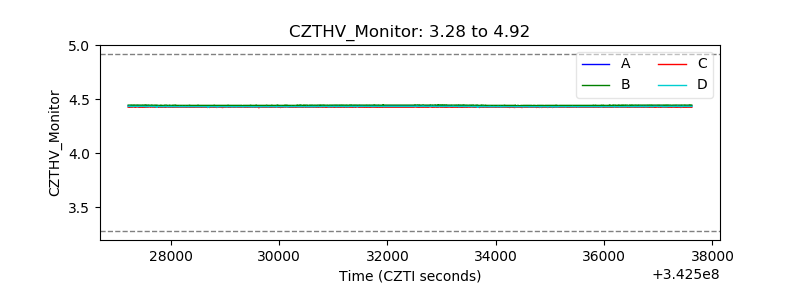 |
| D_VDD | 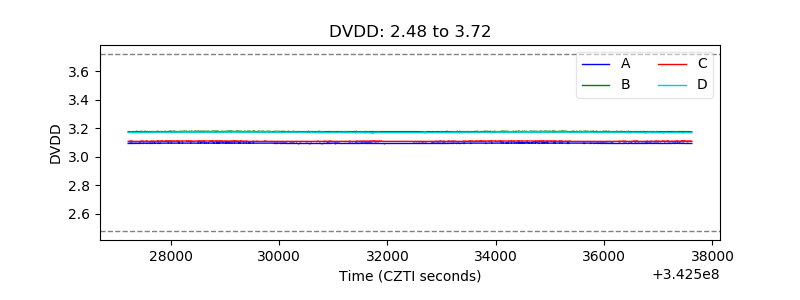 |
| Temperature 1 | 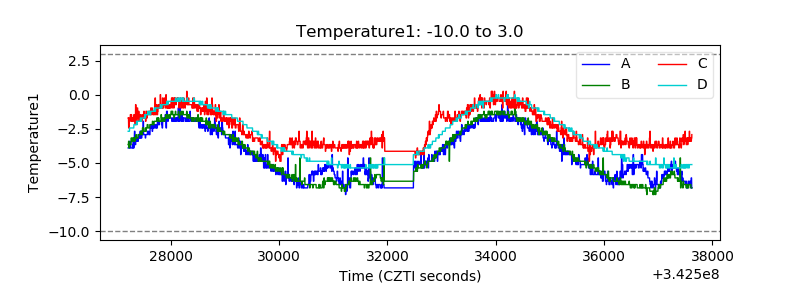 |
| Veto HV Monitor | 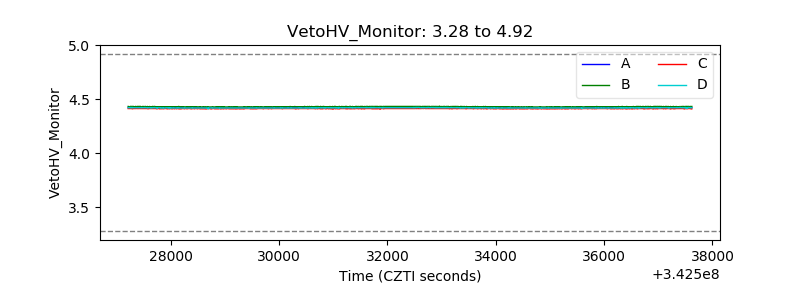 |
| Veto LLD | 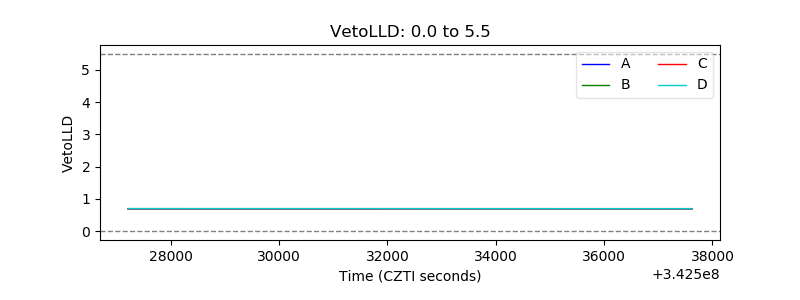 |
| Alpha Counter | 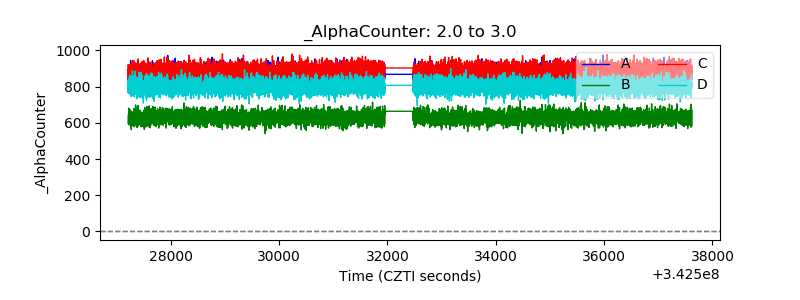 |
| _CPM_Rate | 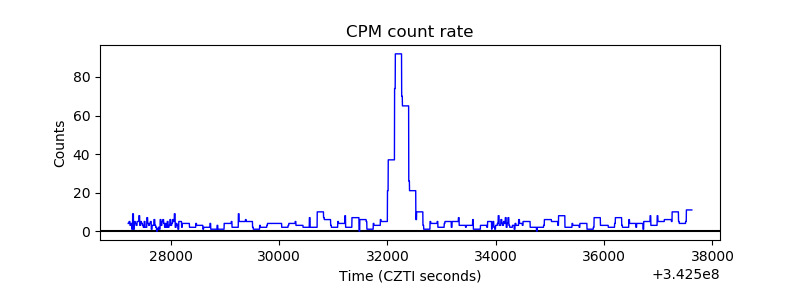 |
| CZT Counter | 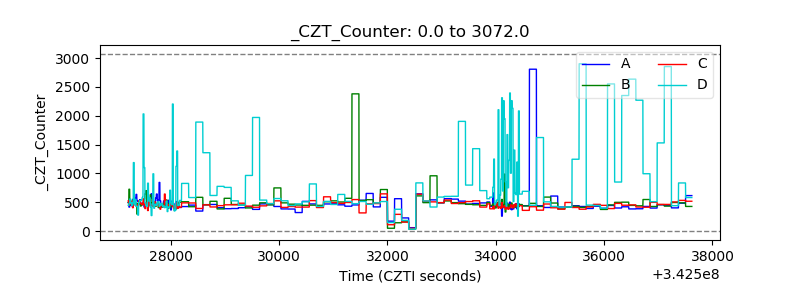 |
| +2.5 Volts monitor |  |
| +5 Volts monitor |  |
| _ROLL_ROT |  |
| _Roll_DEC | 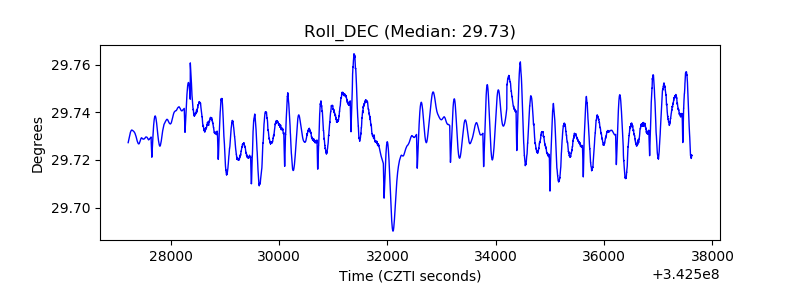 |
| _Roll_RA | 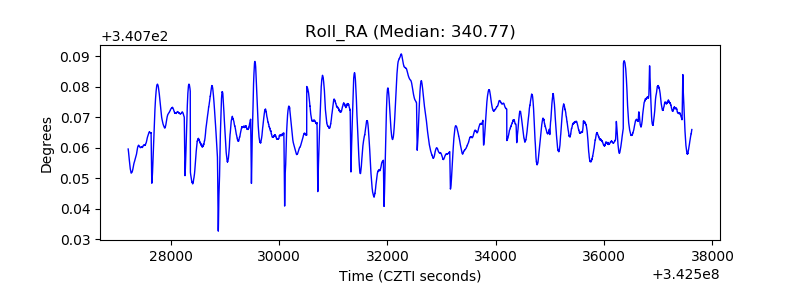 |
| Veto Counter |  |