| Param | Original file | Final file |
|---|---|---|
| Filename | modeM0/AS1T03_257T01_9000003976_27656cztM0_level2.evt | modeM0/AS1T03_257T01_9000003976_27656cztM0_level2_quad_clean.evt |
| Size (bytes) | 681,131,520 | 103,325,760 |
| Size | 649.6 MB | 98.5 MB |
| Events in quadrant A | 3,738,338 | 674,415 |
| Events in quadrant B | 3,927,742 | 685,187 |
| Events in quadrant C | 3,764,296 | 650,595 |
| Events in quadrant D | 8,674,554 | 581,064 |
| Mode M9 | |||
|---|---|---|---|
| Quadrant | BADHDUFLAG | Total packets | Discarded packets |
| A | 0 | 16 | 0 |
| B | 0 | 16 | 0 |
| C | 0 | 16 | 0 |
| D | 0 | 16 | 0 |
| Mode M0 | |||
|---|---|---|---|
| Quadrant | BADHDUFLAG | Total packets | Discarded packets |
| A | 0 | 16088 | 0 |
| B | 0 | 16444 | 0 |
| C | 0 | 16062 | 0 |
| D | 0 | 31080 | 0 |
| Quadrant | Total seconds | Saturated seconds | Saturation percentage |
|---|---|---|---|
| A | 7730 | 109 | 1.410091% |
| B | 7730 | 124 | 1.604140% |
| C | 7730 | 136 | 1.759379% |
| D | 7729 | 1201 | 15.538880% |
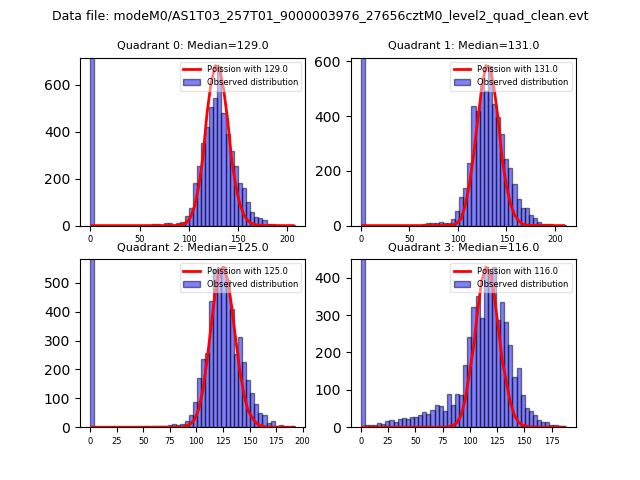
Noise dominated data is calculated using 1-second bins in cleaned event files. If a bin has >2000 counts, and if more than 50% of those come from <1% of pixels, then it is considered to be noise-dominated and hence unusable.
| Quadrant | # 1 sec bins | Bins with >0 counts | Bins with >2000 counts | High rate bins dominated by noise | Noise dominated (total time) | Noise dominated (detector-on time) | Marked lightcurve |
|---|---|---|---|---|---|---|---|
| A | 9330 | 7730 | 0 | 0 | 0.00% | 0.00% |  |
| B | 9330 | 7730 | 7 | 7 | 0.08% | 0.09% |  |
| C | 9330 | 7730 | 1 | 1 | 0.01% | 0.01% |  |
| D | 9329 | 7729 | 1134 | 1134 | 12.16% | 14.67% |  |
Top three noisy pixels from each quadrant. If the there are fewer than three noisy pixels in the level2.evt file, extra rows are filled as -1
| Pixel properties | Quadrant properties | ||||||
|---|---|---|---|---|---|---|---|
| Quadrant | DetID | PixID | Counts | Sigma | Mean | Median | Sigma |
| A | 13 | 254 | 13771 | 65.73 | 962 | 940 | 195.2 |
| A | 6 | 16 | 11185 | 52.48 | 962 | 940 | 195.2 |
| A | 8 | 192 | 9437 | 43.53 | 962 | 940 | 195.2 |
| B | 10 | 245 | 52080 | 277.74 | 953 | 928 | 184.2 |
| B | 0 | 183 | 51174 | 272.82 | 953 | 928 | 184.2 |
| B | 0 | 230 | 31498 | 165.98 | 953 | 928 | 184.2 |
| C | 14 | 238 | 147118 | 675.82 | 919 | 922 | 216.3 |
| C | 2 | 16 | 28975 | 129.68 | 919 | 922 | 216.3 |
| C | 3 | 233 | 7511 | 30.46 | 919 | 922 | 216.3 |
| D | 7 | 80 | 2381150 | 11171.56 | 889 | 863 | 213.1 |
| D | 1 | 52 | 2273659 | 10667.07 | 889 | 863 | 213.1 |
| D | 11 | 176 | 291775 | 1365.36 | 889 | 863 | 213.1 |
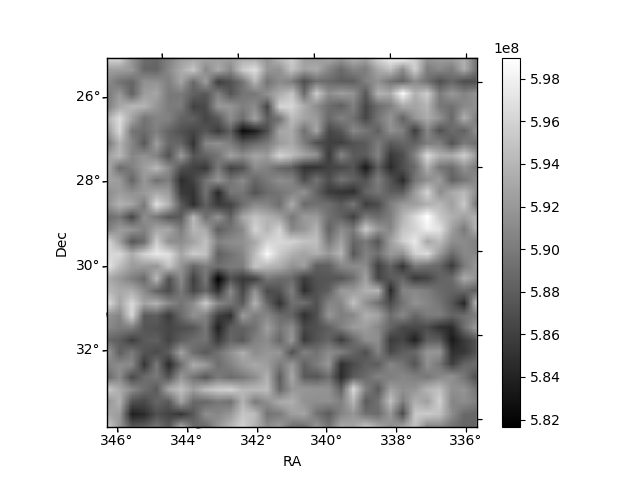
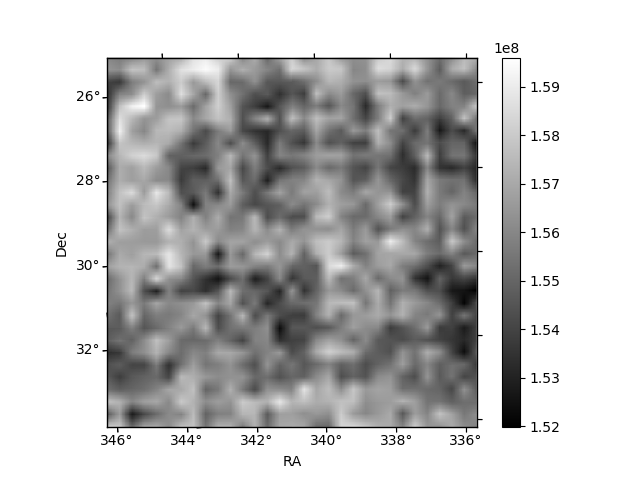
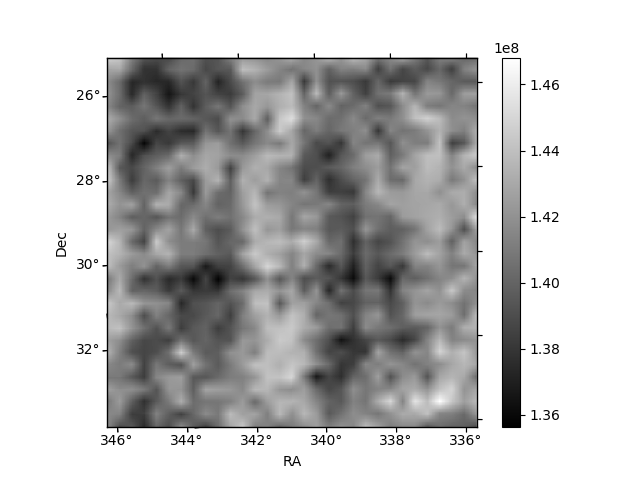
Histogram calculated using DETX and DETY for each event in the final _common_clean file
| Quadrant A | 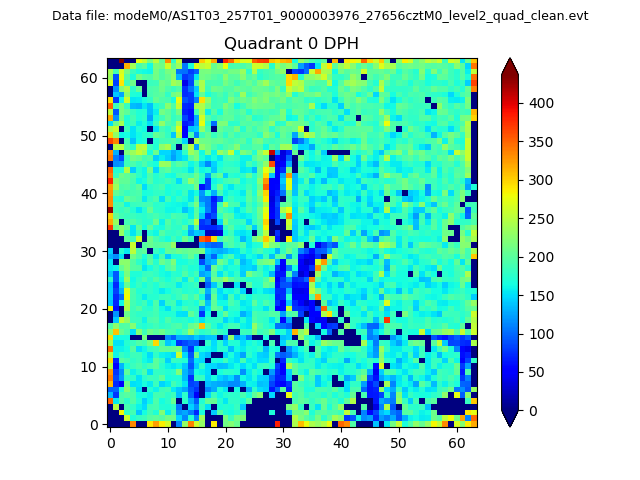 |
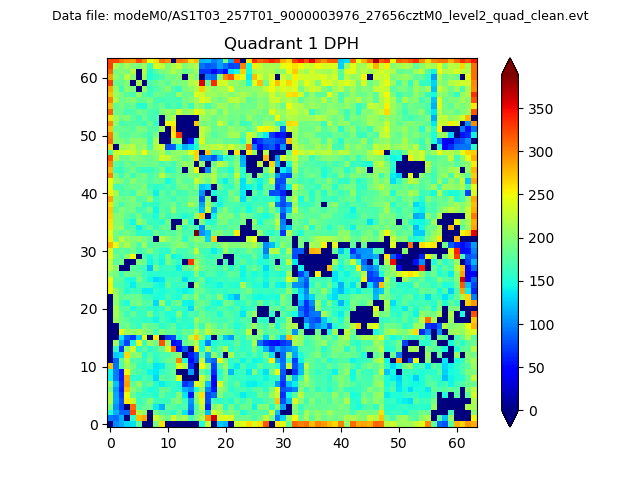 |
Quadrant B |
|---|---|---|---|
| Quadrant D | 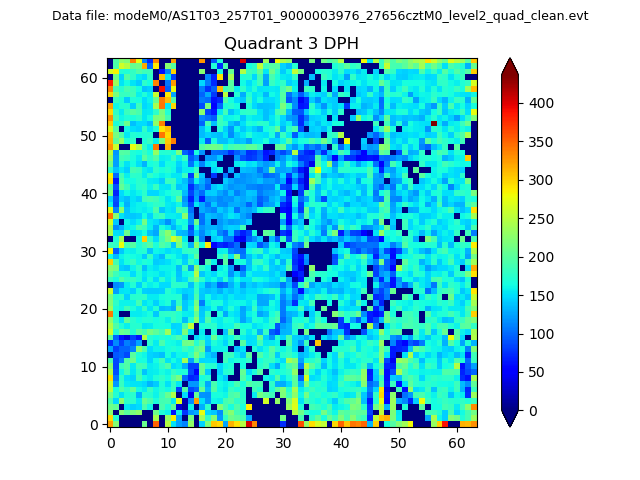 |
 |
Quadrant C |
| Plot type | Count rate plots | Images |
|---|---|---|
| Comparison with Poisson distribution Blue bars denote a histogram of data divided into 1 sec bins. Red curve is a Poisson curve with rate = median count rate of data. |
 |
 |
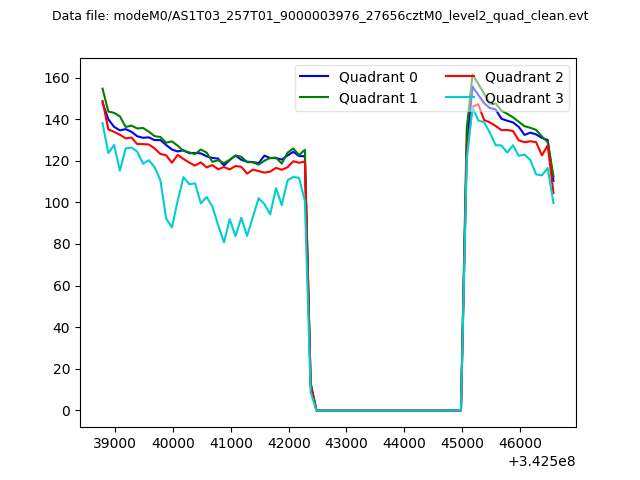
| Quadrant-wise count rates Data is divided into 100 sec bins |
 |
|
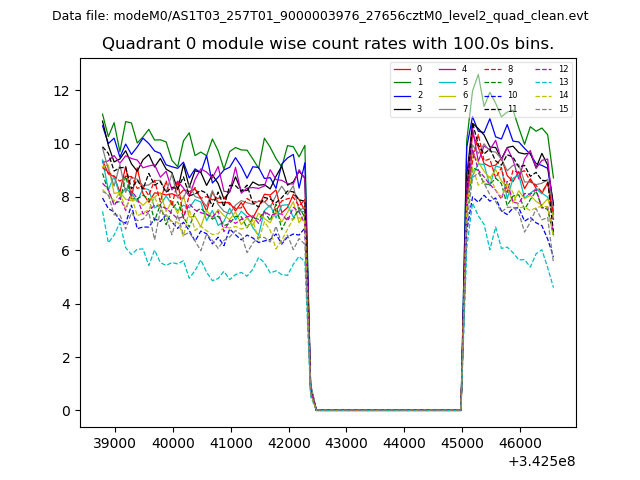
| Module-wise count rates for Quadrant A Data is divided into 100 sec bins |
 |
 |
| Module-wise count rates for Quadrant B Data is divided into 100 sec bins |
 |
 |
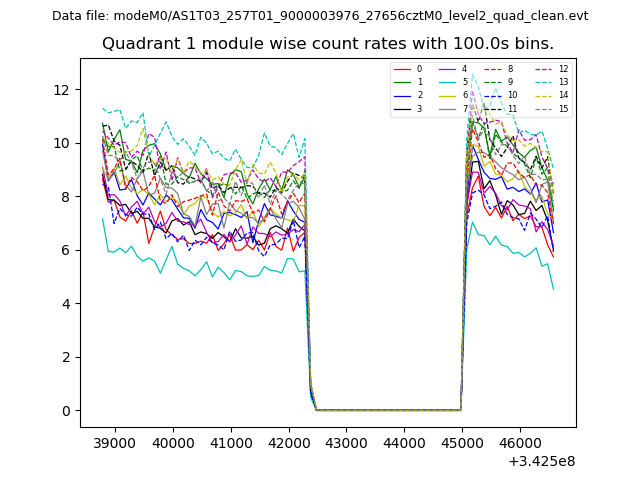
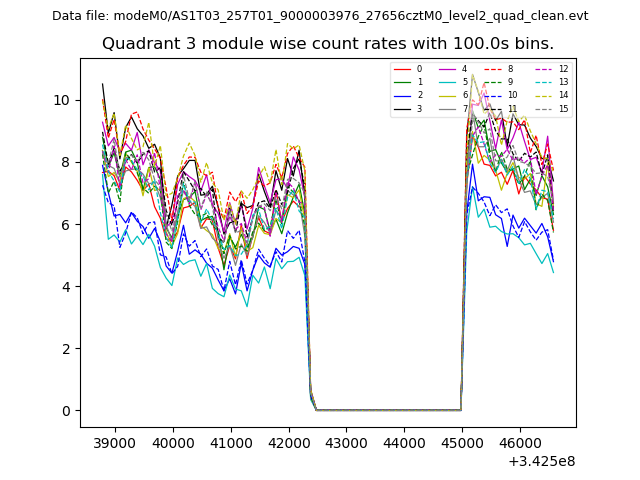
| Module-wise count rates for Quadrant C Data is divided into 100 sec bins |
 |
 |
| Module-wise count rates for Quadrant D Data is divided into 100 sec bins |
 |
 |
| Parameter | Plot |
|---|---|
| CZT HV Monitor | 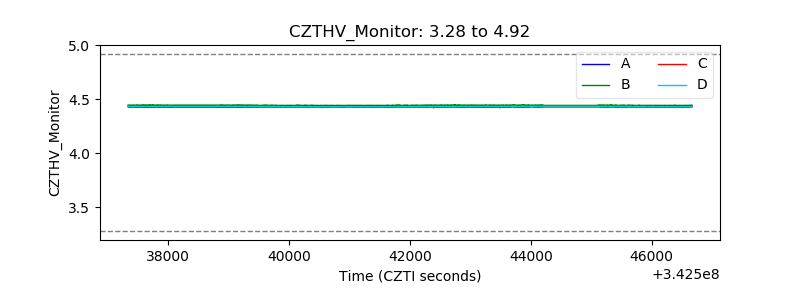 |
| D_VDD | 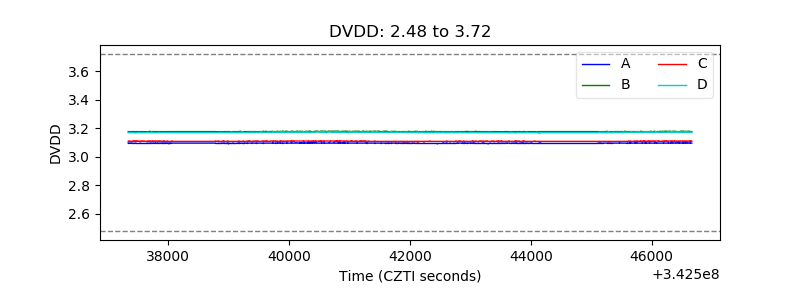 |
| Temperature 1 | 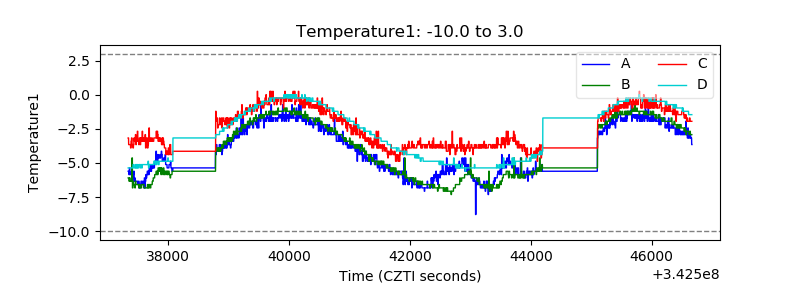 |
| Veto HV Monitor | 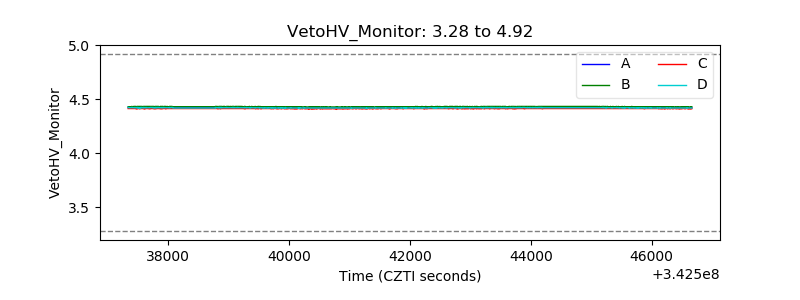 |
| Veto LLD | 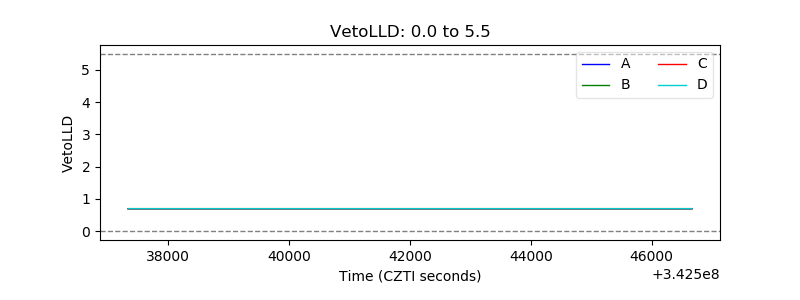 |
| Alpha Counter |  |
| _CPM_Rate |  |
| CZT Counter | 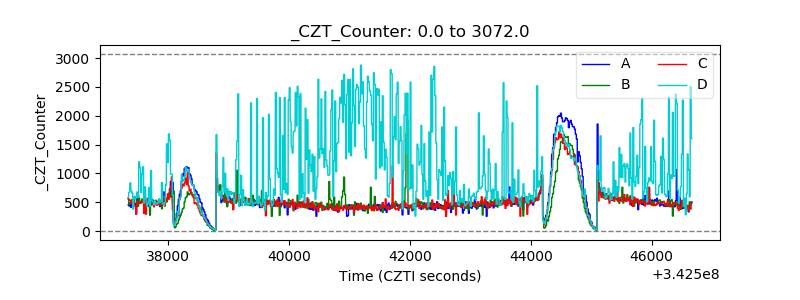 |
| +2.5 Volts monitor | 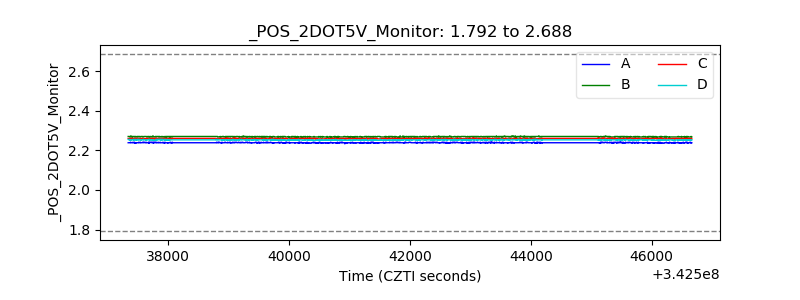 |
| +5 Volts monitor |  |
| _ROLL_ROT |  |
| _Roll_DEC | 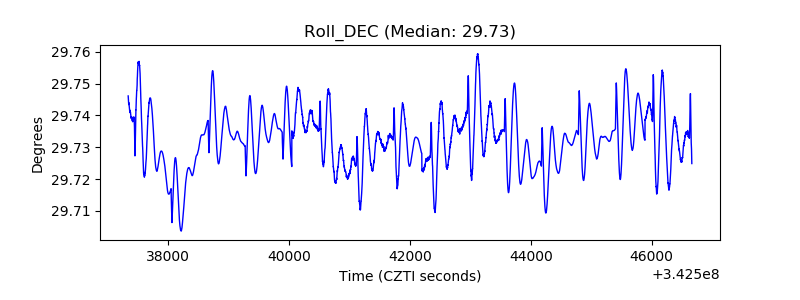 |
| _Roll_RA | 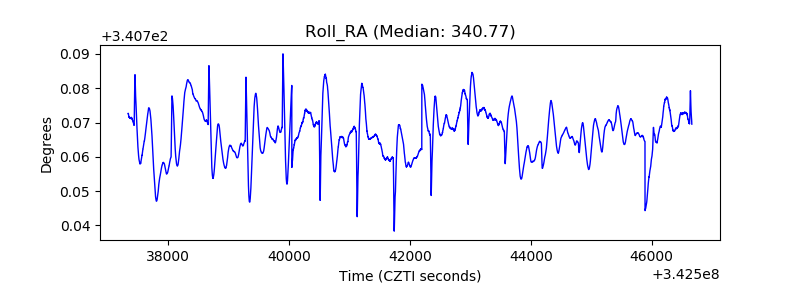 |
| Veto Counter | 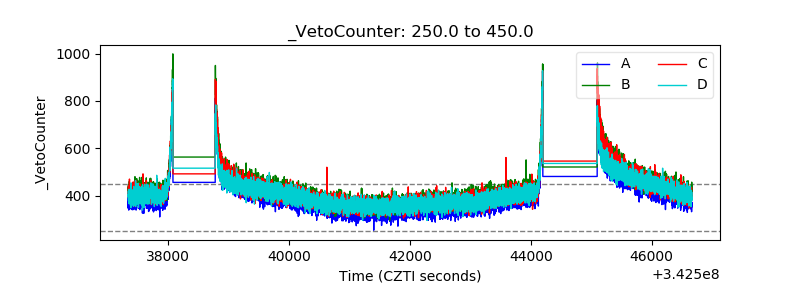 |