| Param | Original file | Final file |
|---|---|---|
| Filename | modeM0/AS1T03_257T01_9000003976_27657cztM0_level2.evt | modeM0/AS1T03_257T01_9000003976_27657cztM0_level2_quad_clean.evt |
| Size (bytes) | 539,052,480 | 85,066,560 |
| Size | 514.1 MB | 81.1 MB |
| Events in quadrant A | 3,021,913 | 557,303 |
| Events in quadrant B | 3,088,453 | 565,006 |
| Events in quadrant C | 3,064,785 | 532,255 |
| Events in quadrant D | 6,733,041 | 491,773 |
| Mode M9 | |||
|---|---|---|---|
| Quadrant | BADHDUFLAG | Total packets | Discarded packets |
| A | 0 | 11 | 0 |
| B | 0 | 11 | 0 |
| C | 0 | 11 | 0 |
| D | 0 | 11 | 0 |
| Mode M0 | |||
|---|---|---|---|
| Quadrant | BADHDUFLAG | Total packets | Discarded packets |
| A | 0 | 13034 | 0 |
| B | 0 | 13079 | 0 |
| C | 0 | 13053 | 0 |
| D | 0 | 24306 | 0 |
| Quadrant | Total seconds | Saturated seconds | Saturation percentage |
|---|---|---|---|
| A | 6157 | 38 | 0.617184% |
| B | 6156 | 50 | 0.812216% |
| C | 6157 | 78 | 1.266851% |
| D | 6157 | 819 | 13.301933% |
Noise dominated data is calculated using 1-second bins in cleaned event files. If a bin has >2000 counts, and if more than 50% of those come from <1% of pixels, then it is considered to be noise-dominated and hence unusable.
| Quadrant | # 1 sec bins | Bins with >0 counts | Bins with >2000 counts | High rate bins dominated by noise | Noise dominated (total time) | Noise dominated (detector-on time) | Marked lightcurve |
|---|---|---|---|---|---|---|---|
| A | 7232 | 6157 | 1 | 1 | 0.01% | 0.02% | 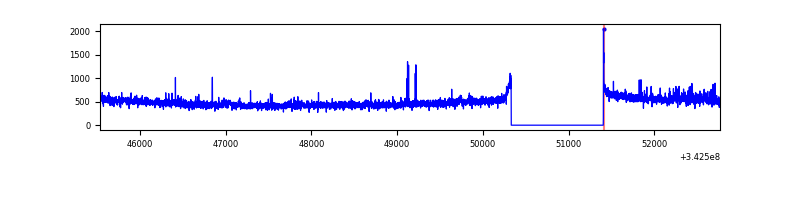 |
| B | 7231 | 6156 | 8 | 8 | 0.11% | 0.13% | 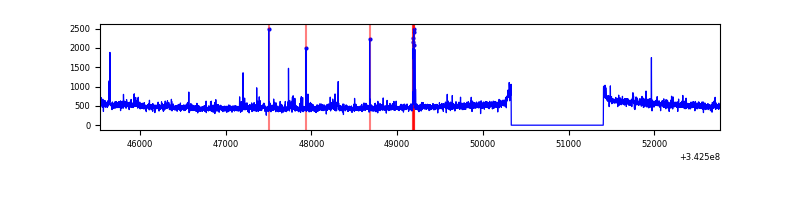 |
| C | 7232 | 6157 | 15 | 15 | 0.21% | 0.24% | 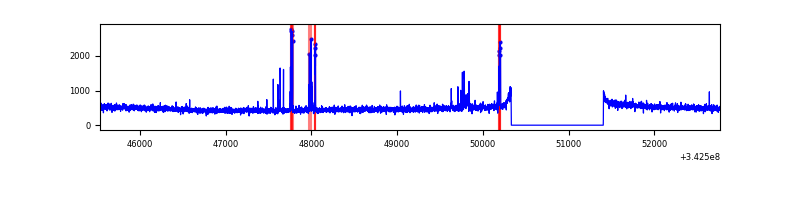 |
| D | 7231 | 6156 | 783 | 783 | 10.83% | 12.72% | 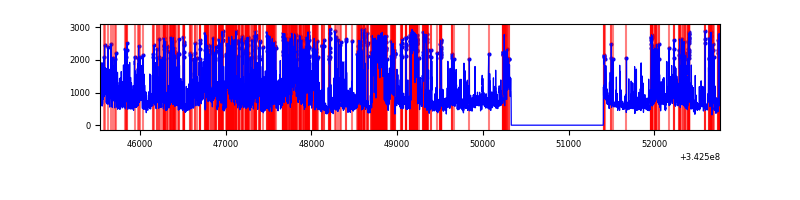 |
Top three noisy pixels from each quadrant. If the there are fewer than three noisy pixels in the level2.evt file, extra rows are filled as -1
| Pixel properties | Quadrant properties | ||||||
|---|---|---|---|---|---|---|---|
| Quadrant | DetID | PixID | Counts | Sigma | Mean | Median | Sigma |
| A | 6 | 16 | 90951 | 599.73 | 754 | 738 | 150.4 |
| A | 13 | 254 | 10642 | 65.84 | 754 | 738 | 150.4 |
| A | 15 | 174 | 9358 | 57.31 | 754 | 738 | 150.4 |
| B | 10 | 245 | 61168 | 422.95 | 749 | 730 | 142.9 |
| B | 0 | 230 | 48558 | 334.71 | 749 | 730 | 142.9 |
| B | 12 | 111 | 16754 | 112.14 | 749 | 730 | 142.9 |
| C | 2 | 16 | 116583 | 683.73 | 722 | 726 | 169.4 |
| C | 14 | 238 | 115623 | 678.06 | 722 | 726 | 169.4 |
| C | 3 | 233 | 14655 | 82.2 | 722 | 726 | 169.4 |
| D | 1 | 52 | 2881763 | 17537.6 | 690 | 670 | 164.3 |
| D | 7 | 80 | 1027511 | 6250.52 | 690 | 670 | 164.3 |
| D | 2 | 250 | 113740 | 688.27 | 690 | 670 | 164.3 |
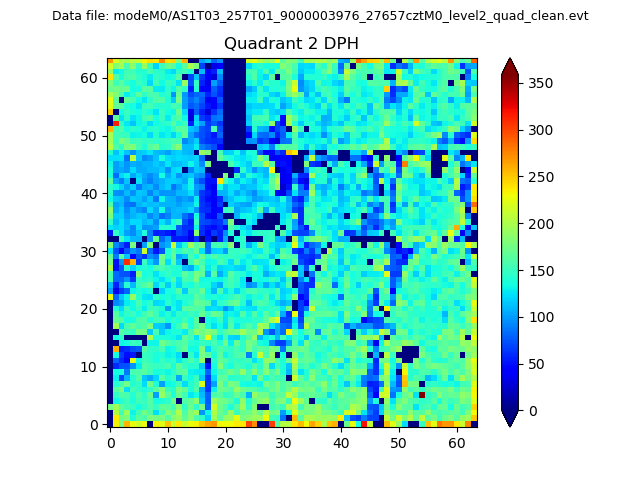
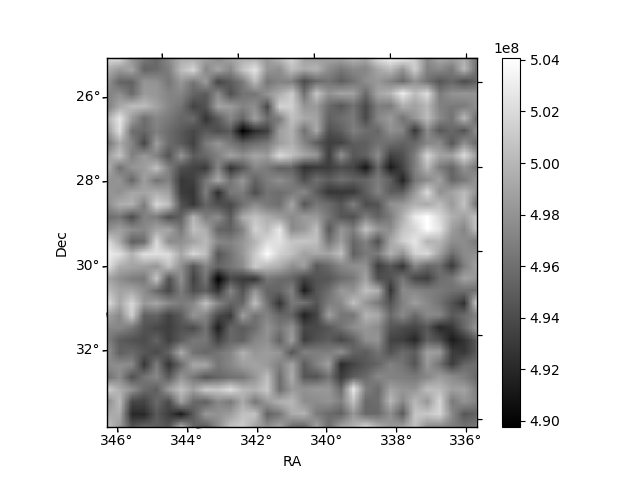
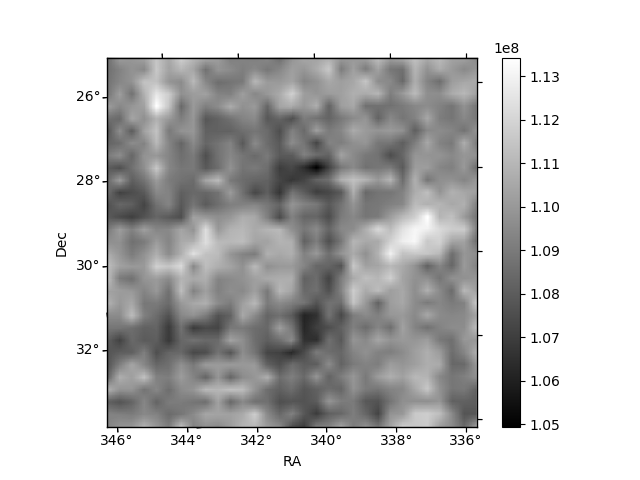
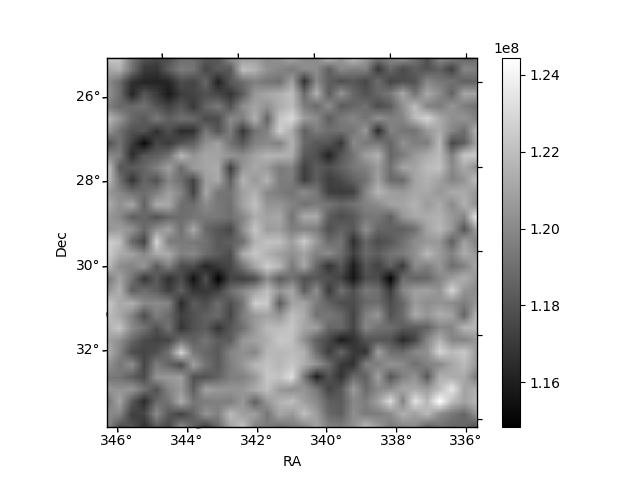
Histogram calculated using DETX and DETY for each event in the final _common_clean file
| Quadrant A | 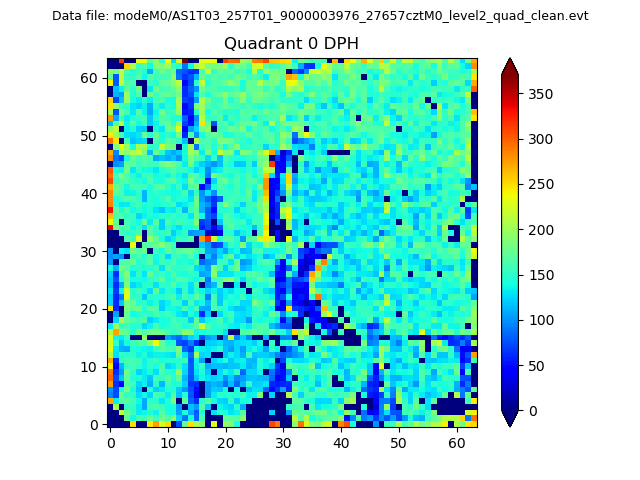 |
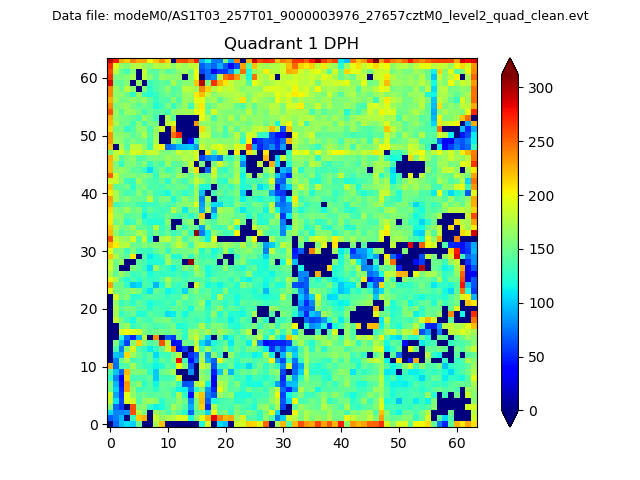 |
Quadrant B |
|---|---|---|---|
| Quadrant D | 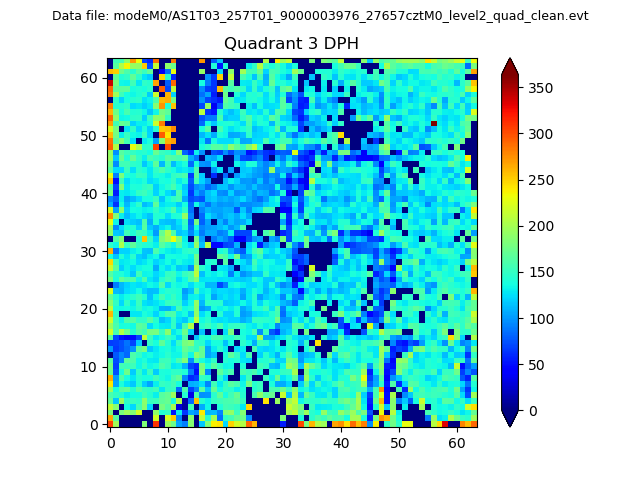 |
 |
Quadrant C |
| Plot type | Count rate plots | Images |
|---|---|---|
| Comparison with Poisson distribution Blue bars denote a histogram of data divided into 1 sec bins. Red curve is a Poisson curve with rate = median count rate of data. |
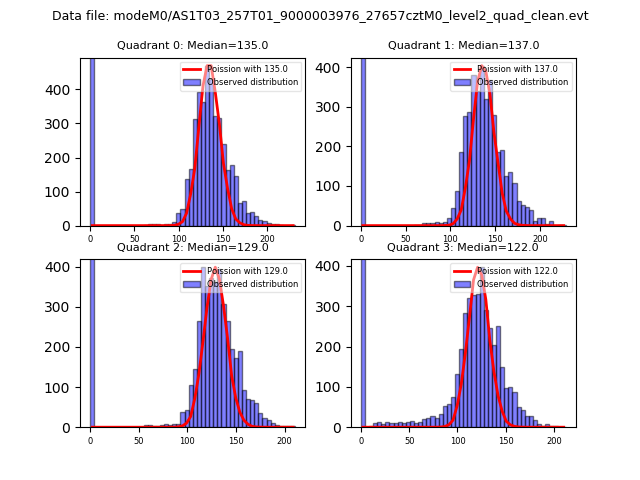 |
 |
| Quadrant-wise count rates Data is divided into 100 sec bins |
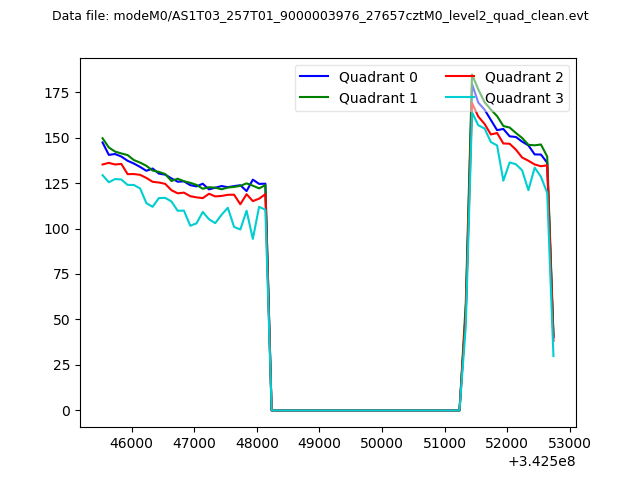 |
|
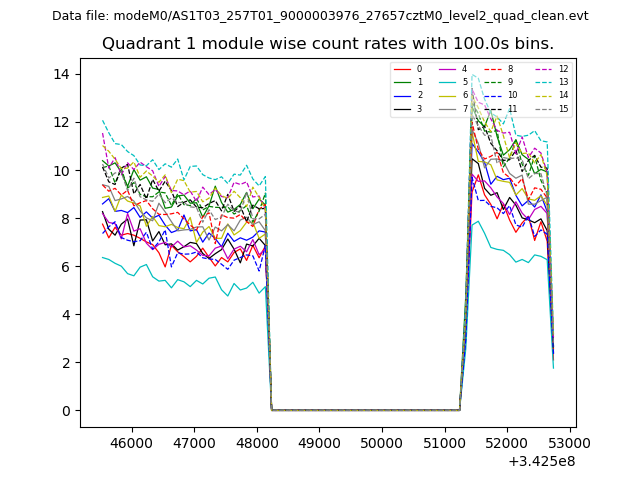
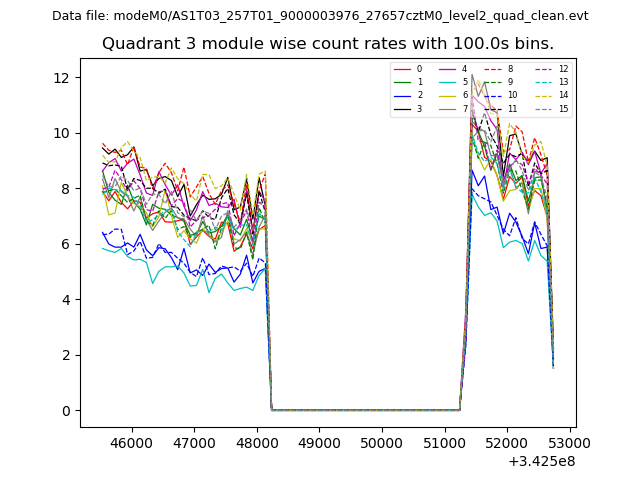
| Module-wise count rates for Quadrant A Data is divided into 100 sec bins |
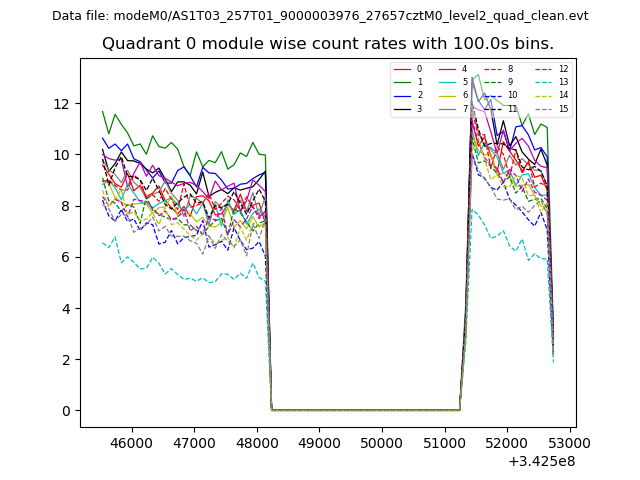 |
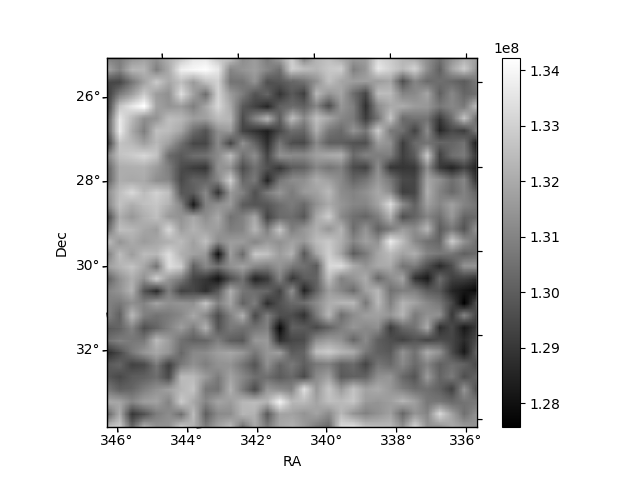 |
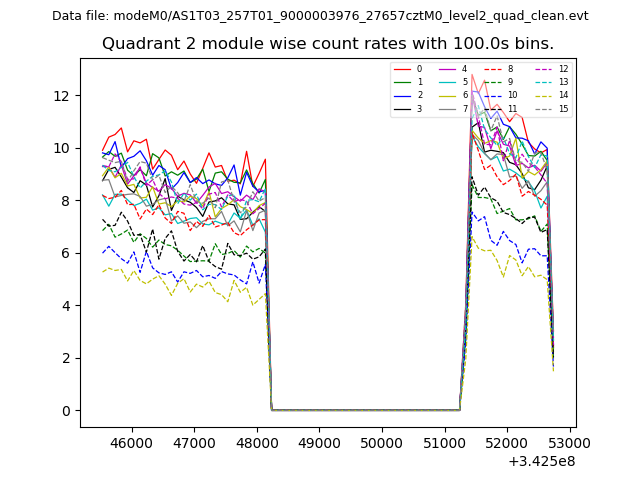
| Module-wise count rates for Quadrant B Data is divided into 100 sec bins |
 |
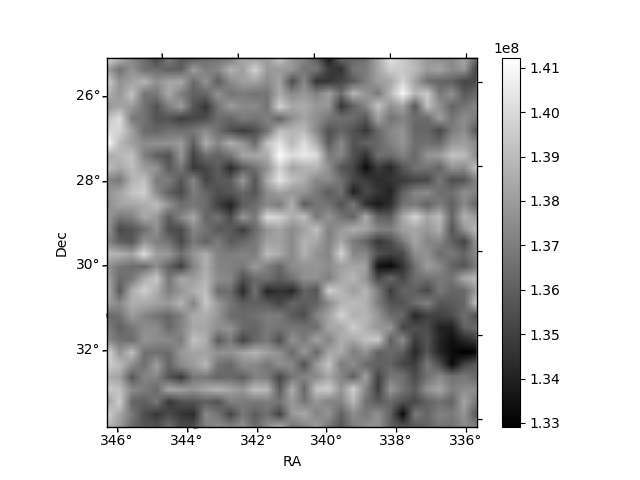 |
| Module-wise count rates for Quadrant C Data is divided into 100 sec bins |
 |
 |
| Module-wise count rates for Quadrant D Data is divided into 100 sec bins |
 |
 |
| Parameter | Plot |
|---|---|
| CZT HV Monitor | 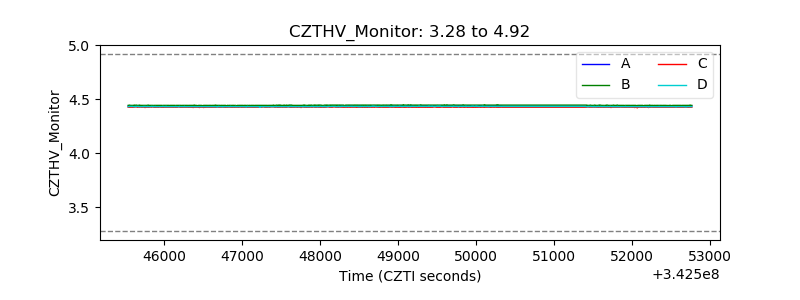 |
| D_VDD | 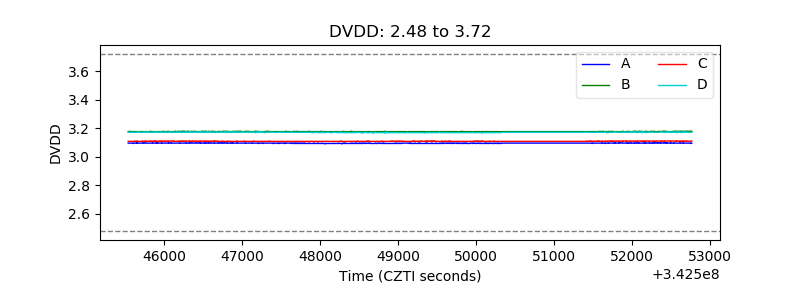 |
| Temperature 1 | 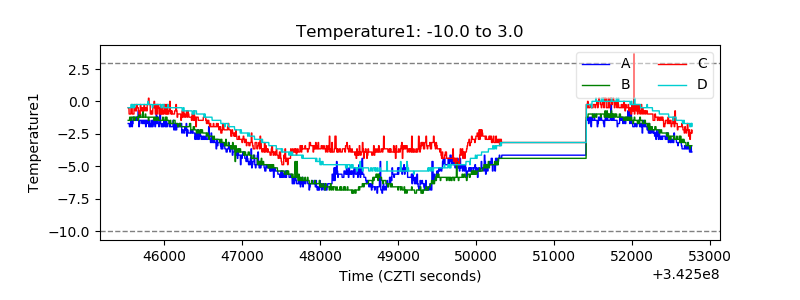 |
| Veto HV Monitor | 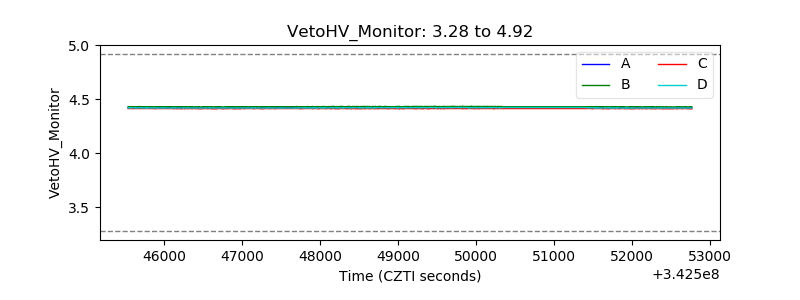 |
| Veto LLD | 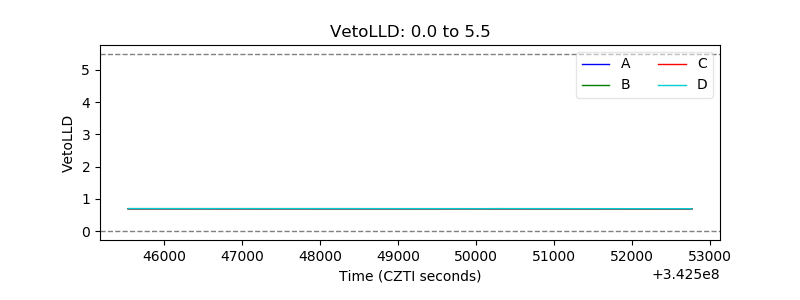 |
| Alpha Counter | 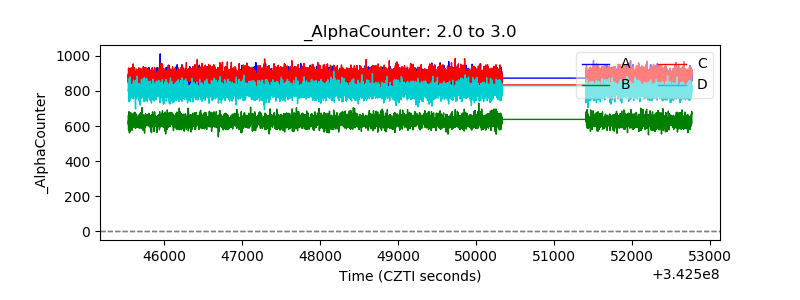 |
| _CPM_Rate | 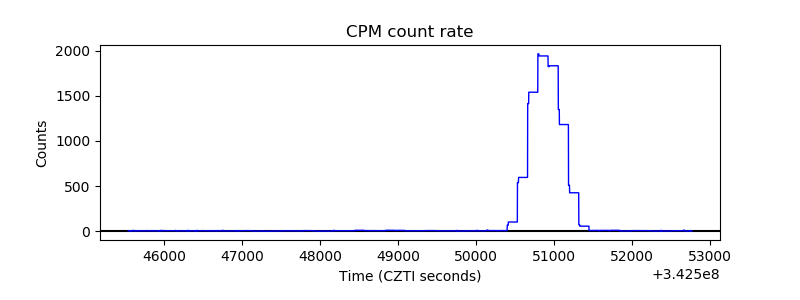 |
| CZT Counter |  |
| +2.5 Volts monitor |  |
| +5 Volts monitor |  |
| _ROLL_ROT | 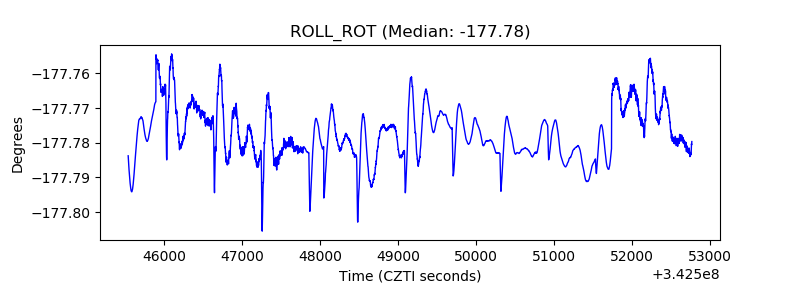 |
| _Roll_DEC | 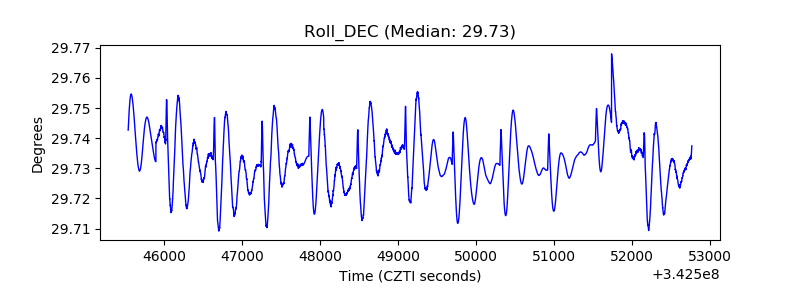 |
| _Roll_RA | 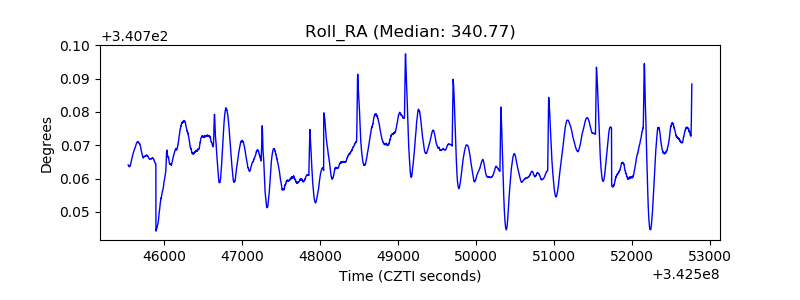 |
| Veto Counter |  |