| Param | Original file | Final file |
|---|---|---|
| Filename | modeM0/AS1T03_257T01_9000003976_27660cztM0_level2.evt | modeM0/AS1T03_257T01_9000003976_27660cztM0_level2_quad_clean.evt |
| Size (bytes) | 583,012,800 | 93,090,240 |
| Size | 556.0 MB | 88.8 MB |
| Events in quadrant A | 3,224,530 | 648,207 |
| Events in quadrant B | 3,293,838 | 671,045 |
| Events in quadrant C | 3,317,015 | 623,013 |
| Events in quadrant D | 7,400,921 | 443,410 |
| Mode M9 | |||
|---|---|---|---|
| Quadrant | BADHDUFLAG | Total packets | Discarded packets |
| A | 0 | 14 | 0 |
| B | 0 | 15 | 0 |
| C | 0 | 15 | 0 |
| D | 0 | 15 | 0 |
| Mode M0 | |||
|---|---|---|---|
| Quadrant | BADHDUFLAG | Total packets | Discarded packets |
| A | 0 | 13453 | 0 |
| B | 0 | 13653 | 0 |
| C | 0 | 13756 | 0 |
| D | 0 | 26156 | 0 |
| Quadrant | Total seconds | Saturated seconds | Saturation percentage |
|---|---|---|---|
| A | 6199 | 28 | 0.451686% |
| B | 6199 | 27 | 0.435554% |
| C | 6199 | 81 | 1.306662% |
| D | 6199 | 1779 | 28.698177% |
Noise dominated data is calculated using 1-second bins in cleaned event files. If a bin has >2000 counts, and if more than 50% of those come from <1% of pixels, then it is considered to be noise-dominated and hence unusable.
| Quadrant | # 1 sec bins | Bins with >0 counts | Bins with >2000 counts | High rate bins dominated by noise | Noise dominated (total time) | Noise dominated (detector-on time) | Marked lightcurve |
|---|---|---|---|---|---|---|---|
| A | 7499 | 6200 | 4 | 4 | 0.05% | 0.06% | 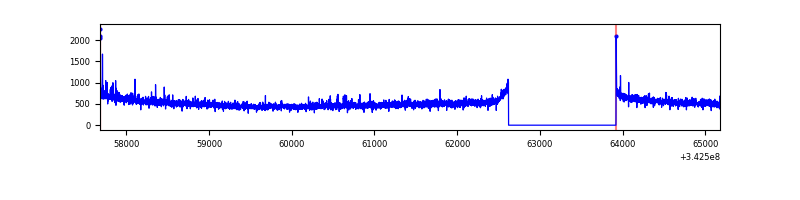 |
| B | 7499 | 6199 | 0 | 0 | 0.00% | 0.00% | 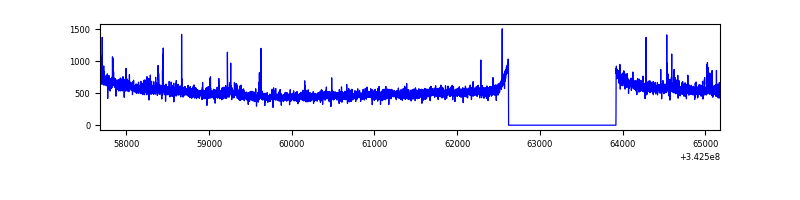 |
| C | 7499 | 6199 | 5 | 5 | 0.07% | 0.08% | 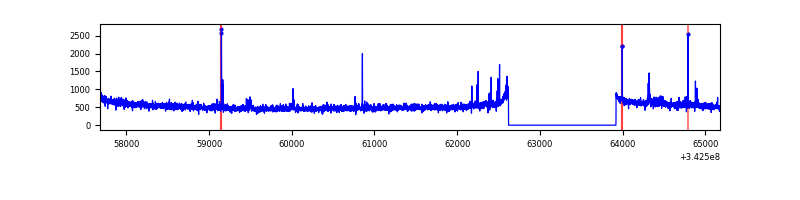 |
| D | 7499 | 6199 | 1283 | 1283 | 17.11% | 20.70% | 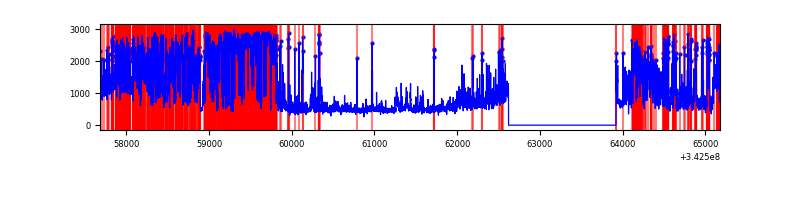 |
Top three noisy pixels from each quadrant. If the there are fewer than three noisy pixels in the level2.evt file, extra rows are filled as -1
| Pixel properties | Quadrant properties | ||||||
|---|---|---|---|---|---|---|---|
| Quadrant | DetID | PixID | Counts | Sigma | Mean | Median | Sigma |
| A | 6 | 16 | 52635 | 318.93 | 816 | 800 | 162.5 |
| A | 8 | 192 | 13290 | 76.85 | 816 | 800 | 162.5 |
| A | 13 | 248 | 11582 | 66.34 | 816 | 800 | 162.5 |
| B | 0 | 230 | 41488 | 267.7 | 819 | 801 | 152.0 |
| B | 5 | 255 | 18341 | 115.4 | 819 | 801 | 152.0 |
| B | 12 | 111 | 17733 | 111.4 | 819 | 801 | 152.0 |
| C | 14 | 238 | 126675 | 684.92 | 787 | 793 | 183.8 |
| C | 2 | 16 | 87401 | 471.23 | 787 | 793 | 183.8 |
| C | 3 | 233 | 27532 | 145.49 | 787 | 793 | 183.8 |
| D | 1 | 52 | 4501881 | 28253.27 | 666 | 649 | 159.3 |
| D | 7 | 80 | 227295 | 1422.61 | 666 | 649 | 159.3 |
| D | 2 | 250 | 127854 | 798.44 | 666 | 649 | 159.3 |
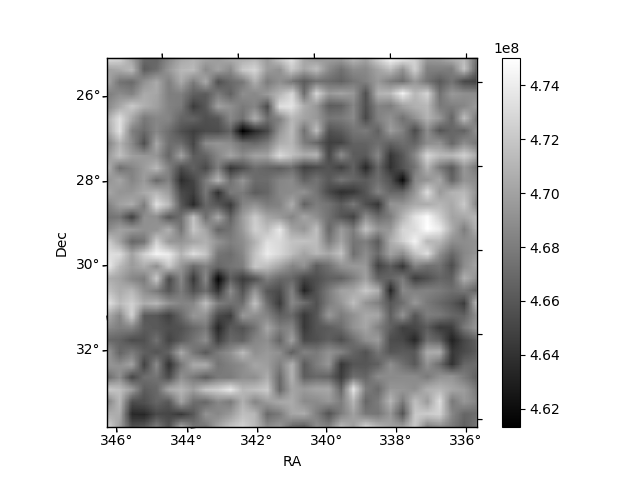
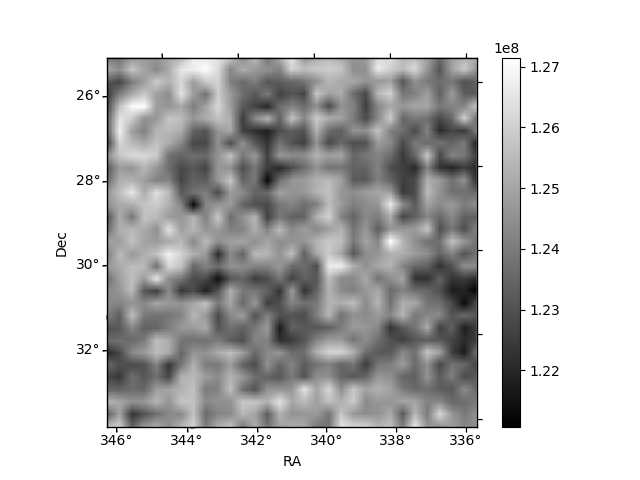
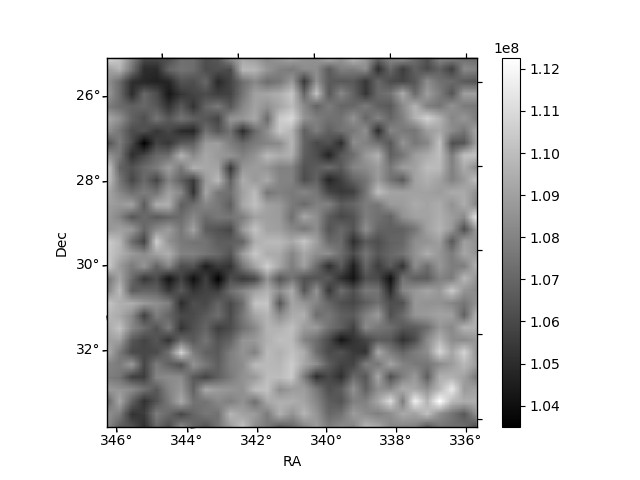
Histogram calculated using DETX and DETY for each event in the final _common_clean file
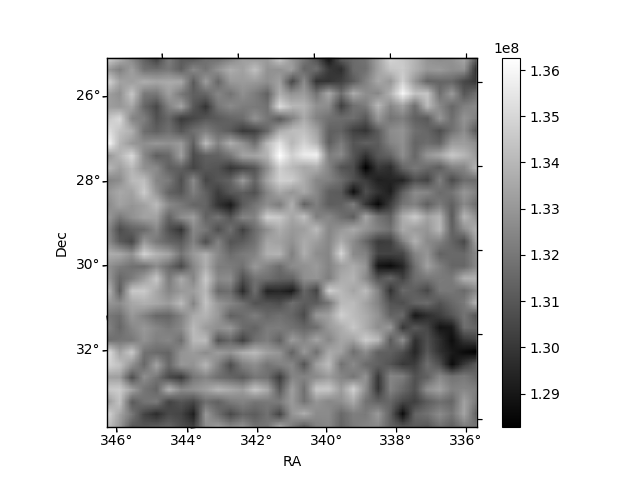
| Quadrant A | 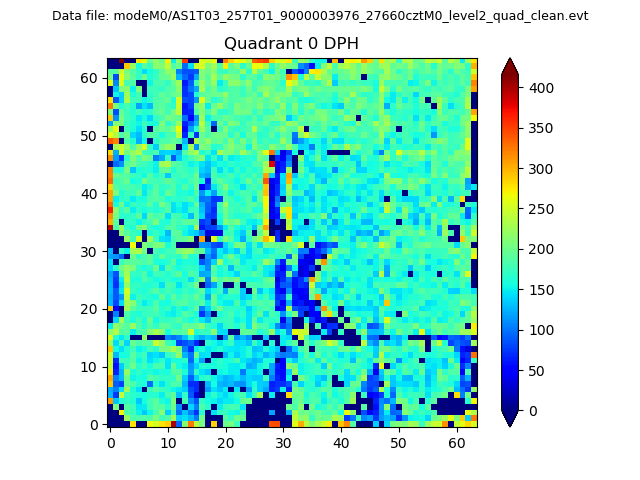 |
 |
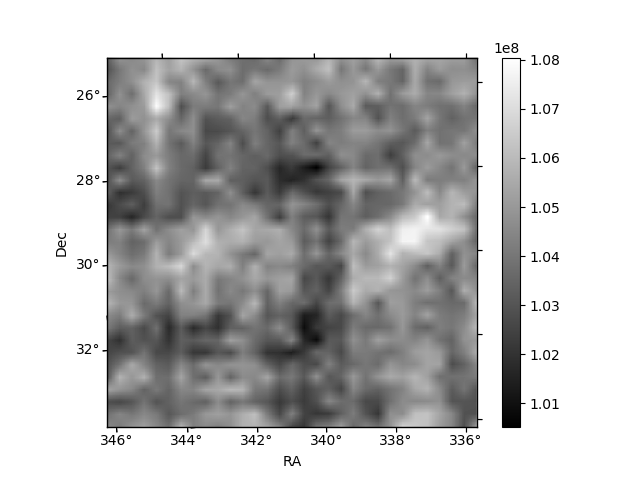
Quadrant B |
|---|---|---|---|
| Quadrant D | 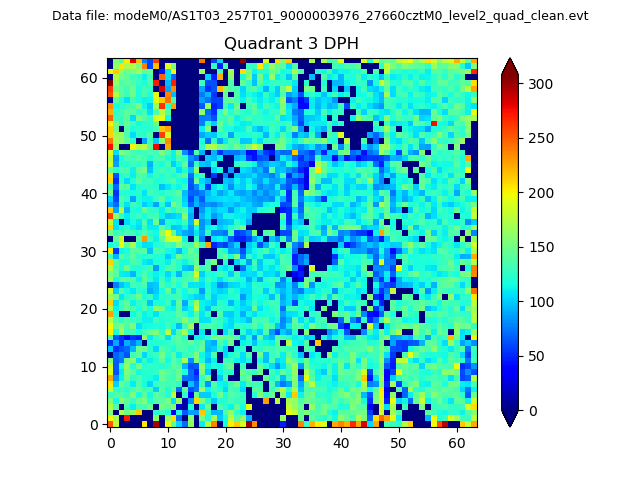 |
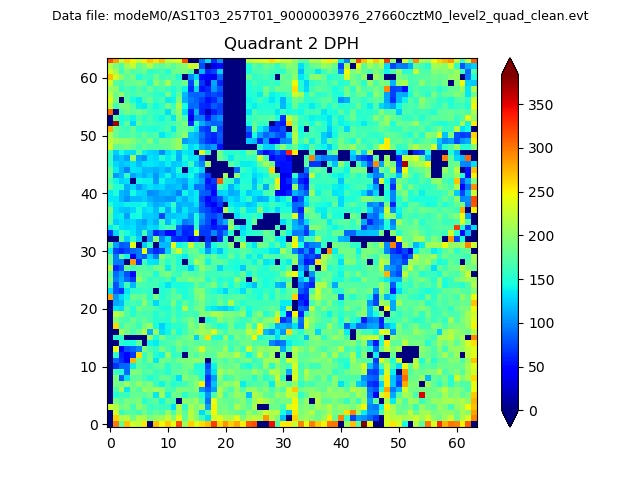 |
Quadrant C |
| Plot type | Count rate plots | Images |
|---|---|---|
| Comparison with Poisson distribution Blue bars denote a histogram of data divided into 1 sec bins. Red curve is a Poisson curve with rate = median count rate of data. |
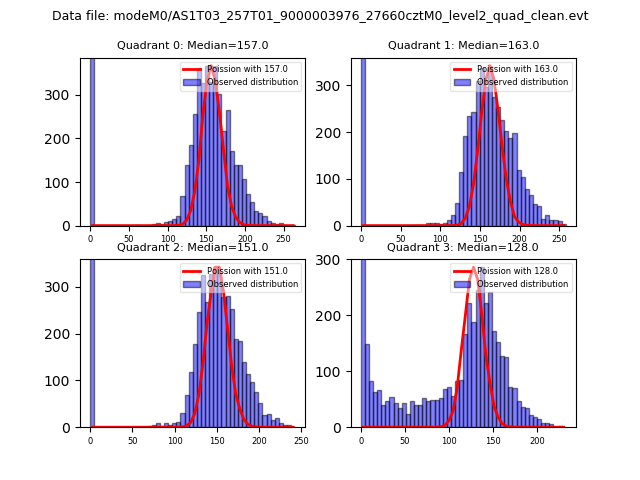 |
 |
| Quadrant-wise count rates Data is divided into 100 sec bins |
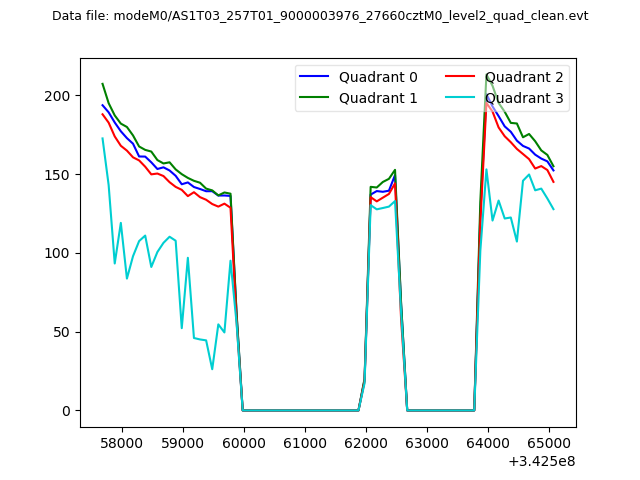 |
|
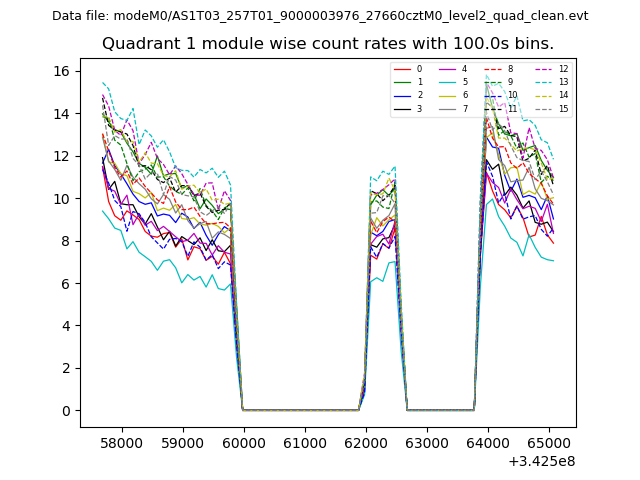
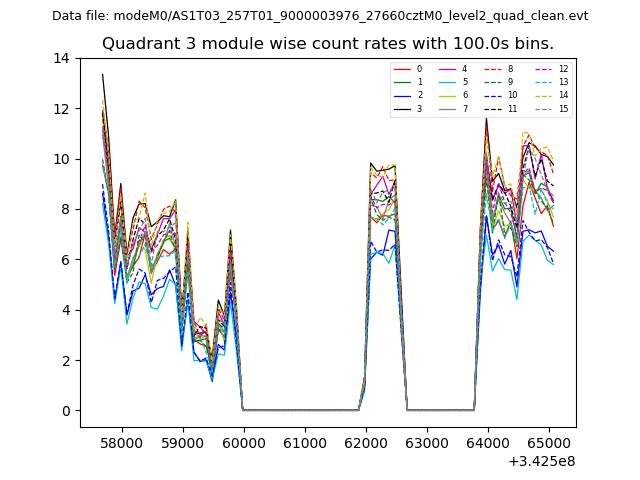
| Module-wise count rates for Quadrant A Data is divided into 100 sec bins |
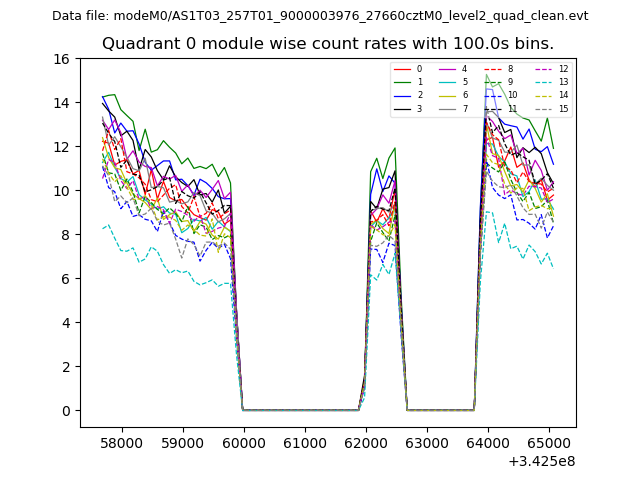 |
 |
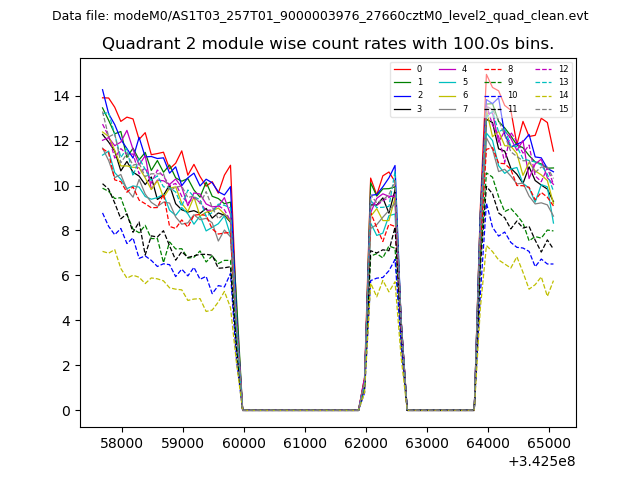
| Module-wise count rates for Quadrant B Data is divided into 100 sec bins |
 |
 |
| Module-wise count rates for Quadrant C Data is divided into 100 sec bins |
 |
 |
| Module-wise count rates for Quadrant D Data is divided into 100 sec bins |
 |
 |
| Parameter | Plot |
|---|---|
| CZT HV Monitor | 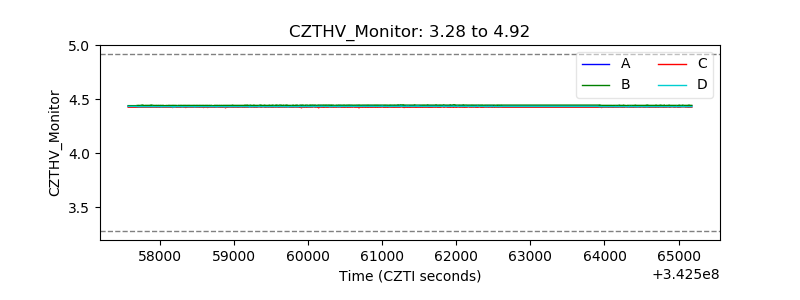 |
| D_VDD | 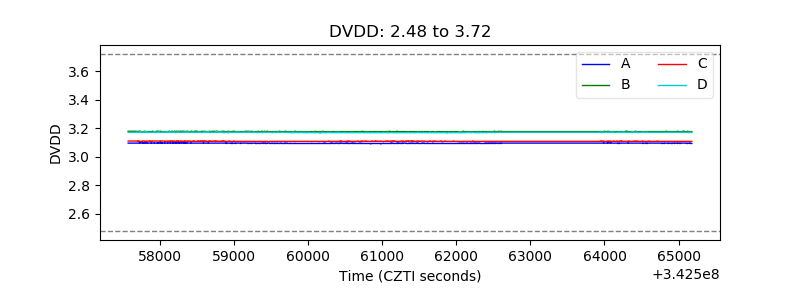 |
| Temperature 1 | 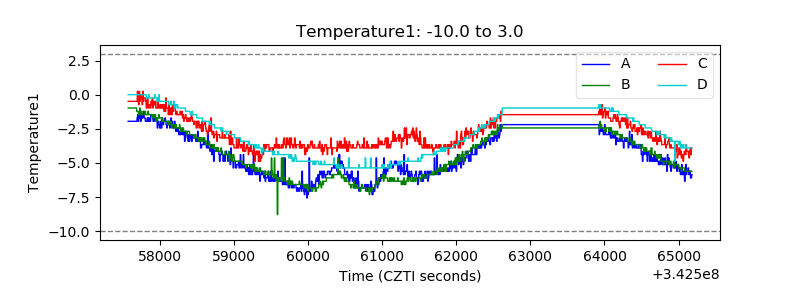 |
| Veto HV Monitor | 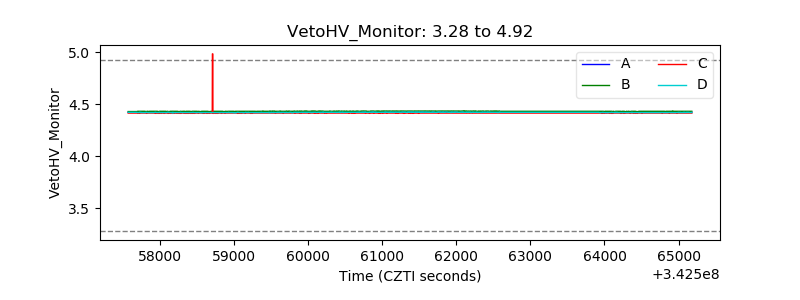 |
| Veto LLD | 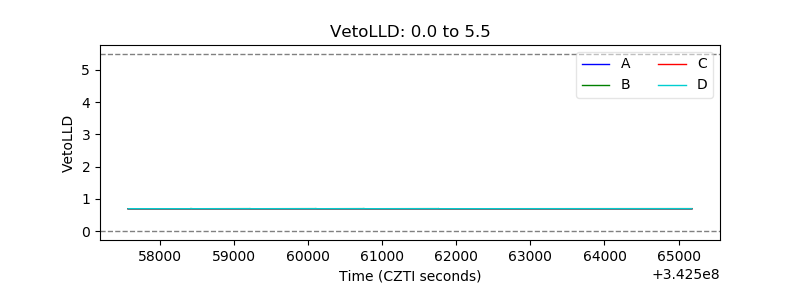 |
| Alpha Counter | 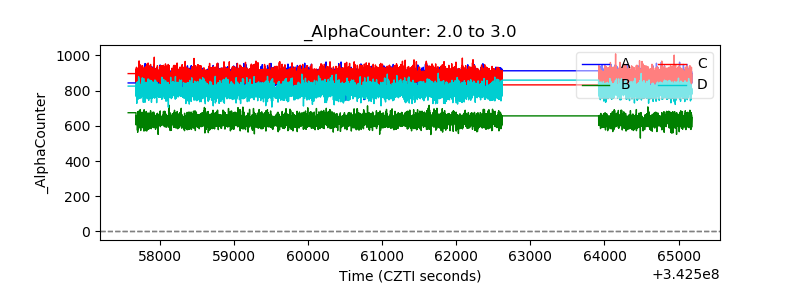 |
| _CPM_Rate | 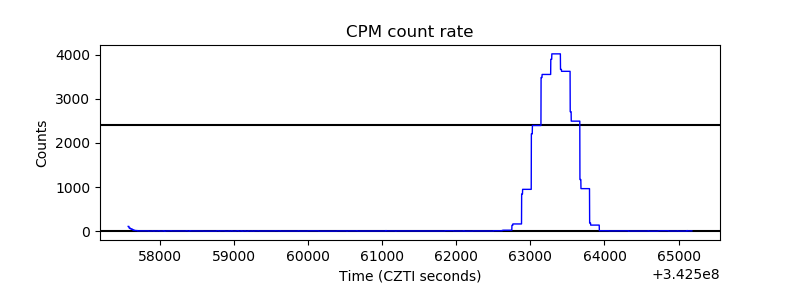 |
| CZT Counter | 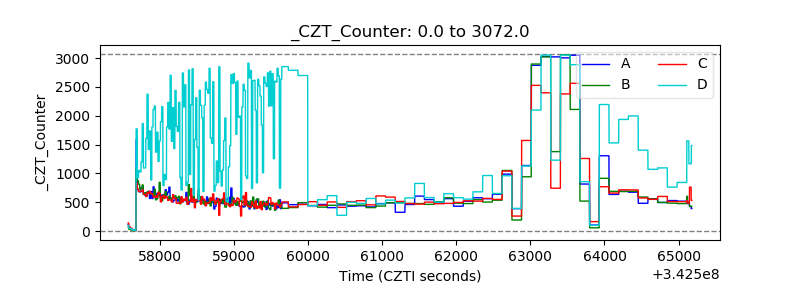 |
| +2.5 Volts monitor |  |
| +5 Volts monitor |  |
| _ROLL_ROT | 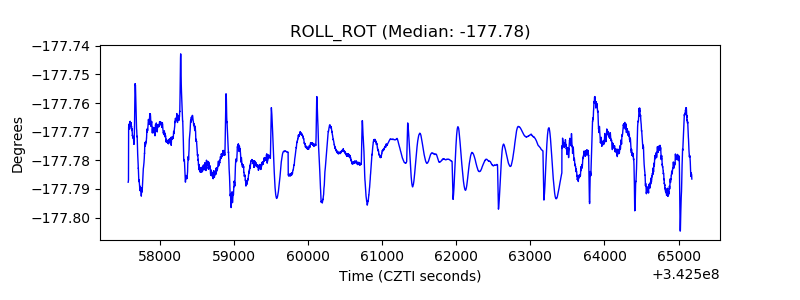 |
| _Roll_DEC | 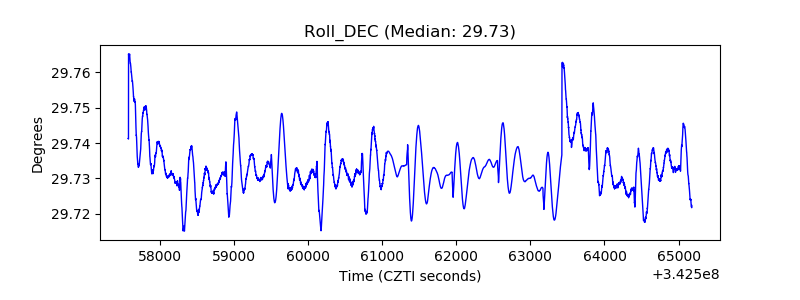 |
| _Roll_RA | 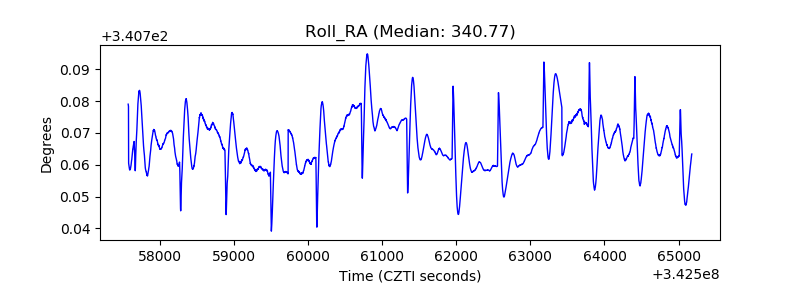 |
| Veto Counter | 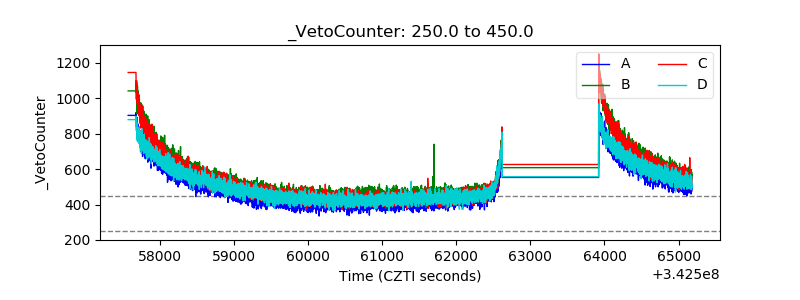 |