| Param | Original file | Final file |
|---|---|---|
| Filename | modeM0/AS1T03_257T01_9000003976_27661cztM0_level2.evt | modeM0/AS1T03_257T01_9000003976_27661cztM0_level2_quad_clean.evt |
| Size (bytes) | 608,987,520 | 98,449,920 |
| Size | 580.8 MB | 93.9 MB |
| Events in quadrant A | 3,224,492 | 665,104 |
| Events in quadrant B | 3,347,295 | 691,667 |
| Events in quadrant C | 3,333,013 | 642,762 |
| Events in quadrant D | 8,117,541 | 548,016 |
| Mode M9 | |||
|---|---|---|---|
| Quadrant | BADHDUFLAG | Total packets | Discarded packets |
| A | 0 | 19 | 0 |
| B | 0 | 20 | 0 |
| C | 0 | 20 | 0 |
| D | 0 | 20 | 0 |
| Mode M0 | |||
|---|---|---|---|
| Quadrant | BADHDUFLAG | Total packets | Discarded packets |
| A | 0 | 13347 | 0 |
| B | 0 | 13755 | 0 |
| C | 0 | 13663 | 0 |
| D | 0 | 28342 | 0 |
| Quadrant | Total seconds | Saturated seconds | Saturation percentage |
|---|---|---|---|
| A | 6215 | 29 | 0.466613% |
| B | 6215 | 42 | 0.675784% |
| C | 6215 | 84 | 1.351569% |
| D | 6215 | 1807 | 29.074819% |
Noise dominated data is calculated using 1-second bins in cleaned event files. If a bin has >2000 counts, and if more than 50% of those come from <1% of pixels, then it is considered to be noise-dominated and hence unusable.
| Quadrant | # 1 sec bins | Bins with >0 counts | Bins with >2000 counts | High rate bins dominated by noise | Noise dominated (total time) | Noise dominated (detector-on time) | Marked lightcurve |
|---|---|---|---|---|---|---|---|
| A | 7585 | 6216 | 4 | 4 | 0.05% | 0.06% | 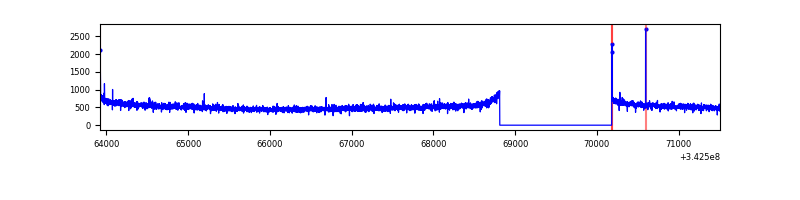 |
| B | 7585 | 6215 | 1 | 1 | 0.01% | 0.02% | 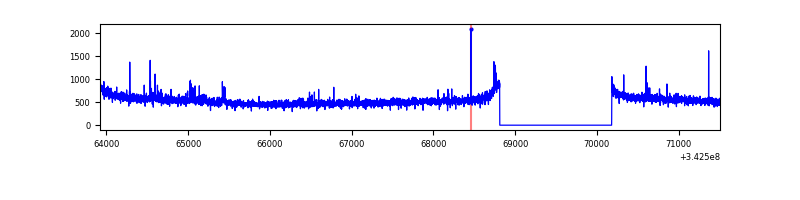 |
| C | 7585 | 6215 | 3 | 3 | 0.04% | 0.05% | 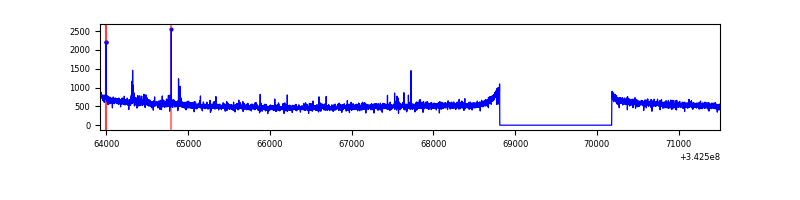 |
| D | 7585 | 6216 | 1545 | 1545 | 20.37% | 24.86% | 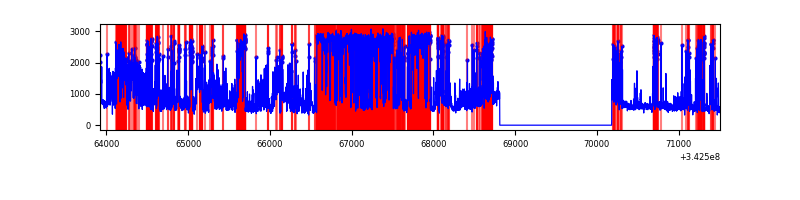 |
Top three noisy pixels from each quadrant. If the there are fewer than three noisy pixels in the level2.evt file, extra rows are filled as -1
| Pixel properties | Quadrant properties | ||||||
|---|---|---|---|---|---|---|---|
| Quadrant | DetID | PixID | Counts | Sigma | Mean | Median | Sigma |
| A | 8 | 192 | 12446 | 70.66 | 830 | 815 | 164.6 |
| A | 13 | 254 | 10923 | 61.41 | 830 | 815 | 164.6 |
| A | 3 | 137 | 7196 | 38.77 | 830 | 815 | 164.6 |
| B | 0 | 230 | 38988 | 248.58 | 836 | 817 | 153.6 |
| B | 12 | 111 | 17783 | 110.49 | 836 | 817 | 153.6 |
| B | 11 | 111 | 16038 | 99.12 | 836 | 817 | 153.6 |
| C | 14 | 238 | 132456 | 704.15 | 805 | 812 | 187.0 |
| C | 2 | 16 | 33674 | 175.77 | 805 | 812 | 187.0 |
| C | 3 | 233 | 17580 | 89.69 | 805 | 812 | 187.0 |
| D | 1 | 52 | 5330160 | 33630.24 | 668 | 651 | 158.5 |
| D | 7 | 80 | 185636 | 1167.29 | 668 | 651 | 158.5 |
| D | 2 | 250 | 47307 | 294.41 | 668 | 651 | 158.5 |
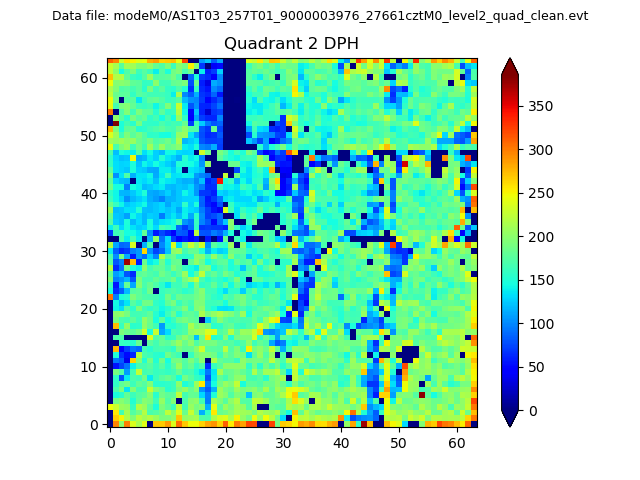
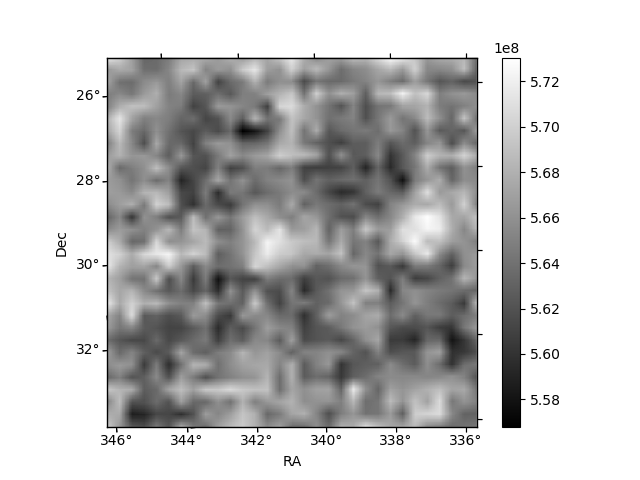
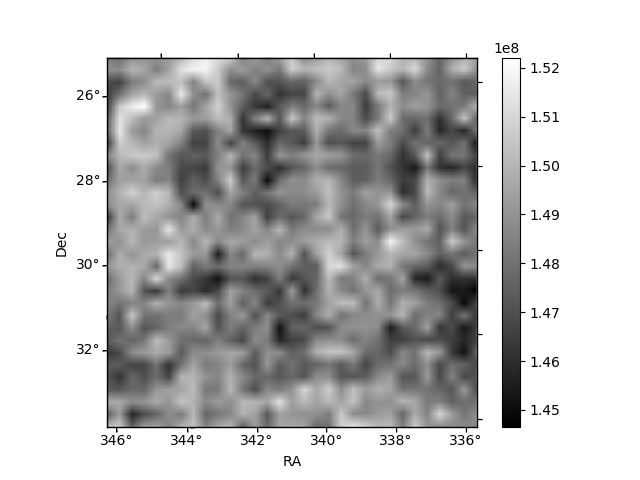
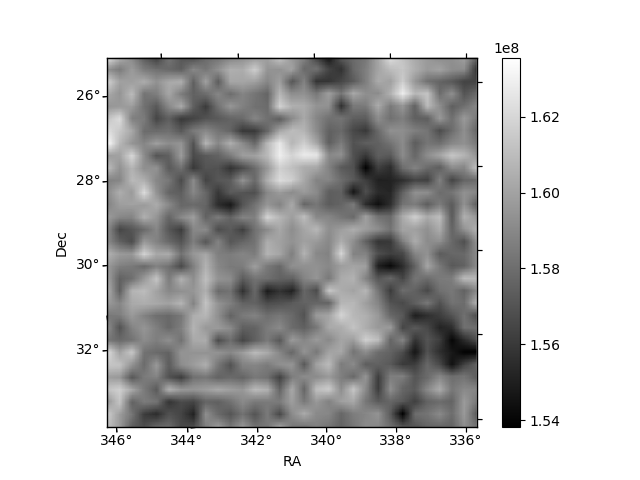
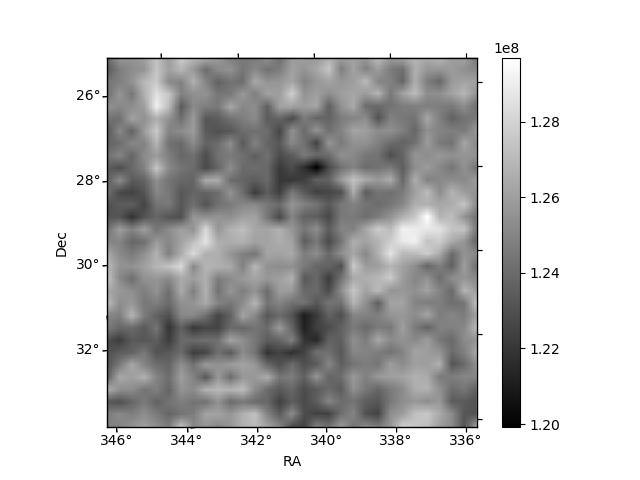
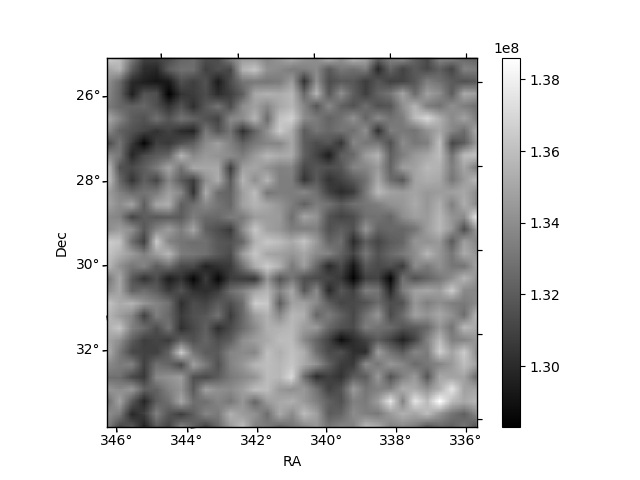
Histogram calculated using DETX and DETY for each event in the final _common_clean file
| Quadrant A | 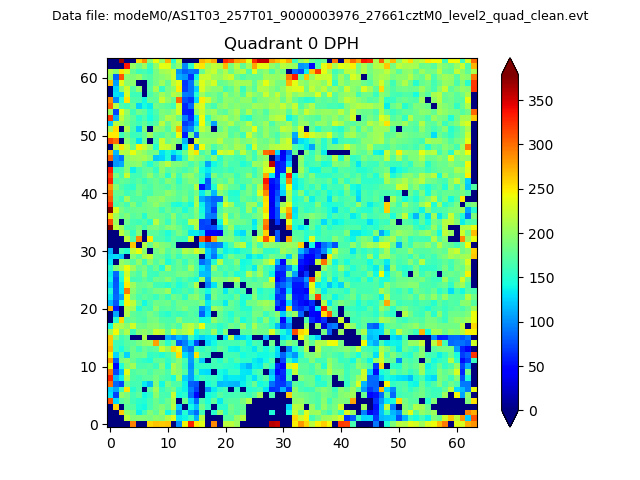 |
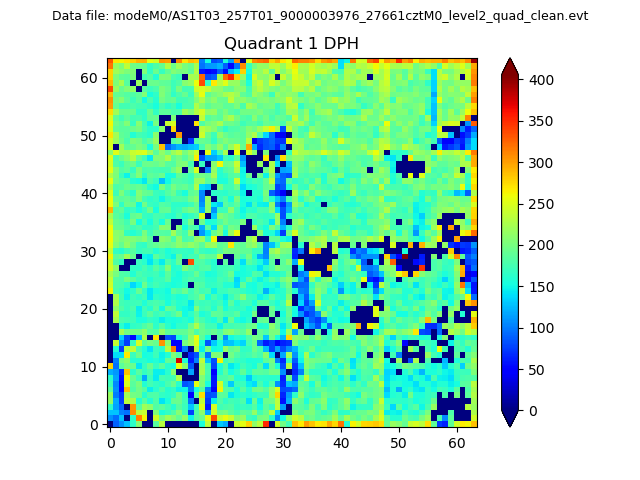 |
Quadrant B |
|---|---|---|---|
| Quadrant D | 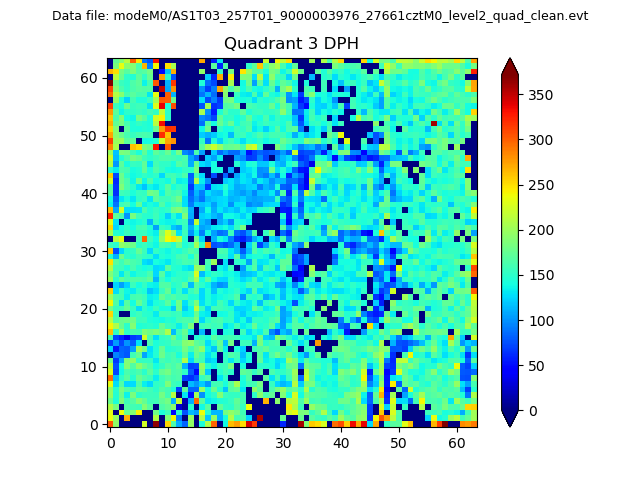 |
 |
Quadrant C |
| Plot type | Count rate plots | Images |
|---|---|---|
| Comparison with Poisson distribution Blue bars denote a histogram of data divided into 1 sec bins. Red curve is a Poisson curve with rate = median count rate of data. |
 |
 |
| Quadrant-wise count rates Data is divided into 100 sec bins |
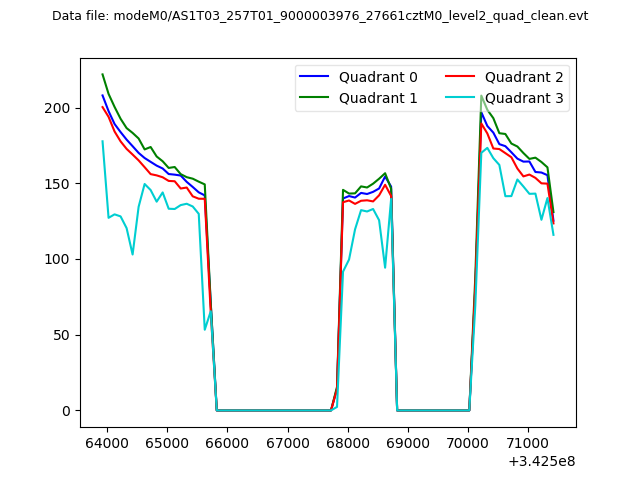 |
|
| Module-wise count rates for Quadrant A Data is divided into 100 sec bins |
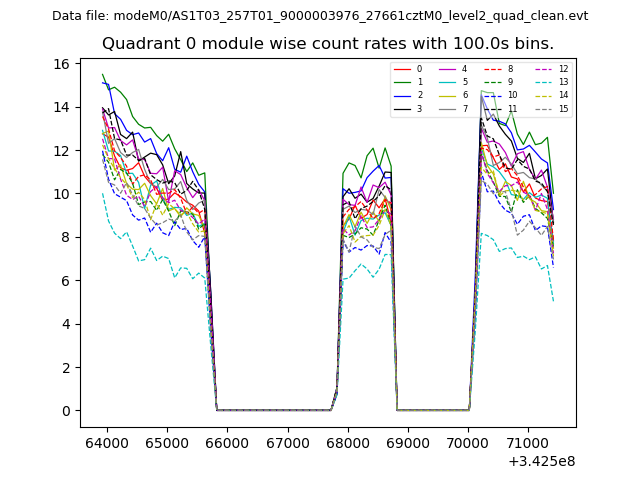 |
 |
| Module-wise count rates for Quadrant B Data is divided into 100 sec bins |
 |
 |
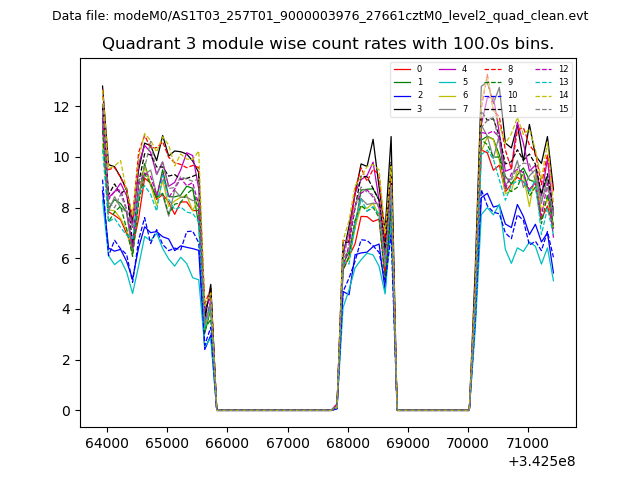
| Module-wise count rates for Quadrant C Data is divided into 100 sec bins |
 |
 |
| Module-wise count rates for Quadrant D Data is divided into 100 sec bins |
 |
 |
| Parameter | Plot |
|---|---|
| CZT HV Monitor |  |
| D_VDD | 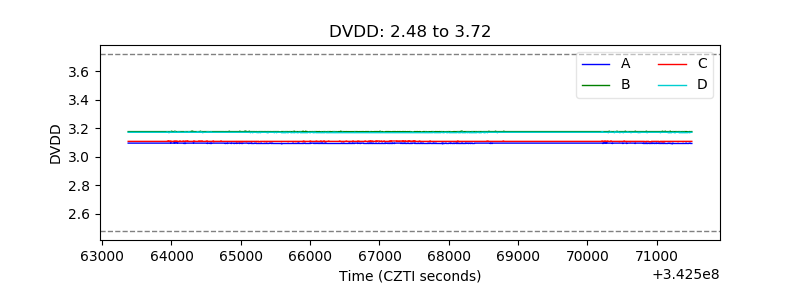 |
| Temperature 1 | 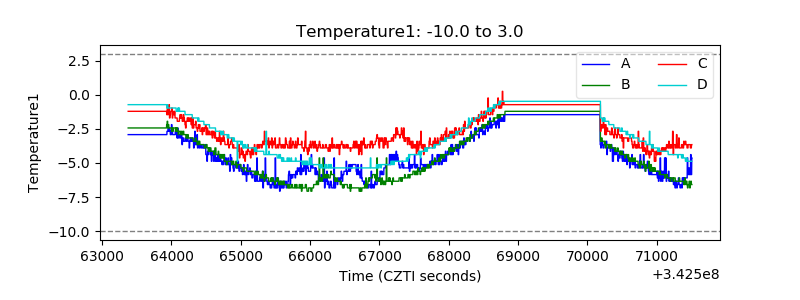 |
| Veto HV Monitor | 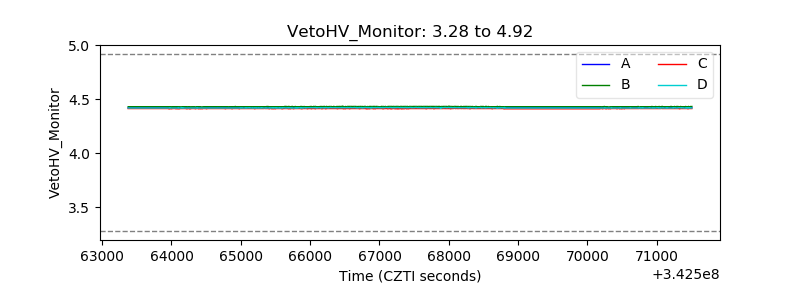 |
| Veto LLD | 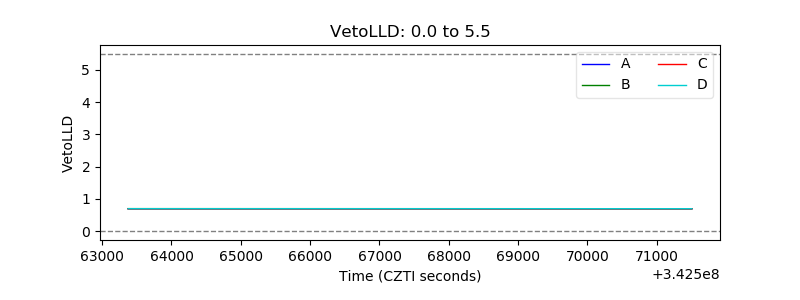 |
| Alpha Counter | 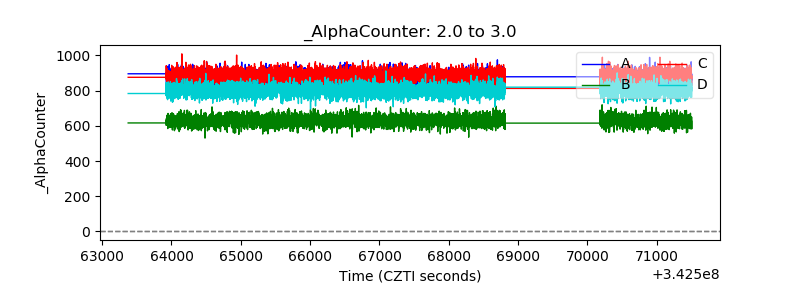 |
| _CPM_Rate | 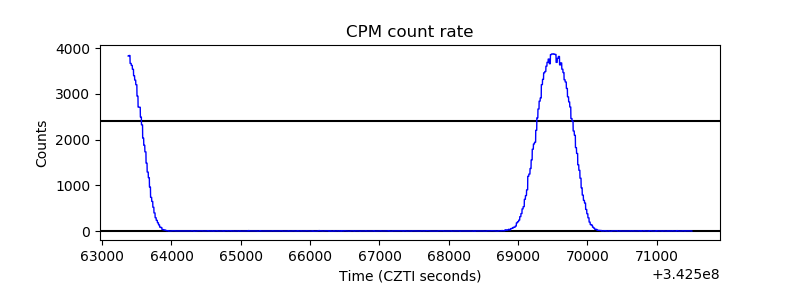 |
| CZT Counter | 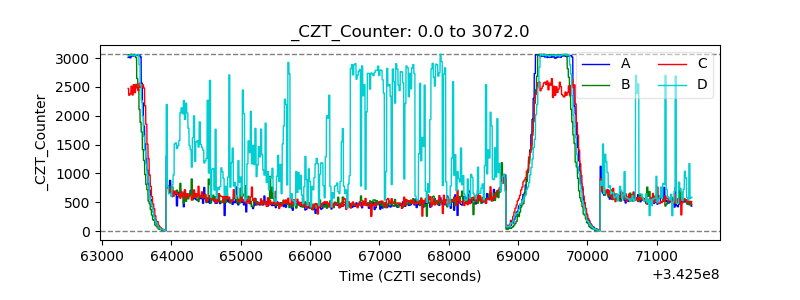 |
| +2.5 Volts monitor |  |
| +5 Volts monitor |  |
| _ROLL_ROT | 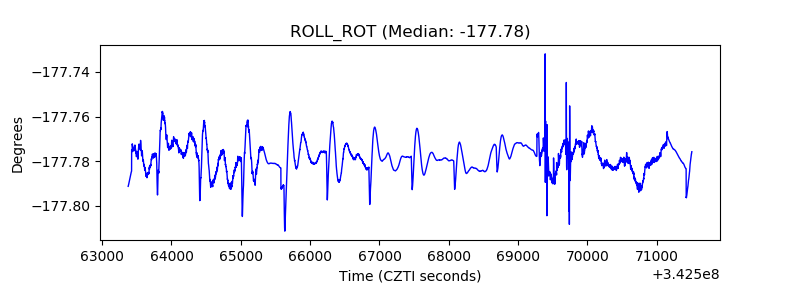 |
| _Roll_DEC | 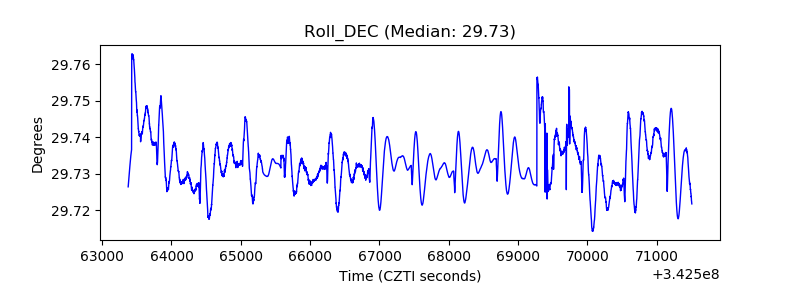 |
| _Roll_RA | 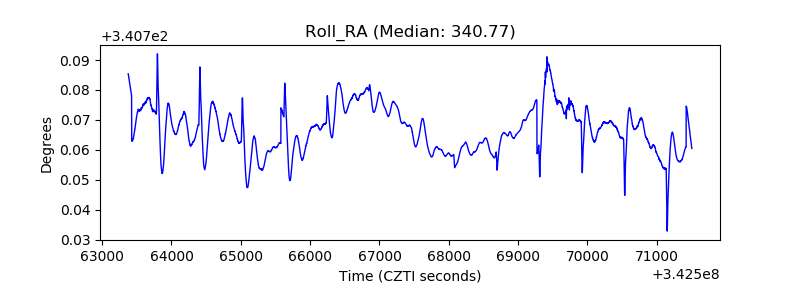 |
| Veto Counter | 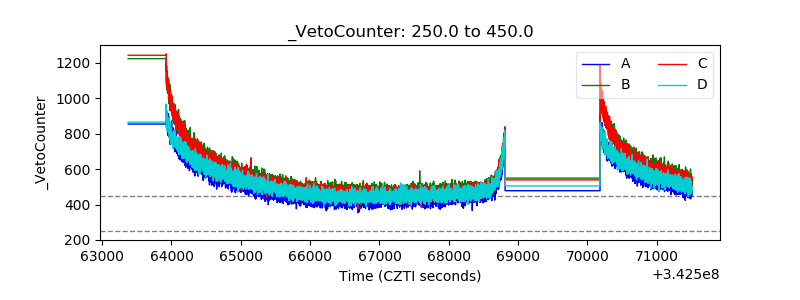 |